


Japanese Yen weakens against US Dollar amid hawkish FOMC minutes
- Japanese Yen trades lower against the US Dollar as the latter is broadly firm.
- The FOMC minutes signaled that policymakers expect one more interest rate hike this year.
- Japan’s Current Account remains stronger in August.
The Japanese Yen (JPY) is down against the US Dollar (USD) on Thursday, with the USD/JPY pair trading 0.12% higher at around 158.20 in the European session. The pair gains as the US Dollar reflects broader strength.
US Dollar Price This week
The table below shows the percentage change of US Dollar (USD) against listed major currencies this week. US Dollar was the strongest against the Swiss Franc.
| USD | EUR | GBP | JPY | CAD | AUD | NZD | CHF | |
|---|---|---|---|---|---|---|---|---|
| USD | 0.64% | 0.35% | 0.24% | -0.00% | -0.11% | 0.39% | 0.66% | |
| EUR | -0.64% | -0.30% | -0.32% | -0.60% | -0.75% | -0.26% | 0.02% | |
| GBP | -0.35% | 0.30% | -0.02% | -0.35% | -0.45% | 0.06% | 0.33% | |
| JPY | -0.24% | 0.32% | 0.02% | -0.26% | -0.26% | 0.19% | 0.44% | |
| CAD | 0.00% | 0.60% | 0.35% | 0.26% | -0.03% | 0.33% | 0.68% | |
| AUD | 0.11% | 0.75% | 0.45% | 0.26% | 0.03% | 0.51% | 0.77% | |
| NZD | -0.39% | 0.26% | -0.06% | -0.19% | -0.33% | -0.51% | 0.27% | |
| CHF | -0.66% | -0.02% | -0.33% | -0.44% | -0.68% | -0.77% | -0.27% |
The heat map shows percentage changes of major currencies against each other. The base currency is picked from the left column, while the quote currency is picked from the top row. For example, if you pick the US Dollar from the left column and move along the horizontal line to the Japanese Yen, the percentage change displayed in the box will represent USD (base)/JPY (quote).
As of writing, the US Dollar Index (DXY), which gauges the Greenback’s value against six major currencies, trades marginally higher to near 102.30, but is close to its annual high of 102.54 posted earlier this week.
The US Dollar remains firm amid increased expectations that the Federal Reserve (Fed) will deliver another interest rate hike by the year-end. On Wednesday, the Federal Open Market Committee (FOMC) minutes of the September policy meeting also signaled at least one more interest rate hike is needed in the remainder of the year.
“Several officials warned that the AI buildout could eventually push aggregate demand ahead of supply, creating additional upward pressure on prices. The staff’s economic outlook was also stronger than in July, reinforcing the view that the economy could withstand further policy tightening. Against that backdrop, most participants considered another rate increase by year-end likely to be appropriate,” FOMC minutes showed.
Analysts at Societe Generale also said in a note that FOMC minutes yesterday reaffirmed the tilt towards another rate increase before the end of the year.
On Tokyo front, Japan’s Current Account data has come in stronger than expected. The data showed that the surplus increased to 4,062 billion Yen in August, beating 3,194 billion Yen estimates, and the prior release of 2,988 billion Yen.
USD/JPY Technical Analysis
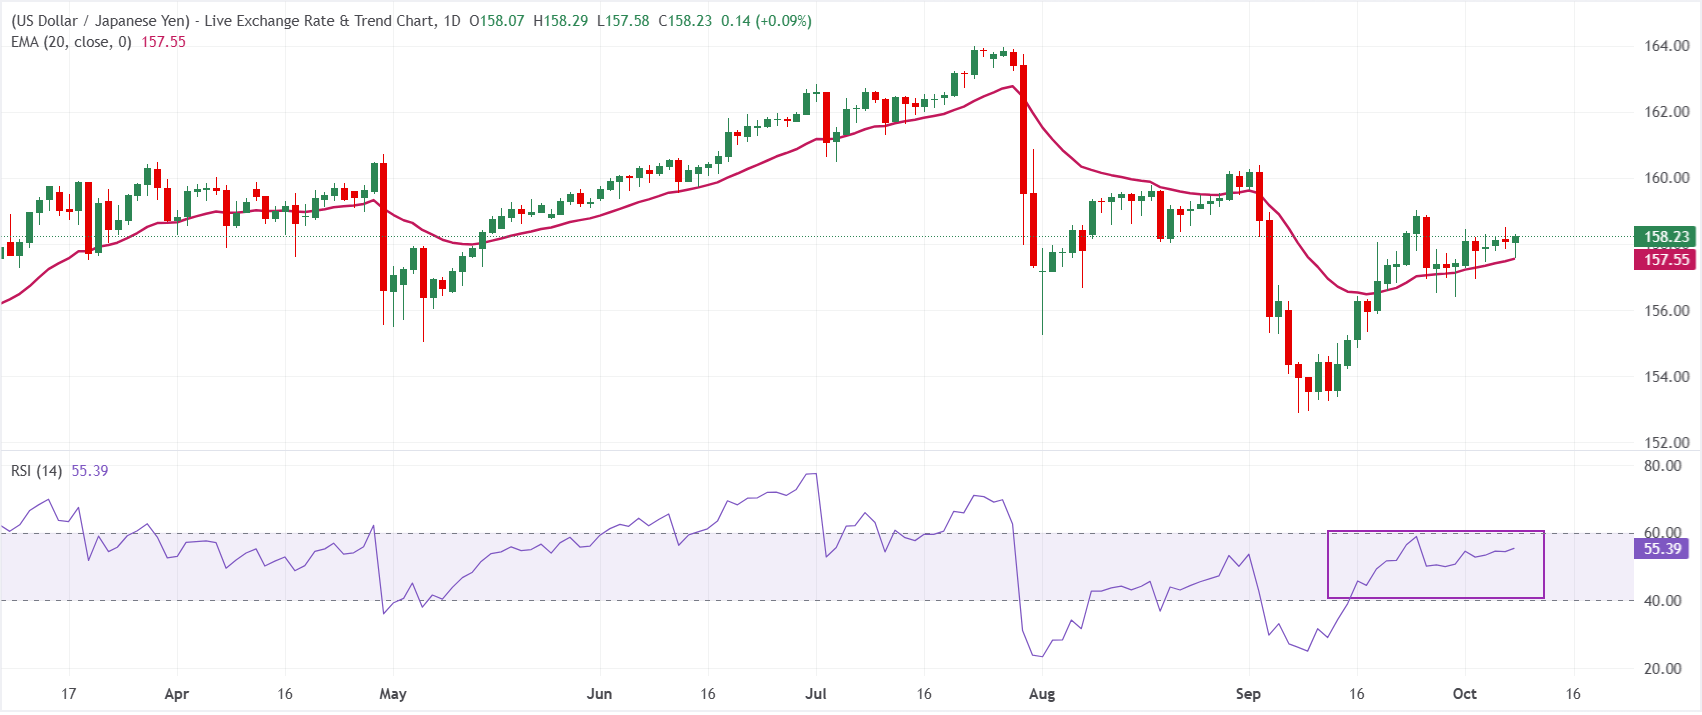
In the daily chart, USD/JPY trades at 158.22. The pair holds a bullish near-term bias as price advances above the 20-day exponential moving average (EMA) at 157.55, suggesting underlying demand remains in control after the latest rebound from last week’s lows. The Relative Strength Index (RSI) at 55.36 sits comfortably in positive territory, hinting that buying pressure is constructive rather than overextended.
On the downside, initial support is located at the 20-day EMA around 157.55, where a daily close back below this level would signal fading upside momentum and a deeper corrective phase toward recent lows. With no major technical resistance levels immediately overhead in this dataset, price action is likely to remain driven by momentum and broader market factors while the pair holds above the 157.55 support area.
(The technical analysis of this story was written with the help of an AI tool. Know more.)
Economic Indicator
FOMC Minutes
FOMC stands for The Federal Open Market Committee that organizes 8 meetings in a year and reviews economic and financial conditions, determines the appropriate stance of monetary policy and assesses the risks to its long-run goals of price stability and sustainable economic growth. FOMC Minutes are released by the Board of Governors of the Federal Reserve and are a clear guide to the future US interest rate policy.
Last release: Wed Oct 07, 2026 18:00
Frequency: Irregular
Actual: -
Consensus: -
Previous: -
Source: Federal Reserve
Minutes of the Federal Open Market Committee (FOMC) is usually published three weeks after the day of the policy decision. Investors look for clues regarding the policy outlook in this publication alongside the vote split. A bullish tone is likely to provide a boost to the greenback while a dovish stance is seen as USD-negative. It needs to be noted that the market reaction to FOMC Minutes could be delayed as news outlets don’t have access to the publication before the release, unlike the FOMC’s Policy Statement.
Recommended Articles


