


USD/JPY Price Forecast: Recovery stalls below key moving averages
- USD/JPY trades sideways on Tuesday despite a broadly stronger US Dollar.
- Technically, the pair remains capped below a cluster of key moving averages on the daily chart.
- Momentum has improved, but a clear break above the 158.44-159.53 resistance zone is needed to strengthen the upside.
USD/JPY trades flat on Tuesday as the Japanese Yen (JPY) holds firm in thin holiday trading during Japan’s Silver Week. However, a broadly stronger US Dollar (USD) keeps the Yen’s gains in check. At the time of writing, USD/JPY trades around 157.46.
The US Dollar Index (DXY), which tracks the Greenback’s value against a basket of six major currencies, trades around 100.60, near levels last seen in late July, supported by expectations of further Federal Reserve (Fed) interest rate hikes. Traders are also closely watching Middle East developments after remarks from US President Donald Trump at the UN offered little sign that tensions could ease anytime soon.
Yen steadies as BoJ rate check tempers USD/JPY upside
Analysts at MUFG note that the Yen “initially weakened sharply after the BoJ’s latest policy update on Friday,” with USD/JPY “hitting a high of 158.05” before dropping back towards 157.00. They highlight that the trigger for the late-Friday rebound was “reports that the BoJ had conducted a rate check during the New York trading session,” which sent “a clear signal that they are prepared to intervene again if the yen continues to weaken.”
MUFG argues that the “rate check should help to dampen market expectations for how much the yen will be allowed to weaken in the near-term as USD/JPY moves closer to the 160.00-level.” Looking ahead, the bank believes that the BoJ’s “new phase” for monetary policy is “consistent with a rate hike every three months,” although they caution that “the combination of higher energy prices and widening yield spreads is making it more difficult for Japanese policymakers to prevent a weaker yen, and increasing pressure to intervene again to buy more time.”
Technical analysis
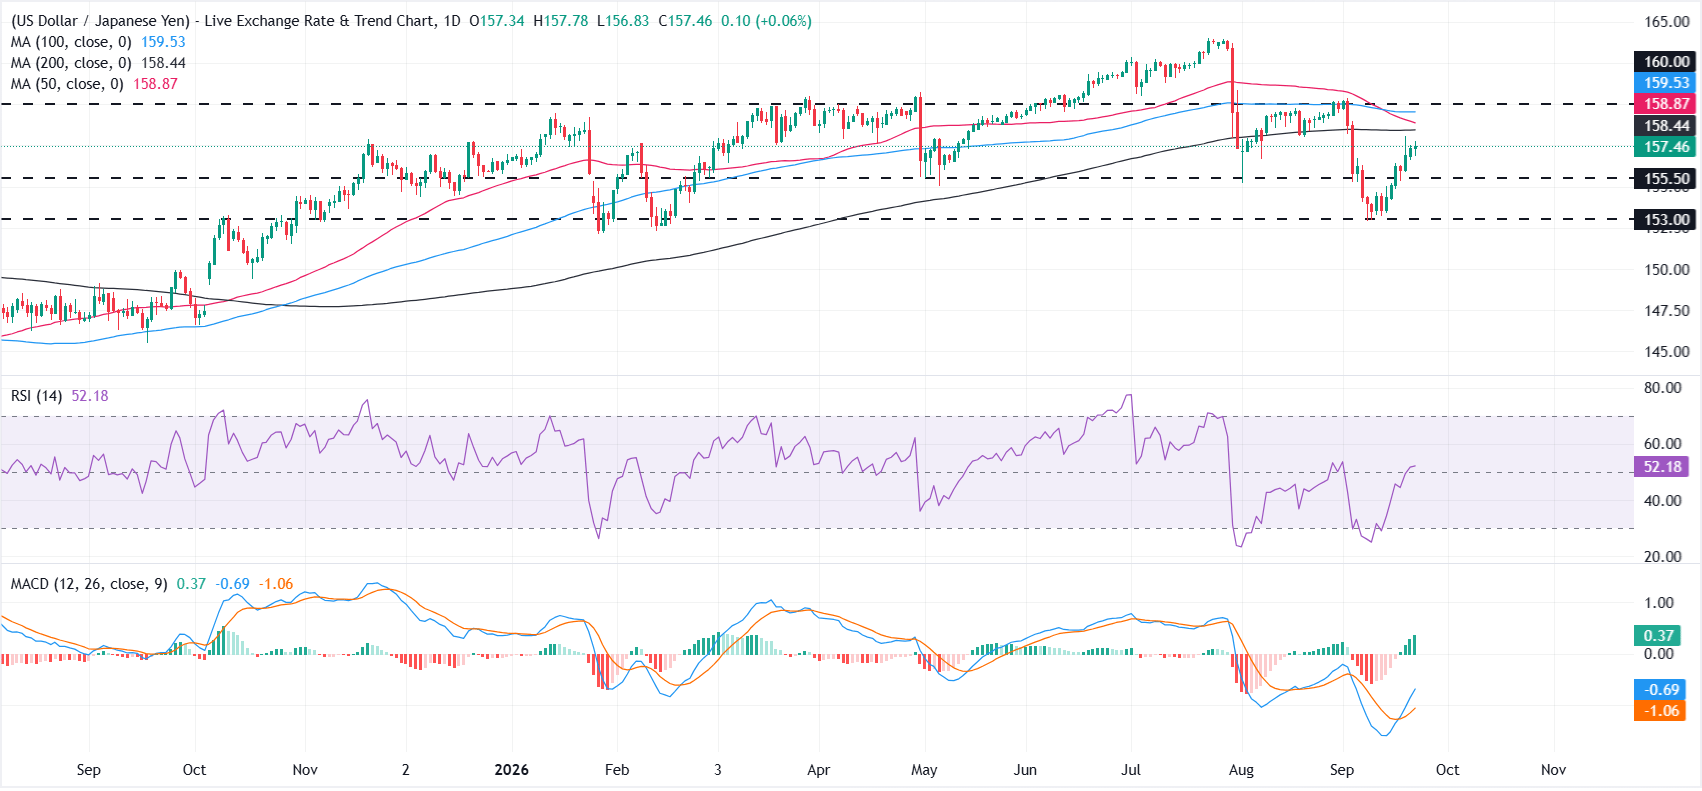
From a technical perspective, USD/JPY has recovered most of the sharp decline seen at the start of the month, when the pair fell from near 160 to 153. However, the recovery remains capped by a cluster of key moving averages on the daily chart.
Despite this heavy overhead structure, momentum has improved, with the Relative Strength Index hovering around 52 and the Moving Average Convergence Divergence (MACD) turning positive, which hints at fading downside pressure but not yet at a clear bullish reversal.
On the topside, initial resistance is seen at the 200-day SMA at 158.44, followed by the 50-day SMA at 158.86 and the 100-day SMA at 159.53. The psychological 160 mark acts as the next key barrier. A sustained break above this level could expose 164, near the 40-year high touched in late July.
On the downside, initial support is seen near 155.50, followed by 153. A clear move above the moving-average cluster would be needed to strengthen the bullish outlook.
(The technical analysis of this story was written with the help of an AI tool. Know more.)
Japanese Yen Price Today
The table below shows the percentage change of Japanese Yen (JPY) against listed major currencies today. Japanese Yen was the strongest against the British Pound.
| USD | EUR | GBP | JPY | CAD | AUD | NZD | CHF | |
|---|---|---|---|---|---|---|---|---|
| USD | 0.24% | 0.23% | 0.03% | 0.23% | 0.21% | -0.03% | 0.03% | |
| EUR | -0.24% | -0.02% | -0.20% | -0.00% | -0.03% | -0.28% | -0.20% | |
| GBP | -0.23% | 0.02% | -0.21% | -0.01% | -0.02% | -0.27% | -0.18% | |
| JPY | -0.03% | 0.20% | 0.21% | 0.19% | 0.18% | -0.10% | 0.02% | |
| CAD | -0.23% | 0.00% | 0.01% | -0.19% | -0.01% | -0.27% | -0.17% | |
| AUD | -0.21% | 0.03% | 0.02% | -0.18% | 0.01% | -0.26% | -0.16% | |
| NZD | 0.03% | 0.28% | 0.27% | 0.10% | 0.27% | 0.26% | 0.10% | |
| CHF | -0.03% | 0.20% | 0.18% | -0.02% | 0.17% | 0.16% | -0.10% |
The heat map shows percentage changes of major currencies against each other. The base currency is picked from the left column, while the quote currency is picked from the top row. For example, if you pick the Japanese Yen from the left column and move along the horizontal line to the US Dollar, the percentage change displayed in the box will represent JPY (base)/USD (quote).
Recommended Articles


