

GBP/USD Price Forecast: Attracts slight bids below trendline near 1.3360

Source Fxstreet
  • GBP/USD rises to near 1.3372 as the British Pound gains after upbeat UK Retail Sales data.
  • UK Retail Sales rose by 0.5% MoM in August.
  • The BoE leaves interest rates unchanged at 3.75% with 6-3 vote split, as expected.

The British Pound (GBP) is up 0.1% at around 1.3372 against the US Dollar (USD) during the European trading session on Friday. The GBP/USD pair gains as the British currency rises, following the release of the surprisingly upbeat United Kingdom (UK) Retail Sales data for August.

The Office for National Statistics (ONS) has reported that Retail Sales grew by 0.5% Month-on-Month (MoM) after declining at a same pace. The data was expected to contract by 0.2%.

While the British currency has reacted positively to the Retail Sales data, it underperformed the entire data-packed and Bank of England (BoE) policy week.

What happened at the BoE policy meeting

The BoE opted to keep Bank Rate unchanged at 3.75% in a 6–3 vote, as expected, while acknowledging a more challenging inflation backdrop. The UK central bank said that it expects Consumer Price Index (CPI) to rise to around 3.75% in the last quarter this year and slightly above 4% in early 2027 in the wake of higher energy prices. The BoE sees little evidence of material second-round effects of inflation in wages and prices.

Meanwhile, the US Dollar trades firmly on hawkish repricing of Federal Reserve’s (Fed) interest rate expectations. In the European trade, the US Dollar Index (DXY), which gauges the Greenback’s value against six major currencies, posts a fresh six-week high at 100.38.

GBP/USD Technical Analysis
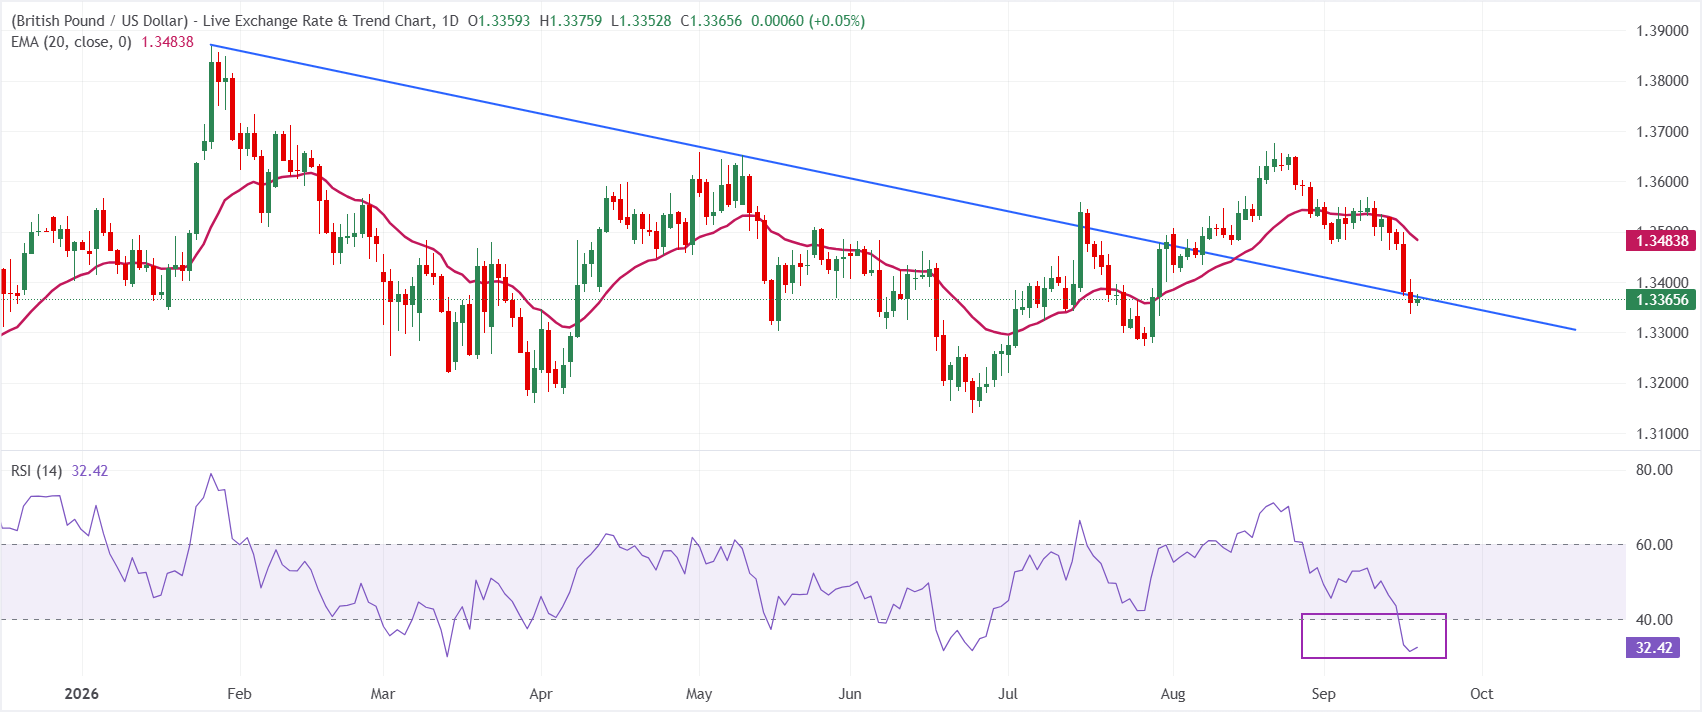
GBP/USD trades at 1.3366, keeping a bearish near-term tone as spot is well below the 20-period Exponential Moving Average (EMA) at 1.3484 and close to the downtrend resistance line coming in around 1.3372.

The location of price beneath these key overhead levels suggests rallies remain vulnerable, while the Relative Strength Index (14) at 32.4 hovers just above oversold territory, hinting that selling pressure is still dominant but nearing exhaustion rather than outright collapse.

On the topside, initial resistance is defined by the broken downtrend line at 1.3372, with a more significant cap at the 20-period EMA clustered near 1.3484, where fresh supply could emerge if the pair attempts a corrective bounce. Looking down, the pair could decline to near 1.3300 if it fails to hold the September 17 low at 1.3336.

(The technical analysis of this story was written with the help of an AI tool. Know more.)

Economic Indicator

Retail Sales (MoM)

The Retail Sales data, released by the Office for National Statistics on a monthly basis, measures the volume of sales of goods by retailers in Great Britain directly to end customers. Changes in Retail Sales are widely followed as an indicator of consumer spending. Percent changes reflect the rate of changes in such sales, with the MoM reading comparing sales volumes in the reference month with the previous month. Generally, a high reading is seen as bullish for the Pound Sterling (GBP), while a low reading is seen as bearish.

Read more.

Last release: Fri Sep 18, 2026 06:00

Frequency: Monthly

Actual: 0.5%

Consensus: -0.2%

Previous: -0.5%

Source: Office for National Statistics

Disclaimer: For information purposes only. Past performance is not indicative of future results.
placeholder
Fed hike odds near 90% into Wednesday's decision — how to trade the dollar, gold and the S&P 500A 0.3% monthly core CPI print has lifted the market-implied probability of a 25bp Fed hike on 16 September to roughly 86.5% ~ 90%, which would be the first increase since July 2023. Here is the decision timeline, the pricing versus the forecasts, both scenarios, and the key levels for the dollar, gold and the S&P 500.
Author  Suzie
Sep 14, Mon
A 0.3% monthly core CPI print has lifted the market-implied probability of a 25bp Fed hike on 16 September to roughly 86.5% ~ 90%, which would be the first increase since July 2023. Here is the decision timeline, the pricing versus the forecasts, both scenarios, and the key levels for the dollar, gold and the S&P 500.
placeholder
Silver breaks $64 as precious metals rebound — can gold hold the $4,280 line into the Fed decision?Silver has climbed back above $64 an ounce for the first time this week, leading a broad rebound across precious metals hours before the Federal Reserve delivers what is expected to be its first rate hike since 2023. Spot silver was last at $64.64, up 1.49% on the day, while gold reclaimed $4,300 and platinum and palladium both advanced. The question now is whether the bounce is a genuine turn — or a pause before the Fed's dot plot decides the next move.
Author  Suzie
Sep 16, Wed
Silver has climbed back above $64 an ounce for the first time this week, leading a broad rebound across precious metals hours before the Federal Reserve delivers what is expected to be its first rate hike since 2023. Spot silver was last at $64.64, up 1.49% on the day, while gold reclaimed $4,300 and platinum and palladium both advanced. The question now is whether the bounce is a genuine turn — or a pause before the Fed's dot plot decides the next move.
placeholder
Bitcoin falls below $75,000 as the CLARITY Act fails in the Senate — what the vote means for cryptoThe US Senate blocked the Digital Asset Market CLARITY Act in a 49-50 procedural vote, sending Bitcoin briefly below $75,000 — its biggest one-day drop since June. Ethereum fell more than 8%, Coinbase slid 10% and $75 billion of crypto market value evaporated. Here is what the vote was, why it failed, and the levels that matter now.
Author  Suzie
Sep 16, Wed
The US Senate blocked the Digital Asset Market CLARITY Act in a 49-50 procedural vote, sending Bitcoin briefly below $75,000 — its biggest one-day drop since June. Ethereum fell more than 8%, Coinbase slid 10% and $75 billion of crypto market value evaporated. Here is what the vote was, why it failed, and the levels that matter now.
placeholder
Dow drops 631 points as the Fed hikes — but futures are rebounding: what's next for US stocks?The Dow fell 631 points and the S&P 500 closed below 7,600 after the Fed hiked rates for the first time since 2023, with the dot plot showing 16 of 18 officials expect more tightening. Asia-session futures are already recovering — here are the levels and analyst views that decide whether 7,500 holds.
Author  Irene Q.
Yesterday 02: 54
The Dow fell 631 points and the S&P 500 closed below 7,600 after the Fed hiked rates for the first time since 2023, with the dot plot showing 16 of 18 officials expect more tightening. Asia-session futures are already recovering — here are the levels and analyst views that decide whether 7,500 holds.
placeholder
Dollar index tops 100 for the first time since July as the Fed's hawkish dot plot sinks inThe U.S. dollar index broke back above 100 for the first time since 31 July after the Fed delivered its first rate hike since 2023, with the dot plot showing 16 of 18 officials expect at least one more increase this year. Here are the levels that matter for DXY, the currencies feeling it most, and what to watch next.
Author  Irene Q.
Yesterday 02: 45
The U.S. dollar index broke back above 100 for the first time since 31 July after the Fed delivered its first rate hike since 2023, with the dot plot showing 16 of 18 officials expect at least one more increase this year. Here are the levels that matter for DXY, the currencies feeling it most, and what to watch next.
Related Instrument
goTop
quote