

Ethereum (ETHUSD) Is up 1.51% on Oct 21: What Are the Risk Factors?

Source Tradingkey

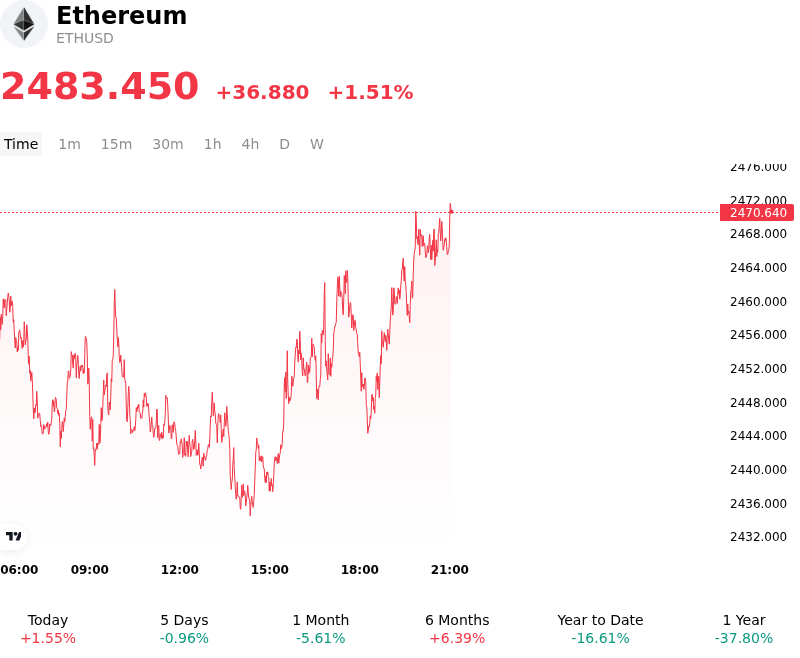
Ethereum (ETHUSD) is up 1.51% at Oct 21 09:05(ET), now at $2483.45, with a 7-day up of 2.87%.
SummaryOverview

What is driving Ethereum (ETHUSD)’s stock price up today?

Ethereum traded higher as spot market buyers successfully defended critical technical support levels near the demand zone, where key moving averages and the realized on-chain cost basis provided a solid floor. After enduring weeks of persistent selling pressure, a stabilization in leverage positioning triggered a squeeze on overcrowded short positions in the derivatives market, helping drive prices back above key psychological thresholds. The move reflects a localized rebound driven by short covering and spot market defense following a deep correction earlier in the month.

A primary factor easing downside pressure was the initial stabilization in spot Ethereum ETF flows. Following an aggressive stretch of net outflows through early October that erased previous monthly gains, daily redemption activity moderated significantly, with selective net daily inflows returning to institutional products. While overall ETF flows remain cautious, the pause in institutional redemptions alleviated immediate supply overhangs in the spot market and improved short-term liquidity conditions.

Macroeconomic factors and ecosystem catalysts also supported risk sentiment across the digital asset space. As global yields consolidated and crypto derivative volatility settled near cycle lows, market participants turned their focus toward upcoming monetary policy signals. Medium-term fundamental drivers added further resilience, highlighted by ongoing protocol testnet advancements aimed at expanding network capacity and growing corporate treasury engagement.

Despite the positive intraday price action, the movement represents a tactical relief bounce within a broader consolidation phase rather than a full structural trend reversal. Technical resistance near short-term moving averages continues to restrict aggressive upside extensions. Institutional market participants continue to monitor Federal Reserve interest rate expectations, Treasury yield movements, and the consistency of spot ETF capital flows before committing significant long-term capital.

Technical Analysis of Ethereum (ETHUSD)

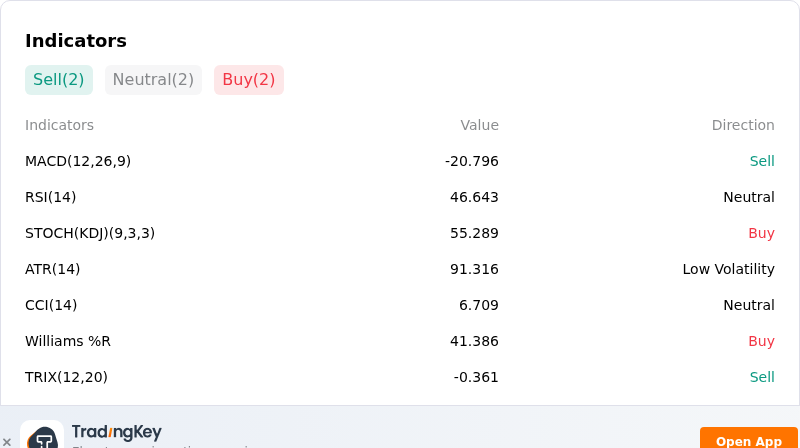
Technically, Ethereum (ETHUSD) shows a MACD (12,26,9) value of -20.796, indicating a sell signal. The RSI at 46.643 suggests neutral condition and the Williams %R at 41.386 suggests buy condition. Please monitor closely.
IndicatorAnalysis

More details about Ethereum (ETHUSD)

Recent Events and Risks:

  • Institutional Capital Flight via Spot ETF Outflows: U.S. spot Ethereum ETFs have suffered sustained net outflows, including $103.3 million withdrawn in a single session led by BlackRock's ETHA, reflecting a sharp decline in institutional demand and maintaining persistent selling pressure on spot markets.
  • Leveraged Long Liquidation Cascades Near Key Support Levels: Following significant long wipeouts across derivative venues, open interest maps show up to $801 million in cumulative long leverage vulnerable to forced liquidation if ETH breaks down through the critical $2,279–$2,350 support zone.
  • Whale Deposits and Increasing Exchange Reserve Balances: On-chain tracking revealed multiple dormant and large whale addresses transferring over $74.5 million worth of ETH to centralized exchanges such as Kraken and Gemini, elevating immediate sell-side order book supply and market overhang.
  • Macro Risk-Off Sentiment Ahead of Federal Reserve Decision: Hotter-than-expected inflation figures and macroeconomic uncertainty leading into the upcoming Federal Reserve policy decision continue to weigh heavily on risk assets, weakening broader crypto market liquidity and appetite.
Disclaimer: For information purposes only. Past performance is not indicative of future results.
placeholder
Dollar presses 102 as the 10-year yield sits at 5.14% — and October hike odds are only 17%The dollar index closed at 101.99 (+0.20%) on Monday after briefly topping 102.07, while the 10-year Treasury yield rose to 5.14% and the 2-year hit 4.774% — yet futures price only about a 17% chance of a hike at the October 27-28 FOMC, versus roughly 90% for December. The driver is a global bond selloff, not a Fed repricing: France's 10-year OAT jumped to 4.84% ~ 4.94% and the OAT-Bund spread widened to 140 ~ 146bp. Here are the levels, the cross-asset read-through and what to watch.
Author  Irene Q.
Oct 20, Tue
The dollar index closed at 101.99 (+0.20%) on Monday after briefly topping 102.07, while the 10-year Treasury yield rose to 5.14% and the 2-year hit 4.774% — yet futures price only about a 17% chance of a hike at the October 27-28 FOMC, versus roughly 90% for December. The driver is a global bond selloff, not a Fed repricing: France's 10-year OAT jumped to 4.84% ~ 4.94% and the OAT-Bund spread widened to 140 ~ 146bp. Here are the levels, the cross-asset read-through and what to watch.
placeholder
Meta's AI bill just hit $145 billion — and it issued a new share class to pay for itMeta reported record third-quarter revenue of $64.60 billion, up 26% from a year earlier, and raised full-year 2026 capital expenditure guidance to $135-145 billion from $130-145 billion. To fund that build-out without touching Mark Zuckerberg's voting control, the company announced a 2-for-1 stock split that hands every Class A holder a new non-voting Class C share. Here are the four lines that matter, the peer group that is being re-rated alongside it, and the bull and bear cases.
Author  Irene Q.
Oct 22, Thu
Meta reported record third-quarter revenue of $64.60 billion, up 26% from a year earlier, and raised full-year 2026 capital expenditure guidance to $135-145 billion from $130-145 billion. To fund that build-out without touching Mark Zuckerberg's voting control, the company announced a 2-for-1 stock split that hands every Class A holder a new non-voting Class C share. Here are the four lines that matter, the peer group that is being re-rated alongside it, and the bull and bear cases.
placeholder
The Fed will sit still on October 28 — but 100 of 100 economists now expect a December hikeA Reuters poll run October 16-20 found 94 of 100 economists expecting the Fed to hold at 3.75-4.00% on October 28 — and all 100 expecting a hike in December, against less than half a month earlier. The market is close to the same price, with CME FedWatch at roughly 17% for October and 82.8% for December. With the Fed in blackout since October 17, here are the five dates that decide the rest of the year, what each one is priced for, and the two directions each can take.
Author  Irene Q.
Oct 22, Thu
A Reuters poll run October 16-20 found 94 of 100 economists expecting the Fed to hold at 3.75-4.00% on October 28 — and all 100 expecting a hike in December, against less than half a month earlier. The market is close to the same price, with CME FedWatch at roughly 17% for October and 82.8% for December. With the Fed in blackout since October 17, here are the five dates that decide the rest of the year, what each one is priced for, and the two directions each can take.
placeholder
Gold Price Analysis Today | Forex Gold Analysis | XAU/USD Analysis - October 23, 2026Get the latest gold price analysis, forex gold insights, and XAU/USD analysis for October 23, 2026. Read on for the details.
Author  Mitrade
21 hours ago
Get the latest gold price analysis, forex gold insights, and XAU/USD analysis for October 23, 2026. Read on for the details.
placeholder
Nasdaq closes at 26,008.86 — 8.9 points above 26,000, and the credit market never blinkedThe Nasdaq Composite fell 2.60% to 26,008.86 on October 22, its worst session since June, as Meta sank 6.98% on 2026 capex guidance of $135–145 billion. But the equal-weight S&P 500 rose 0.73%, high-yield credit was flat and 10-year yields fell 20 basis points. This was an AI de-rating, not a risk-off event — here is the transmission chain, the 29,000 / 28,200 levels and what would prove it wrong.
Author  Irene Q.
17 hours ago
The Nasdaq Composite fell 2.60% to 26,008.86 on October 22, its worst session since June, as Meta sank 6.98% on 2026 capex guidance of $135–145 billion. But the equal-weight S&P 500 rose 0.73%, high-yield credit was flat and 10-year yields fell 20 basis points. This was an AI de-rating, not a risk-off event — here is the transmission chain, the 29,000 / 28,200 levels and what would prove it wrong.
goTop
quote