


Ethereum (ETHUSD) Suddenly Goes down 1.54% on Oct 18: What's Driving This
Ethereum (ETHUSD) is down 1.54% at Oct 18 09:35(ET), now at $2381.72, with a 7-day down of 6.07%.
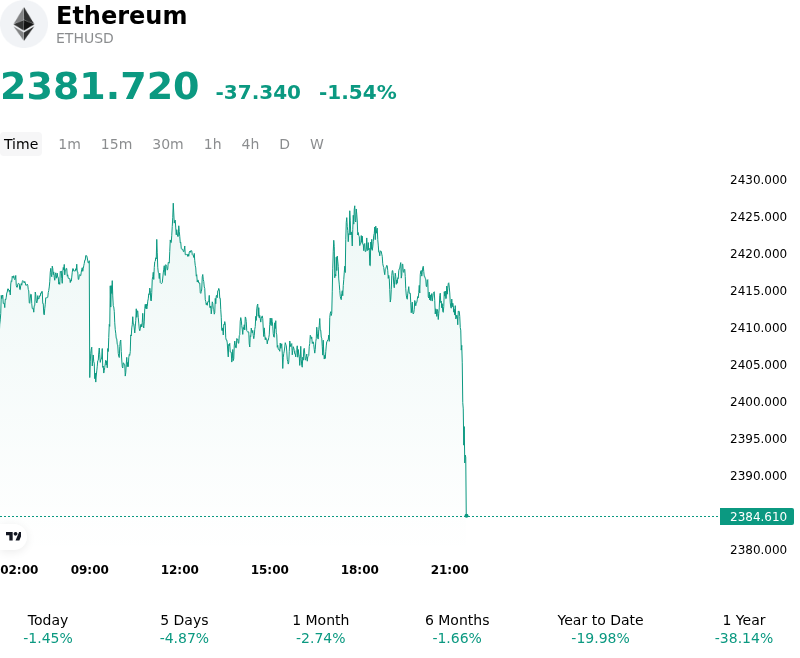
What is driving Ethereum (ETHUSD)’s stock price down today?
Ethereum experienced downward pressure during the trading session as a combination of institutional flow dynamics and persistent macroeconomic headwinds weighed on risk appetite across digital asset markets. Capital outflows from spot Ethereum exchange-traded funds acted as a primary drag on price momentum, reflecting ongoing institutional de-risking amidst elevated Treasury yields and a resilient U.S. dollar. The persistent high-rate environment has tightened global financial conditions, reducing institutional allocation to higher-beta smart contract platforms and favoring defensive cash and fixed-income assets.
In the derivatives market, the pullback triggered localized liquidations of leveraged long positions as Ethereum struggled to sustain momentum above key technical resistance levels. Option market skew reflected heightened demand for downside protection among institutional desks, while open interest contracted as traders unwound speculative positions in response to macro uncertainty. The lack of aggressive dip-buying interest highlights cautious market sentiment, with market participants awaiting clearer signals on monetary policy trajectories and institutional liquidity before re-engaging with long-side leverage.
From an ecosystem perspective, network fundamentals remain structurally sound ahead of upcoming protocol efficiency upgrades, though short-term capital reallocation toward competing Layer-1 protocols and stablecoins has temporarily muted spot demand on the primary chain. Despite current volatility, institutional engagement with tokenized assets and Layer-2 scaling solutions continues to provide underlying structural support. Investors continue to monitor spot ETF flow trends, Federal Reserve rate expectations, and broader liquidity conditions to assess whether the move reflects temporary event-driven profit-taking or a broader macro-driven consolidation.
Technical Analysis of Ethereum (ETHUSD)
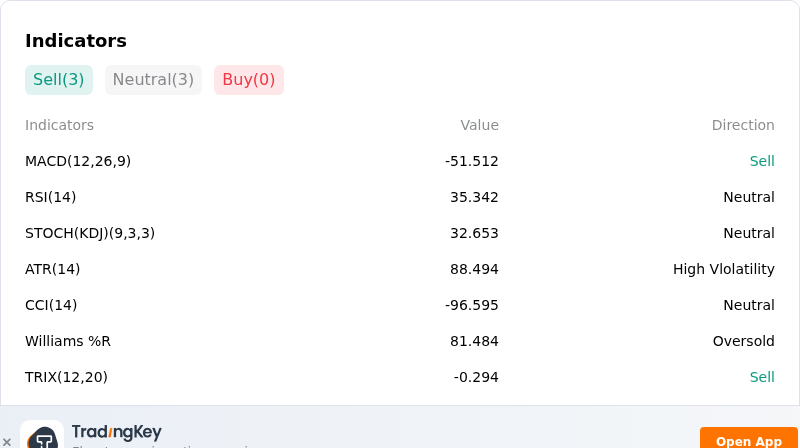
Technically, Ethereum (ETHUSD) shows a MACD (12,26,9) value of -51.512, indicating a sell signal. The RSI at 35.342 suggests neutral condition and the Williams %R at 81.484 suggests oversold condition. Please monitor closely.
More details about Ethereum (ETHUSD)
Recent Events and Risks:
- Institutional Spot ETF Outflows: U.S. spot Ethereum ETFs experienced a sharp wave of redemptions, including a single-day net loss of $129.5 million led by BlackRock's ETHA. This extended multi-day outflow streak has drained hundreds of millions from spot products, eroding institutional liquidity buffers that previously anchored ETH price stability.
- Leverage Unwinds and Liquidation Cascades: Derivatives markets suffered severe liquidation pressure with over $891 million in long positions wiped out across crypto venues. The forced unwind drove ETHUSD down to test critical support around $2,350, leaving concentrated long leverage vulnerable to secondary liquidation flushes toward lower support levels.
- On-Chain Whale Inflows and Depressed Spot Demand: On-chain tracking highlighted large holders depositing thousands of ETH onto centralized exchanges to manage unrealized losses, adding potential overhead sell-side pressure. Concurrently, the Coinbase Premium Index turned negative (-0.117), signaling weakened U.S. institutional and retail spot buying relative to offshore platforms.
- Macroeconomic Inflation Headwinds: Hotter-than-expected U.S. Consumer Price Index inflation accelerating to 3.7% year-over-year drove a sharp rise in U.S. Treasury yields and strengthened the U.S. dollar. The macro shock triggered risk-off repricing across equities and digital assets, reducing overall risk appetite for high-beta tokens like Ethereum.
Recommended Articles


