


Ethereum (ETHUSD) Volatility Intensified on Oct 17: What You Should Know
Ethereum (ETHUSD) is down 1.58% at Oct 17 20:35(ET), now at $2413.24, with a 7-day down of 3.70%.
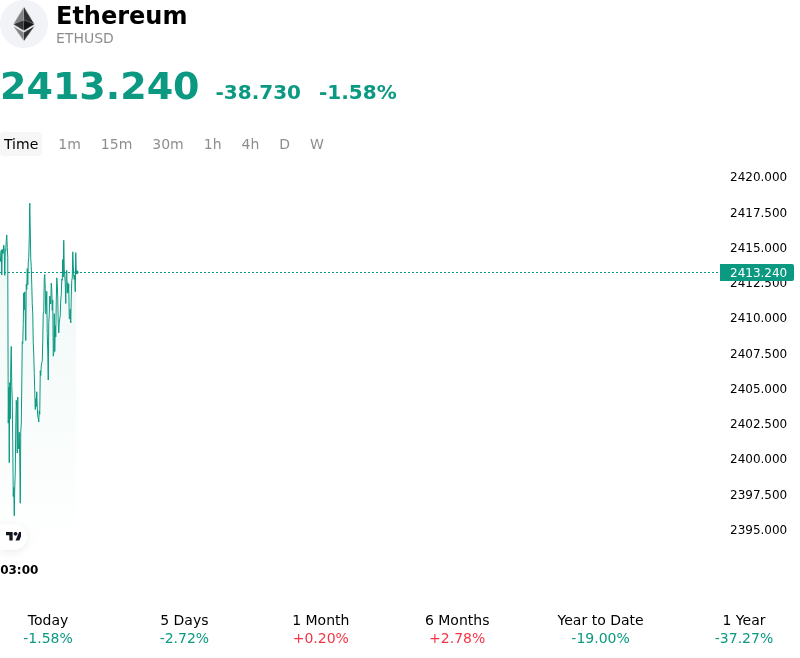
What is driving Ethereum (ETHUSD)’s stock price down today?
The pull-back in Ethereum reflects a broader risk-averse macro environment driven by persistent inflationary pressures and a hawkish recalibration of Federal Reserve monetary policy expectations. Stronger-than-expected economic and inflation data pushed benchmark U.S. Treasury yields higher and boosted the U.S. dollar, tightening global financial conditions. In this environment of elevated real yields, institutional risk appetite for non-yielding long-duration digital assets weakened, leading market participants to reduce risk exposure and reallocate capital toward safer cash equivalents. The reduced systemic liquidity directly impaired spot demand across top-tier crypto assets, placing downward pressure on smart-contract platforms.
Institutional capital flows through spot Ethereum exchange-traded funds added to the downside momentum, as consecutive sessions of net fund outflows signaled waning demand from institutional allocators. Without robust spot absorption from corporate and institutional buyers, market-making desks experienced thinned bid-side liquidity. This absence of structural spot buying exposed the market to derivatives-led fragility. As spot prices crossed key technical support levels, a cascade of forced long liquidations occurred across major derivatives exchanges. The automated closure of over-leveraged long positions amplified downside velocity, converting localized selling into a broader leverage flush.
From a structural perspective, the recent movement primarily represents a leverage-clearing event compounded by macro liquidity headwinds rather than a fundamental degradation of the Ethereum network. On-chain protocol activity and layer-2 ecosystem utilization remain functionally solid, though base-layer fee revenues continue to face structural compression due to off-chain rollup execution. Institutional investors remain focused on key macro and structural risks, including the real-yield differential between native Ethereum staking yields and risk-free U.S. Treasuries, ongoing spot ETF flow trajectories, and potential regulatory developments impacting decentralized finance protocols.
Technical Analysis of Ethereum (ETHUSD)
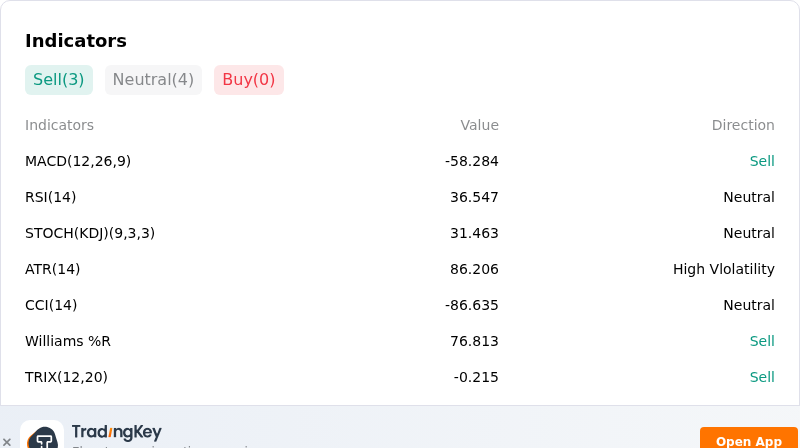
Technically, Ethereum (ETHUSD) shows a MACD (12,26,9) value of -58.284, indicating a sell signal. The RSI at 36.547 suggests neutral condition and the Williams %R at 76.813 suggests sell condition. Please monitor closely.
More details about Ethereum (ETHUSD)
Recent Events and Risks:
- Spot ETF Capital Outflows: U.S. spot Ethereum ETFs experienced renewed net daily redemptions exceeding $60 million to $129 million—led by heavy withdrawals from BlackRock's ETHA and Grayscale's ETHE—eroding institutional spot buying liquidity and amplifying sell-side pressure on spot exchanges.
- Derivatives Deleveraging and Support Breakdown: A severe leverage unwind triggered over $283 million in ETH long liquidations as the price broke down toward $2,350, leaving remaining leveraged open interest vulnerable to secondary liquidation cascades down to $2,200 if key technical support fails.
- Macro Inflation Shock and Risk-Off Sentiment: Hotter-than-expected U.S. CPI inflation data accelerating to 3.7% year-over-year fueled expectations of prolonged monetary tightening and rising bond yields, driving cross-asset equity selloffs that spilled into high-beta digital assets.
- Weakening U.S. Spot Demand and Deposit Inflows: On-chain metric weakness—highlighted by a negative Coinbase Premium Index—signals subdued buying demand from U.S. institutional and retail traders, while notable wallet transfers of ETH to exchange deposit addresses increase market supply overhang.
Recommended Articles


