


Canadian Natural Resources Ltd Stock (CNQ) Moved Up by 3.52% on Oct 16: What Signal Does It Send?
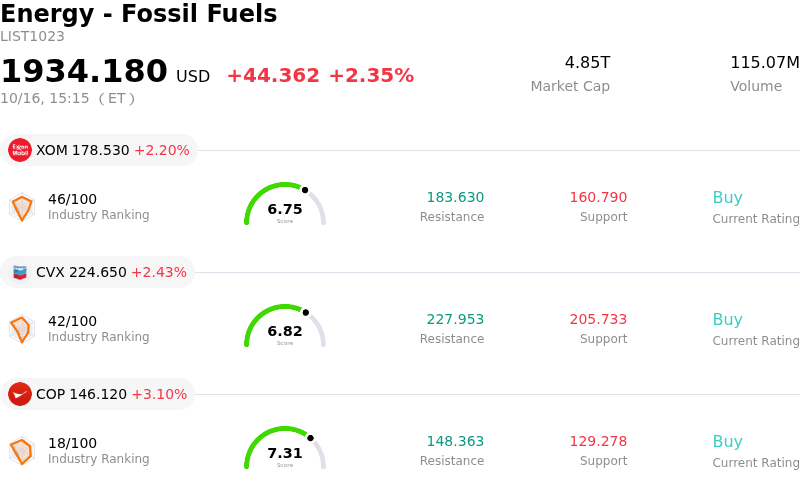
Canadian Natural Resources Ltd (CNQ) moved up by 3.52%. The Energy - Fossil Fuels sector is up by 2.35%. The company outperformed the industry. Top 3 stocks by turnover in the sector: Exxon Mobil Corp (XOM) up 2.20%; Chevron Corp (CVX) up 2.43%; ConocoPhillips (COP) up 3.10%.
What is driving Canadian Natural Resources Ltd (CNQ)’s stock price up today?
Canadian Natural Resources registered a firm upward move accompanied by notable intraday volatility, largely driven by strength across the broader energy sector and robust underlying commodity prices. Global crude oil benchmarks experienced heightened momentum following significant draws in U.S. crude inventories and ongoing geopolitical risks in key energy-producing regions that heightened supply tightness expectations. As a major North American oil and natural gas producer with heavy exposure to long-life oil sands and conventional crude assets, the company benefits directly from elevated energy realizations, attracting institutional capital during commodity-focused sector rotations.
In addition to supportive macroeconomic conditions, stock-specific dynamics provided a meaningful boost to market sentiment. Recent reporting revealed a substantial drop in short interest for the equity, forcing short sellers to cover positions and amplifying intraday buying pressure. Wall Street sentiment also remained constructive, bolstered by a series of favorable research analyst reports, price target revisions, and positive technical signals including bullish moving average crossovers. This alignment of declining bearish positioning and positive technical momentum created a strong bid for the stock throughout the trading session.
From an operational standpoint, investors continue to reward Canadian Natural Resources for its low-decline asset base, strong operational discipline, and reliable cash flow generation. The company's large operational scale across oil sands mining, upgrading, and natural gas production allows it to maintain robust free cash flows even during volatile market cycles. Coupled with its long-standing commitment to shareholder returns through disciplined capital allocation and sustainable dividend distributions, these structural strengths continue to reinforce investor confidence and underpin the stock's resilient upward trajectory.
Technical Analysis of Canadian Natural Resources Ltd (CNQ)
Technically, Canadian Natural Resources Ltd (CNQ) shows a MACD (12,26,9) value of 1.138, indicating a buy signal. The RSI at 72.606 suggests buy condition and the Williams %R at 0.069 suggests overbought condition. Please monitor closely.
Fundamental Analysis of Canadian Natural Resources Ltd (CNQ)
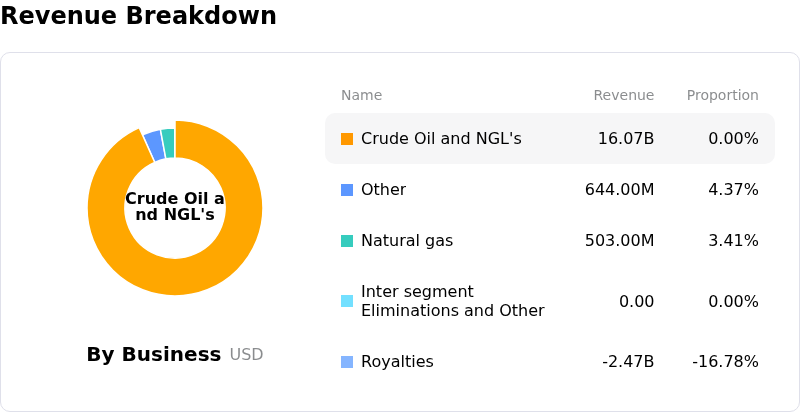
Canadian Natural Resources Ltd (CNQ) is in the Energy - Fossil Fuels industry. Its latest annual revenue is $28.35B, ranking 20 in the industry. The net profit is $7.91B, ranking 8 in the industry. Company Profile
Over the past month, multiple analysts have rated the company as Hold, with an average price target of $73.72, a high of $84.00, and a low of $65.00.
More details about Canadian Natural Resources Ltd (CNQ)
Company Specific Risks:
- Wall Street Analyst Downgrades: Raymond James downgraded Canadian Natural Resources to Market Perform (Hold), signaling that the stock's recent surge to 52-week highs near $52.57 has fully priced in operational catalysts and restricted further near-term valuation upside.
- Technical Overbought Signals and Profit-Taking: Short-term technical indicators, including the Relative Strength Index (RSI) exceeding 70 and Stochastic Oscillators reaching overbought territory, have triggered momentum divergence and intraday selling pressure near multi-year high resistance levels.
- Heavy Crude Realization and Differential Volatility: The company's heavy weighting in bitumen and synthetic crude oil leaves cash flow generation vulnerable to intraday fluctuations in Western Canadian Select (WCS) price differentials and regional egress constraint risks.
- Operational Turnaround and Maintenance Vulnerabilities: Unplanned downtime, cost inflation, or execution delays during scheduled turnarounds across core long-life assets—specifically the Athabasca Oil Sands Project and Horizon upgrading operations—pose direct operational downside to quarterly volume targets and operating margins.
Recommended Articles


