

BNB (BNBUSD) Suddenly Goes down 1.28% on Oct 15: What You Need to Watch

Source Tradingkey

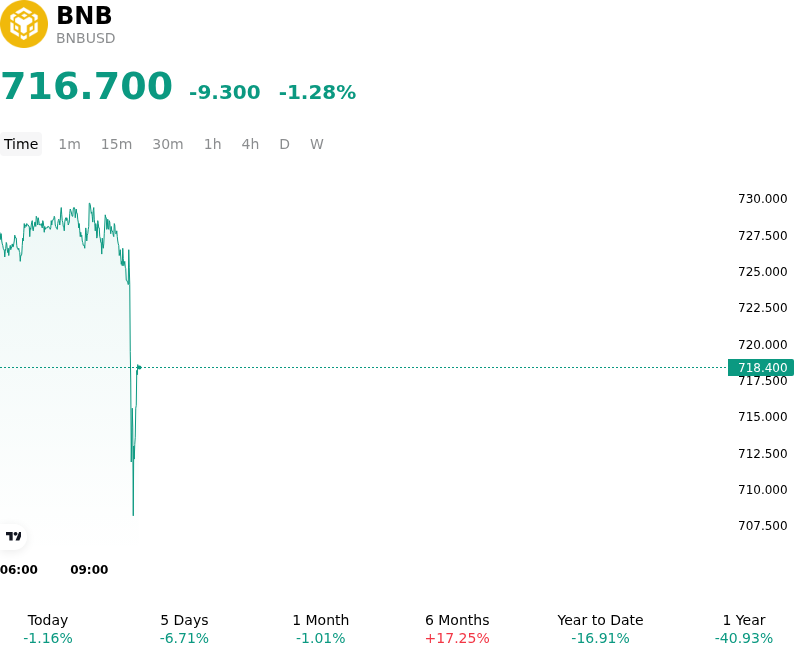
BNB (BNBUSD) is down 1.28% at Oct 15 22:40(ET), now at $716.7, with a 7-day down of 2.16%.
SummaryOverview

What is driving BNB (BNBUSD)’s stock price down today?

The intraday pullback in BNB reflected a combination of technical resistance, ecosystem capital rotation, and leverage reduction across cryptocurrency derivatives markets. After failing to clear overhead resistance near key short-term moving averages, selling pressure intensified as momentum traders unwound long exposure. This technical rejection coincided with broader consolidation across major altcoins, encouraging market participants to trim risk and lock in profits following recent multi-week advances.

Ecosystem-specific dynamics also contributed to the softening sentiment around the native utility token. While on-chain deployment and transaction volume across the BNB Smart Chain remain elevated, capital flows have temporarily fragmented. Fresh liquidity has increasingly migrated toward speculative secondary tokens and new protocol launches on the network rather than concentrating in the core underlying asset. Furthermore, because the network’s low fee architecture and zero-fee stablecoin transfer initiatives reduce gas costs for end users, strong network utilization has generated limited spot accumulation pressure for the native token. Investors are also monitoring network activity closely as the scheduled expiration of the zero-fee campaign approaches at month-end.

From a positioning standpoint, the downward pressure was amplified by localized long liquidations and a modest compression in open interest across futures exchanges. Institutional participants appear to be maintaining a cautious stance while awaiting the formal execution of the protocol's upcoming quarterly automated token burn. Although the continuous supply contraction algorithm provides structural support for the asset's long-term store-of-value narrative, immediate price action remains heavily influenced by broader macroeconomic risk sentiment, Federal Reserve interest rate expectations, and the market's ability to hold key technical moving average supports.

Technical Analysis of BNB (BNBUSD)

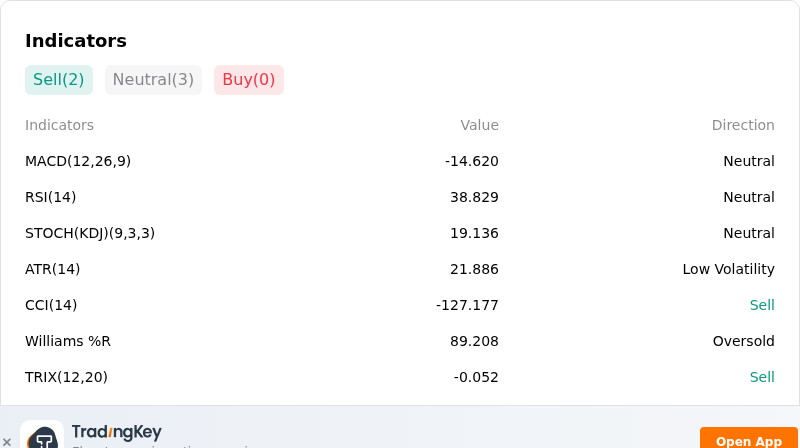
Technically, BNB (BNBUSD) shows a MACD (12,26,9) value of -14.620, indicating a neutral signal. The RSI at 38.829 suggests neutral condition and the Williams %R at 89.208 suggests oversold condition. Please monitor closely.
IndicatorAnalysis

More details about BNB (BNBUSD)

Recent Events and Risks:

  • Regulatory and Compliance Scrutiny: Ongoing U.S. Department of Justice inquiries into Binance's adherence to its 2023 settlement agreement—specifically concerning potential sanctions compliance lapses—continue to generate regulatory uncertainty and suppress institutional appetite for BNB.
  • Derivatives Unwind and Long Liquidations: A sharp market pull-back forced over $11 million in long-position liquidations for BNB derivatives, triggering a steep decline in futures open interest and driving rapid downside momentum below key support levels.
  • Technical Rejection and Market Structure Weakness: Repeated rejections at the $800 psychological resistance level, coupled with broader altcoin sell-offs and risk-off capital rotation, have intensified selling pressure and pushed BNB toward lower technical support thresholds near $720–$730.
  • Product Delistings and Margin Settlement Pressures: Upcoming exchange-announced delistings and the forced closure of margin and futures positions across select trading pairs on Binance have created localized liquidity adjustments and elevated short-term volatility risk across exchange-linked products.
Disclaimer: For information purposes only. Past performance is not indicative of future results.
placeholder
US September CPI preview: inflation set to hit 3.7% — will the Fed hike in December?US September CPI lands Wednesday with headline inflation seen at 3.7% y/y and core at 0.2% m/m. December hike odds sit near 70% — here are the scenarios, the calendar and the key levels.
Author  Irene Q.
Oct 10, Sat
US September CPI lands Wednesday with headline inflation seen at 3.7% y/y and core at 0.2% m/m. December hike odds sit near 70% — here are the scenarios, the calendar and the key levels.
placeholder
Yen inches toward 159 as Tokyo reopens — where is the line in the sand before 160?USD/JPY traded around 158.5 on Tuesday after Monday's 158.60 close — the highest since September 24 — as Tokyo reopened and the market re-focused on two dates dominating the yen calendar: the G20 finance ministers' meeting in Bangkok on October 15 and the Bank of Japan's October 30 decision. Here are the three forces leaning on the yen, the positioning picture, and the scenarios into Wednesday's US CPI.
Author  Irene Q.
Oct 13, Tue
USD/JPY traded around 158.5 on Tuesday after Monday's 158.60 close — the highest since September 24 — as Tokyo reopened and the market re-focused on two dates dominating the yen calendar: the G20 finance ministers' meeting in Bangkok on October 15 and the Bank of Japan's October 30 decision. Here are the three forces leaning on the yen, the positioning picture, and the scenarios into Wednesday's US CPI.
placeholder
Strong profits, falling shares: bank earnings day one meets a memory-chip rout — with CPI and ASML aheadGoldman Sachs blew past estimates (EPS $17.01 vs $13.09 expected, profit +33%) while JPMorgan missed ($5.75 vs $5.93) and Wells Fargo fell 3% — yet the S&P 500 finished flat at 7,805.45, pinned below its record close as a memory-chip rout (SOX −2.67%, Micron under $1,000) kept the pressure on. Tonight brings the week's decider: US September CPI at 8:30 ET, then Bank of America, Morgan Stanley, BlackRock and ASML before the open. Here are the levels, both cases, and the watch list.
Author  Irene Q.
Yesterday 06: 06
Goldman Sachs blew past estimates (EPS $17.01 vs $13.09 expected, profit +33%) while JPMorgan missed ($5.75 vs $5.93) and Wells Fargo fell 3% — yet the S&P 500 finished flat at 7,805.45, pinned below its record close as a memory-chip rout (SOX −2.67%, Micron under $1,000) kept the pressure on. Tonight brings the week's decider: US September CPI at 8:30 ET, then Bank of America, Morgan Stanley, BlackRock and ASML before the open. Here are the levels, both cases, and the watch list.
placeholder
Bitcoin's V-shaped rebound: from $80,953 back above $83,000 — spot buyers step in as the Fed softens, but ETF outflows lingerBitcoin slid to $80,953 on October 13 — then snapped back above $83,000, reclaiming the 81,847–82,305 'golden zone' on spot-led buying as Williams and Waller cooled the Fed's hawkish tone and the dollar pulled back from its 18-month high. But October ETF outflows near $386 million and a fear-and-greed reading of 56 say the repair is unfinished. Here are the levels, the transmission chain and both cases ahead of tonight's US CPI.
Author  Suzie
Yesterday 06: 36
Bitcoin slid to $80,953 on October 13 — then snapped back above $83,000, reclaiming the 81,847–82,305 'golden zone' on spot-led buying as Williams and Waller cooled the Fed's hawkish tone and the dollar pulled back from its 18-month high. But October ETF outflows near $386 million and a fear-and-greed reading of 56 say the repair is unfinished. Here are the levels, the transmission chain and both cases ahead of tonight's US CPI.
placeholder
Gold Price Analysis Today | Forex Gold Analysis | XAU/USD Analysis - October 14, 2026Get the latest gold price analysis, forex gold insights, and XAU/USD analysis for October 14, 2026. Read on for the details.
Author  Mitrade
Yesterday 07: 11
Get the latest gold price analysis, forex gold insights, and XAU/USD analysis for October 14, 2026. Read on for the details.
goTop
quote