


Merck & Co Inc Stock (MRK) Moved Up by 3.73% on Oct 14: A Full Analysis
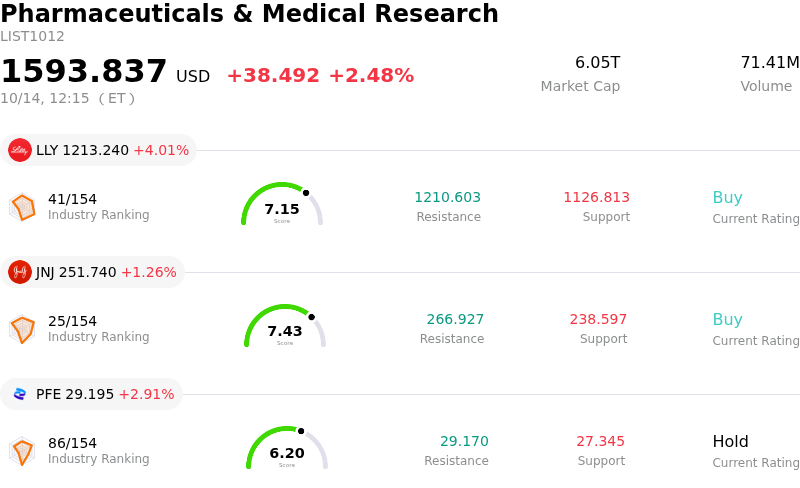
Merck & Co Inc (MRK) moved up by 3.73%. The Pharmaceuticals & Medical Research sector is up by 2.48%. The company outperformed the industry. Top 3 stocks by turnover in the sector: Eli Lilly and Co (LLY) up 4.01%; Johnson & Johnson (JNJ) up 1.26%; Pfizer Inc (PFE) up 2.91%.
What is driving Merck & Co Inc (MRK)’s stock price up today?
Merck & Co. demonstrated positive performance during the session, accompanied by heightened intraday volatility as market participants reacted to major clinical pipeline developments and strategic facility expansions. The upward trajectory reflects renewed investor confidence in the company's long-term oncology strategy, outstripping ongoing discussions around near-term quarterly financial metrics and patent timelines.
A primary driver of today's positive momentum was Merck's announcement regarding its presentations at the European Society for Medical Oncology Congress 2026. The company revealed that it will present first-time pivotal Phase 3 trial results during three late-breaking Presidential Symposia. Featured studies include data on intismeran, an mRNA-based individualized neoantigen therapy evaluated in combination with Keytruda, alongside results for sac-TMT across advanced cancer indications. Institutional investors view these disclosures as critical evidence of pipeline diversification, helping alleviate concerns over Keytruda's eventual loss of exclusivity.
Compounding the positive sentiment, Merck officially opened a new five-hundred-million-dollar bioanalytical research facility at its West Point campus. The state-of-the-art facility is designed to accelerate drug discovery through advanced robotics and automated bioanalytical technology, reinforcing the firm's core R&D infrastructure. This operational milestone, coupled with recent price target revisions from sell-side firms including Citigroup, generated solid buying interest across institutional channels.
Looking ahead, market participants are positioning ahead of Merck's third-quarter earnings release scheduled for October 29. While near-term earnings expectations remain focused on Keytruda sales momentum and commercial execution, the market's focus has increasingly pivoted toward late-stage clinical progress and commercial pipeline readiness. Investors will continue to monitor incoming clinical data from the ESMO presentations to gauge the risk-adjusted growth trajectory of Merck's expanding therapeutic portfolio.
Technical Analysis of Merck & Co Inc (MRK)
Technically, Merck & Co Inc (MRK) shows a MACD (12,26,9) value of -0.459, indicating a neutral signal. The RSI at 54.839 suggests neutral condition and the Williams %R at 26.600 suggests buy condition. Please monitor closely.
Fundamental Analysis of Merck & Co Inc (MRK)
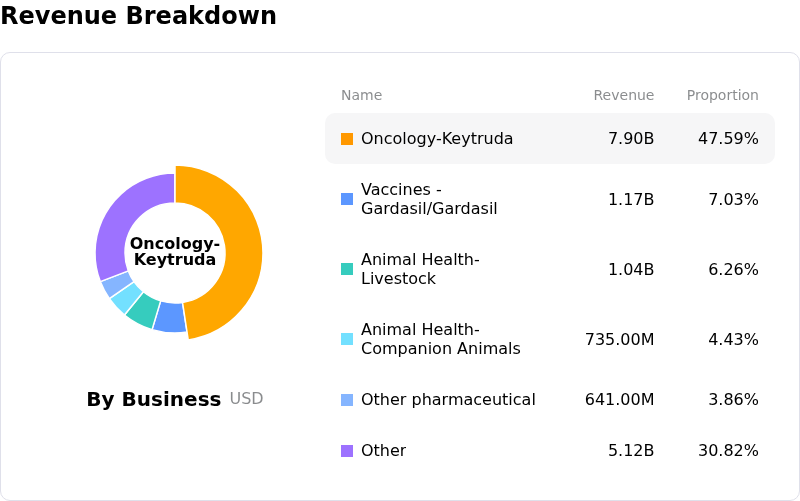
Merck & Co Inc (MRK) is in the Pharmaceuticals & Medical Research industry. Its latest annual revenue is $65.01B, ranking 5 in the industry. The net profit is $18.25B, ranking 3 in the industry. Company Profile
Over the past month, multiple analysts have rated the company as Buy, with an average price target of $154.85, a high of $186.00, and a low of $105.00.
More details about Merck & Co Inc (MRK)
Company Specific Risks:
- Keytruda Exclusivity Cliff and Concentration Exposure: Keytruda accounts for over 50% of total pharmaceutical revenues, creating severe product concentration risk as institutional analysts highlight the approaching 2028 patent expiration and question whether current valuation multiples can withstand impending biosimilar competition.
- Gardasil Franchise Softness in Key Asian Markets: Persistent weakness and demand drag in China—which has historically generated nearly half of global Gardasil sales—continue to pressure non-oncology revenues and undermine management's long-term vaccine growth targets.
- Near-Term Earnings Compression and Consensus Downgrades: Ahead of the upcoming Q3 earnings report, Wall Street consensus estimates for fiscal 2026 EPS have been revised downward, with analysts forecasting a 17.8% year-over-year drop in Q3 EPS driven by acquisition-related GAAP charges and elevated R&D spending.
- Technical Overvaluation and Insider Selling Pressure: Recent momentum indicators turning negative, combined with insider selling activity and trading well above historical mean earnings multiples, have triggered institutional profit-taking and heightened intraday price volatility.
Recommended Articles


