

XRP (XRPUSD) Suddenly Goes up 1.18% on Oct 9: What You Need to Watch

Source Tradingkey

XRP (XRPUSD) is up 1.18% at Oct 9 21:45(ET), now at $1.3941, with a 7-day down of 5.29%.
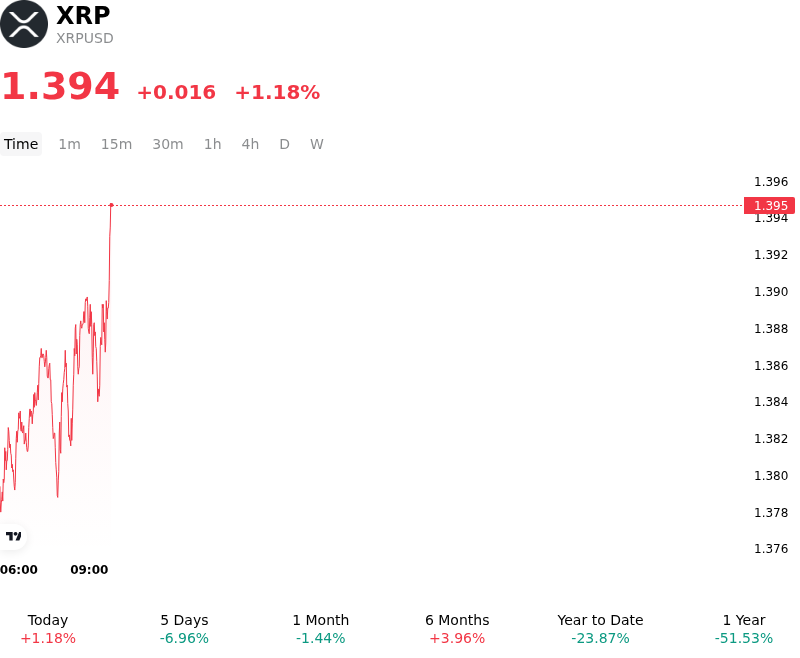
SummaryOverview

What is driving XRP (XRPUSD)’s stock price up today?

Capital inflows into XRP reflected sustained institutional demand driven by spot exchange-traded fund activity and persistent exchange supply absorption. Cumulative net inflows into spot XRP investment vehicles have provided a structural bid, steadily removing circulating tokens from secondary spot markets. Concurrently, on-chain metrics show significant exchange net outflows across major trading venues, resulting in a marked decline in centralized exchange reserves. This tightening of immediate liquid market supply, coupled with steady accumulation by large-tier wallet addresses, has reduced selling pressure and enhanced market depth.

Institutional sentiment was further bolstered by expanding corporate treasury initiatives and enterprise-grade prime brokerage developments. The emergence of publicly traded entities establishing dedicated XRP treasuries, alongside expanded institutional clearing and prime brokerage partnerships with major global alternative asset managers, reinforced long-term adoption expectations. These institutional-grade access points and infrastructure enhancements offer capital-efficient avenues for corporate and institutional participation, strengthening the asset's structural demand framework.

From a market structure perspective, derivatives positioning has remained disciplined. Open interest across major leverage venues is operating at moderate levels compared to historical peaks, reducing the immediate probability of severe long liquidation cascades. As global macro sentiment navigates shifting central bank policy expectations and interest rate trajectories, capital has selectively rotated into large-cap digital assets backed by spot investment access and clear corporate utility. The convergence of declining exchange inventory, steady institutional fund flows, and expanding infrastructure provided the primary momentum behind the asset's upward trajectory.

Technical Analysis of XRP (XRPUSD)

Technically, XRP (XRPUSD) shows a MACD (12,26,9) value of -0.039, indicating a neutral signal. The RSI at 43.602 suggests neutral condition and the Williams %R at 71.603 suggests sell condition. Please monitor closely.
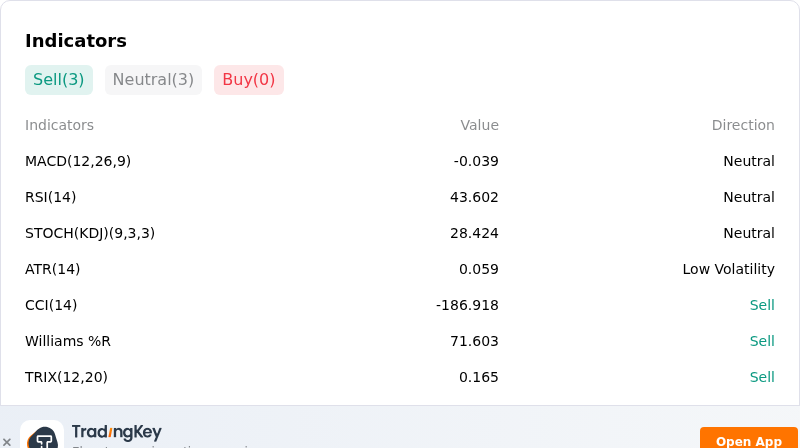
IndicatorAnalysis

More details about XRP (XRPUSD)

Recent Events and Risks:

  • Leveraged Long Liquidation Cascades: Over $14 million in long XRP futures positions were forcibly liquidated as price action broke key technical support near $1.44, triggering a derivative market deleveraging event that drove open interest down by over 15% and accelerated intraday selling pressure.
  • Whale Outflows and Exchange Supply Risks: On-chain analytics indicate 30-day whale outflows from Binance reached a seven-month high of 1.38 billion XRP, alongside a contracting exchange whale-to-retail dominance spread to 46.7%, raising concerns of potential asset redistribution and concentrated sell-side liquidity across centralized venues.
  • Decelerating ETF Inflows and Catalyst Delays: Institutional demand via spot XRP fund flows slowed sharply to under $5 million down from previous highs of $75 million, while the anticipated Nasdaq listing of Evernorth—a major XRP treasury holding entity—faced an administrative delay, removing immediate structural buying tailwinds.
  • Macro Risk-Off and Rising Yield Pressures: A surge in long-duration U.S. Treasury yields near multi-decade highs and escalating global macroeconomic stress have induced broad risk asset de-risking, weighing heavily on digital asset market liquidity and driving tactical capital away from XRP.
Disclaimer: For information purposes only. Past performance is not indicative of future results.
placeholder
Gold holds steady below $4,150 amid elevated US yields Gold price (XAU/USD) trades on a flat note near $4,140 during the early Asian session on Tuesday. Pressure from a stronger US Dollar (USD) and elevated US Treasury yields was offset by reduced expectations of a Federal Reserve (Fed) rate hike this month.
Author  FXStreet
Oct 06, Tue
Gold price (XAU/USD) trades on a flat note near $4,140 during the early Asian session on Tuesday. Pressure from a stronger US Dollar (USD) and elevated US Treasury yields was offset by reduced expectations of a Federal Reserve (Fed) rate hike this month.
placeholder
WTI rises to near $89.50 as Middle East supply threats offset Persian Gulf recoveryWest Texas Intermediate (WTI) oil price extends its gains for the second successive day, trading around $89.50 per barrel during the Asian hours on Wednesday. Crude oil climbed as persistent risks to Middle East energy flows overshadowed signs of rising supply from the region.
Author  FXStreet
Oct 07, Wed
West Texas Intermediate (WTI) oil price extends its gains for the second successive day, trading around $89.50 per barrel during the Asian hours on Wednesday. Crude oil climbed as persistent risks to Middle East energy flows overshadowed signs of rising supply from the region.
placeholder
【Daily Brief】Gold rebounds 1% off a two-month low, Nasdaq drops 1.25% and yields ease — the storm premium keeps WTI near $91Gold trades at $4,174 after rebounding from Wednesday's $4,090 two-month low, the Nasdaq fell 1.25% while the Dow edged higher, and the 10-year Treasury eased to 5.23% from the week's highs. Hurricane Isaias keeps about 25% of Gulf output shut in with WTI near $91, and bitcoin holds below $82,000. The next scheduled tests are the EIA report on 15 October and the FOMC on 27-28 October.
Author  Irene Q.
Yesterday 06: 28
Gold trades at $4,174 after rebounding from Wednesday's $4,090 two-month low, the Nasdaq fell 1.25% while the Dow edged higher, and the 10-year Treasury eased to 5.23% from the week's highs. Hurricane Isaias keeps about 25% of Gulf output shut in with WTI near $91, and bitcoin holds below $82,000. The next scheduled tests are the EIA report on 15 October and the FOMC on 27-28 October.
placeholder
Hurricane Isaias has shut in a quarter of Gulf oil output — can WTI clear $92 before Thursday's EIA report?WTI trades at $90.80 after rebounding roughly 3% from Wednesday's $87.96 low as Hurricane Isaias — the Atlantic season's first — forces producers to shut in about 25% of US Gulf of Mexico output. Brent holds at $103.41. The first official read on the disruption arrives with the EIA weekly petroleum report on Thursday 15 October — here are the key levels and both scenarios.
Author  Irene Q.
Yesterday 06: 38
WTI trades at $90.80 after rebounding roughly 3% from Wednesday's $87.96 low as Hurricane Isaias — the Atlantic season's first — forces producers to shut in about 25% of US Gulf of Mexico output. Brent holds at $103.41. The first official read on the disruption arrives with the EIA weekly petroleum report on Thursday 15 October — here are the key levels and both scenarios.
placeholder
US September CPI preview: inflation set to hit 3.7% — will the Fed hike in December?US September CPI lands Wednesday with headline inflation seen at 3.7% y/y and core at 0.2% m/m. December hike odds sit near 70% — here are the scenarios, the calendar and the key levels.
Author  Irene Q.
3 hours ago
US September CPI lands Wednesday with headline inflation seen at 3.7% y/y and core at 0.2% m/m. December hike odds sit near 70% — here are the scenarios, the calendar and the key levels.
goTop
quote