


Interactive Brokers Group Inc Stock (IBKR) Moved Down by 4.78% on Oct 7: Facts Behind the Movement
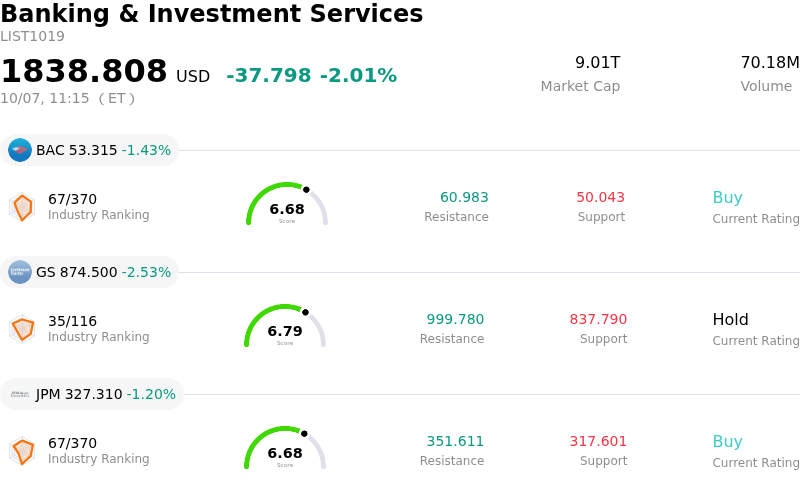
Interactive Brokers Group Inc (IBKR) moved down by 4.78%. The Banking & Investment Services sector is down by 2.01%. The company underperformed the industry. Top 3 stocks by turnover in the sector: Bank of America Corp (BAC) down 1.45%; Goldman Sachs Group Inc (GS) down 2.53%; JPMorgan Chase & Co (JPM) down 1.20%.
What is driving Interactive Brokers Group Inc (IBKR)’s stock price down today?
Interactive Brokers experienced downward momentum today due to a combination of sequential operational friction, analyst price target adjustments, and valuation sensitivity ahead of its upcoming quarterly earnings report. While the company's recently disclosed monthly brokerage metrics for September demonstrated robust year-over-year expansion in total client accounts and client equity, daily average revenue trades registered a month-over-month decline. This modest cooling in active trading engagement sparked short-term momentum friction among investors who had priced in continuous execution expansion.
Adding to the selling pressure, recent institutional research adjustments included a price target trim from BMO Capital Markets, which highlighted tighter valuation buffers despite maintaining a long-term positive stance. With the stock trading at a premium price-to-earnings multiple relative to historical averages, market participants have become increasingly sensitive to operational softness or potential revenue drag from macroeconomic shifts. In particular, expectations surrounding Federal Reserve monetary policy and potential interest rate cuts continue to pose a headwind for net interest income, a vital driver of overall profitability.
With third-quarter earnings scheduled for release in mid-October, institutional portfolio managers appear to be locking in profits and rebalancing exposure. Given the stock's strong overall trajectory, traders are exercising caution until there is greater clarity on commission yields, net interest margin resilience, and trading volume trends entering the final quarter of the year. Overall, today's retreat reflects tactical positioning and valuation recalibration rather than a structural departure from the firm's core low-cost, technology-driven brokerage model.
Technical Analysis of Interactive Brokers Group Inc (IBKR)
Technically, Interactive Brokers Group Inc (IBKR) shows a MACD (12,26,9) value of -0.113, indicating a sell signal. The RSI at 42.842 suggests neutral condition and the Williams %R at 73.972 suggests sell condition. Please monitor closely.
Media Coverage of Interactive Brokers Group Inc (IBKR)
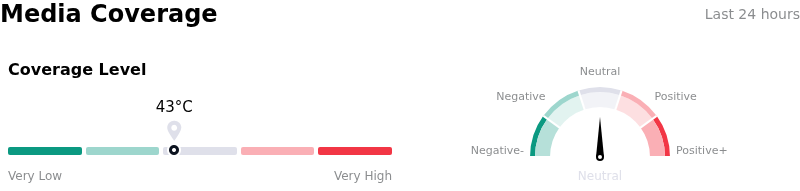
In terms of media coverage, Interactive Brokers Group Inc (IBKR) shows a coverage score of 43, indicating a moderate level of media attention. The overall market sentiment index is currently in neutral zone.
Fundamental Analysis of Interactive Brokers Group Inc (IBKR)
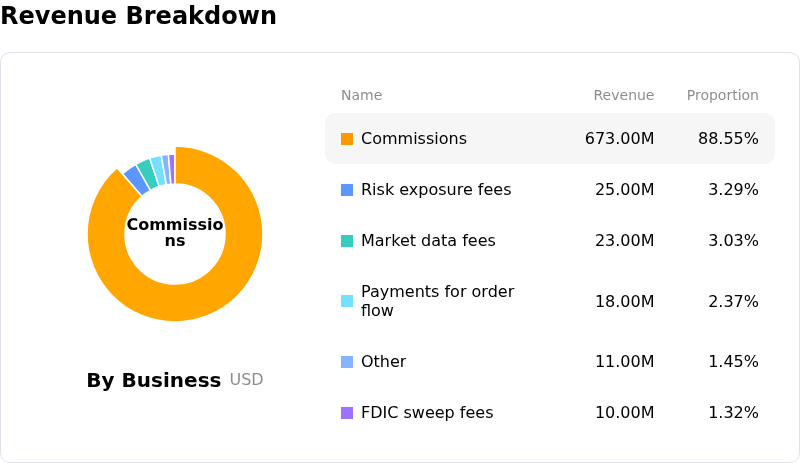
Interactive Brokers Group Inc (IBKR) is in the Banking & Investment Services industry. Its latest annual revenue is $10.00B, ranking 24 in the industry. The net profit is $984.00M, ranking 24 in the industry. Company Profile
Over the past month, multiple analysts have rated the company as Buy, with an average price target of $105.84, a high of $121.00, and a low of $72.18.
More details about Interactive Brokers Group Inc (IBKR)
Company Specific Risks:
- Analyst Target Price Cuts and Premium Valuation Risk: Wall Street analysts, including BMO Capital, recently lowered their price targets on Interactive Brokers ahead of its upcoming Q3 earnings report. Trading at a forward P/E ratio exceeding 32x—a elevated premium relative to the broader capital markets sector average—leaves the stock exposed to severe intraday price pullbacks if upcoming financial metrics or growth guidance miss consensus estimates.
- Sequential Decline in Monthly Daily Average Revenue Trades (DARTs): The company’s September performance metrics report showed that Daily Average Revenue Trades (DARTs) fell 4% month-over-month to 4.111 million, while ending client equity plateaued near $964.7 billion, signaling a near-term deceleration in user trading activity and platform engagement.
- Net Interest Income Vulnerability to Central Bank Rate Easing: Interactive Brokers relies heavily on net interest income generated across its $186.2 billion in client credit balances and $105.2 billion in margin loans. Expected monetary policy easing and Federal Reserve rate cuts pose a structural headwind to interest margins, directly threatening its highest-margin revenue engine.
- Supply Overhang from Shelf Registration Filings: Market sentiment continues to digest ongoing equity issuance mechanics stemming from the company's Form S-3 shelf registration and related prospectus supplements, creating structural overhang that magnifies intraday selling pressure during broader financial sector downturns.
Recommended Articles


