

Ethereum (ETHUSD) Is down 3.13% on Oct 7: Key Drivers to Watch

Source Tradingkey

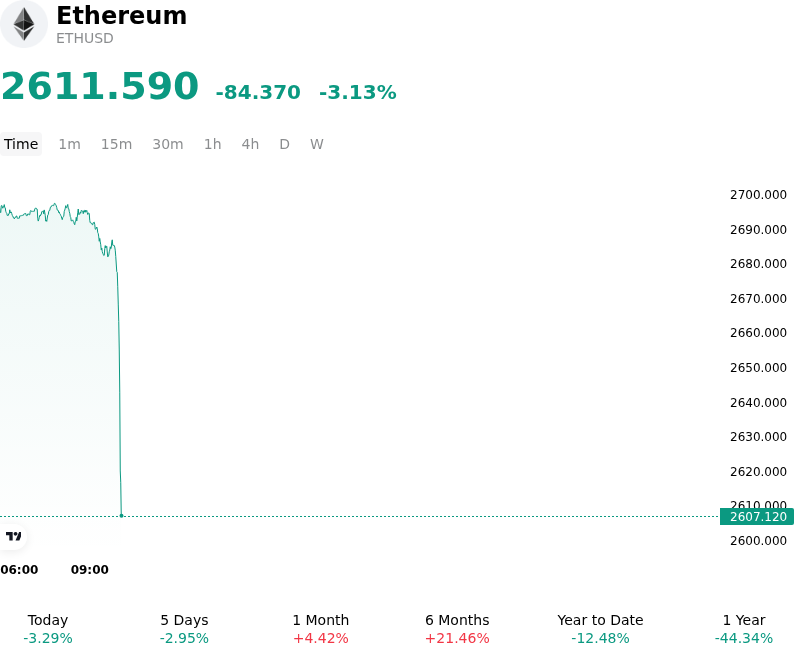
Ethereum (ETHUSD) is down 3.13% at Oct 7 22:05(ET), now at $2611.59, with a 7-day down of 2.55%.
SummaryOverview

What is driving Ethereum (ETHUSD)’s stock price down today?

Ethereum experienced selling pressure driven primarily by sustained institutional capital outflows and net redemptions across U.S. spot Ethereum exchange-traded funds. Persistent daily withdrawals from these spot vehicles removed critical institutional buying support, creating a localized supply overhang in spot markets as institutional desks reduced risk exposure following a period of strong quarterly performance. This sustained reduction in fund exposure signaled softening institutional demand among market participants, constraining spot liquidity and prompting broader profit-taking across spot execution venues.

Macroeconomic conditions further exacerbated the downside, as firming U.S. Treasury yields and shifting Federal Reserve interest rate expectations tightened broader risk sentiment. A recalibration in global macro expectations pressured high-beta digital assets, driving institutional investors to reduce risk exposure. The combination of elevated yields and tightening capital conditions constrained capital flows into non-yielding crypto assets, dampening dip-buying demand across institutional trading desks.

Market structure dynamics within crypto derivatives venues magnified the intraday weakness. As Ethereum encountered overhead chart resistance, sell-side urgency escalated across major perpetual futures exchanges. Negative net taker volume triggered long liquidation sweeps, forcing leveraged traders to unwind positions and amplifying downward price volatility. While ongoing network milestones—including testnet deployments ahead of upcoming consensus and execution layer upgrades—continue to support Ethereum's long-term structural adoption narrative, near-term price dynamics remain anchored by spot ETF flow trends, macroeconomic liquidity conditions, and derivatives de-risking.

Technical Analysis of Ethereum (ETHUSD)

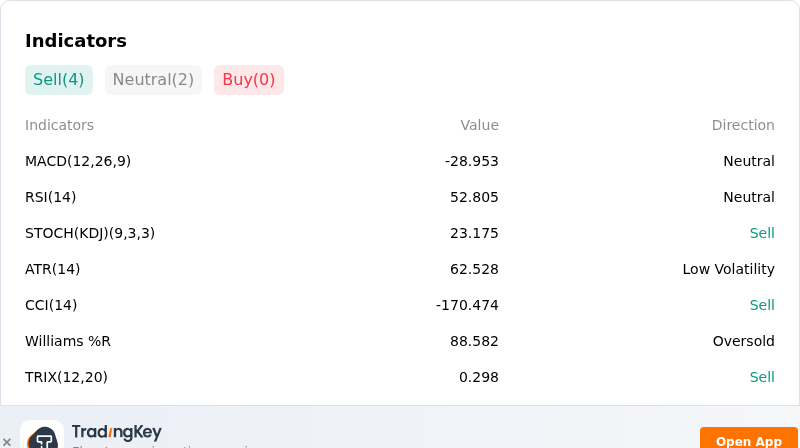
Technically, Ethereum (ETHUSD) shows a MACD (12,26,9) value of -24.606, indicating a neutral signal. The RSI at 57.310 suggests neutral condition and the Williams %R at 65.706 suggests sell condition. Please monitor closely.
IndicatorAnalysis

More details about Ethereum (ETHUSD)

Recent Events and Risks:

  • Institutional Spot ETF Capital Outflows: U.S. spot Ethereum ETFs have recorded multi-session daily net redemptions across major funds, including BlackRock's ETHA and Fidelity's FETH, removing a key source of spot buying support and creating a persistent supply overhang.
  • Derivatives Leverage and Liquidation Cascade Risk: Accumulated long exposure in perpetual futures markets presents localized price vulnerability, with high open interest concentrations facing hundreds of millions of dollars in potential long liquidations below key technical support levels.
  • Whale Wallet Distribution to Exchanges: On-chain tracking highlighted dormant ICO-era whale wallets moving thousands of ETH to centralized exchange deposit addresses, raising market concerns over impending sell-side pressure and spot distribution.
  • Macro Risk-Off Drivers and Yield Pressures: Persistent U.S. dollar strength and elevated Treasury yields have heightened risk aversion across broader financial markets, increasing the opportunity cost of holding non-yielding digital assets and thinning order book depth.
Disclaimer: For information purposes only. Past performance is not indicative of future results.
placeholder
Bitcoin Drops Below $83,000 as US Government Transfers Over 10,000 BTC, Sparking Panic Over Potential Selling PressureUS government transfers over 10,000 BTC as Bitcoin extends losses to breach $83,000, but a further sharp decline remains unlikely.On October 8, Bitcoin (BTC) extended its recent losses, f
Author  TradingKey
13 hours ago
US government transfers over 10,000 BTC as Bitcoin extends losses to breach $83,000, but a further sharp decline remains unlikely.On October 8, Bitcoin (BTC) extended its recent losses, f
placeholder
Gold falls to a two-month low as real yields bite — can $4,000 hold?Gold hit a two-month low on 7 October, with spot touching roughly $4,090 and COMEX December futures closing at $4,140.70, even as the New York Fed's one-year inflation expectation rose to 3.9% — its highest since May 2023. The paradox resolves through real yields: the 30-year Treasury yield reached 5.732% intraday, its highest since 2002. Here are the levels, the institutional split, and the scenarios into tonight's jobless claims and 30-year auction.
Author  Irene Q.
13 hours ago
Gold hit a two-month low on 7 October, with spot touching roughly $4,090 and COMEX December futures closing at $4,140.70, even as the New York Fed's one-year inflation expectation rose to 3.9% — its highest since May 2023. The paradox resolves through real yields: the 30-year Treasury yield reached 5.732% intraday, its highest since 2002. Here are the levels, the institutional split, and the scenarios into tonight's jobless claims and 30-year auction.
placeholder
Gold Price Forecast: Gold Drops Below $4,100, Could Test $4,000 in Short TermAs of the Asian session on October 8, gold prices (XAUUSD) maintained a weak rebound trend today, with the latest price trading around $4,120; yesterday, gold prices briefly fell below $4
Author  TradingKey
13 hours ago
As of the Asian session on October 8, gold prices (XAUUSD) maintained a weak rebound trend today, with the latest price trading around $4,120; yesterday, gold prices briefly fell below $4
placeholder
Euro slides to a 17-month low as France's budget crisis spreads — can 1.12 hold?EUR/USD touched 1.1162 on 5 October, its weakest level in 17 months, as France's budget standoff pushed the 10-year OAT above 5% and the OAT-Bund spread to roughly 160bp — the widest since the 2011-12 eurozone debt crisis. The euro now trades near 1.1215 ahead of US jobless claims and a $22 billion 30-year Treasury auction. Here are the levels and the two scenarios to watch.
Author  Irene Q.
14 hours ago
EUR/USD touched 1.1162 on 5 October, its weakest level in 17 months, as France's budget standoff pushed the 10-year OAT above 5% and the OAT-Bund spread to roughly 160bp — the widest since the 2011-12 eurozone debt crisis. The euro now trades near 1.1215 ahead of US jobless claims and a $22 billion 30-year Treasury auction. Here are the levels and the two scenarios to watch.
placeholder
Today’s Market Recap: 10-Year Treasury Yield Hits Highest Since 2002,U.S. Stocks Fall as Brent Barely Holds $100Tracking the Market TrendTradingKey - On October 7, U.S. Eastern Time, the 10-year Treasury yield climbed to an intraday high of 5.36%, its highest level since 2002, while all three major U.S. stock i
Author  TradingKey
20 hours ago
Tracking the Market TrendTradingKey - On October 7, U.S. Eastern Time, the 10-year Treasury yield climbed to an intraday high of 5.36%, its highest level since 2002, while all three major U.S. stock i
goTop
quote