

Solana (SOLUSD) Is down 1.04% on Sep 29: What Are the Risk Factors?

Source Tradingkey

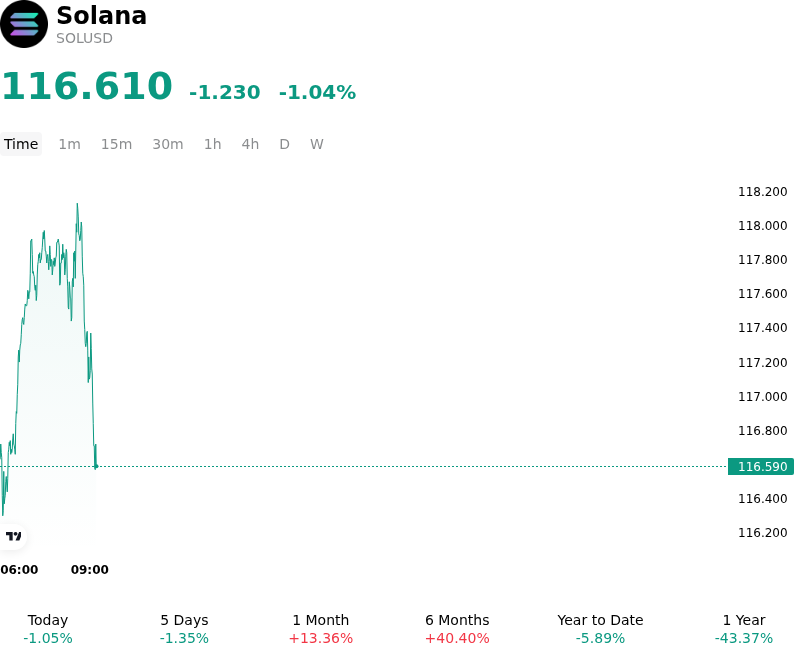
Solana (SOLUSD) is down 1.04% at Sep 29 21:15(ET), now at $116.61, with a 7-day down of 0.32%.
SummaryOverview

What is driving Solana (SOLUSD)’s stock price down today?

Solana experienced a moderate price retrenchment as short-term speculative momentum cooled following the clarification of timeline expectations surrounding its consensus protocol upgrade, Alpenglow. Anticipation had built around a potential late-September mainnet activation for the performance-enhancing upgrade; however, statements from core development firm Anza and protocol leadership confirmed that the deployment remains confined to the testnet environment without a finalized mainnet date. The unwinding of event-driven long positions triggered a mild sell-the-fact response, prompting profit-taking following Solana's substantial multi-week expansion from late-summer lows.

The tactical pullback in SOL was further reinforced by a broader risk-off posture across macro and digital asset markets. Persistent upward pressure on U.S. Treasury yields, driven by strong economic activity indicators and elevated inflation expectations, continued to tighten global financial conditions. Rising real yields and persistent geopolitical friction in the Middle East supported the U.S. dollar while curbing general risk appetite for high-beta digital assets. With market participants adjusting Federal Reserve rate expectations, broader crypto liquidity experienced brief headwinds, capping immediate upside across major altcoins.

Despite short-term price consolidation, fundamental capital flows and institutional interest suggest the movement reflects a temporary pause within a broader structural recovery rather than a trend reversal. Institutional involvement in spot Solana investment vehicles remains resilient, supported by steady weekly ETF inflows and continued allocation from prominent asset managers. Furthermore, network activity continues to be underpinned by expanding enterprise integration, notably within tokenized equity settlement and real-world asset protocols. Institutional investors continue to monitor broader macroeconomic conditions, derivative leverage metrics, and testnet stability as key indicators for the timing of Solana's next sustained expansionary phase.

Technical Analysis of Solana (SOLUSD)

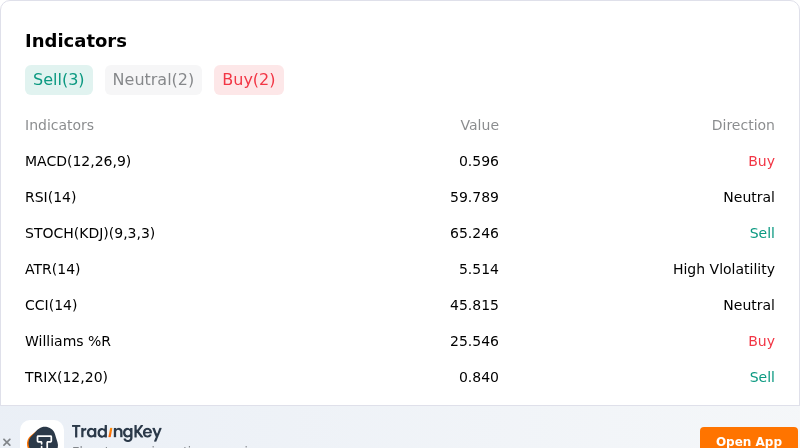
Technically, Solana (SOLUSD) shows a MACD (12,26,9) value of 0.596, indicating a buy signal. The RSI at 59.789 suggests neutral condition and the Williams %R at 25.546 suggests buy condition. Please monitor closely.
IndicatorAnalysis

More details about Solana (SOLUSD)

Recent Events and Risks:

  • Derivatives Open Interest and Over-Leveraged Positioning: Solana's futures open interest has climbed to approximately $7.5 billion near local highs, leaving the market highly vulnerable to forced liquidation cascades and intraday downside volatility if bullish momentum slows.
  • Whale Transfers and Centralized Exchange Inflows: On-chain tracking recently identified a major wallet transferring 500,000 SOL (valued at roughly $60.5 million) directly to Binance, creating immediate overhead sell-side risk and profit-taking pressure.
  • Stalled Governance Priority Upgrades and Volume Quality Concerns: The closure of transaction priority proposal SIMD-0649 without adoption leaves transaction inclusion discretion with validators, while recent on-chain reports flagging elevated bot-driven circular DEX trading raise execution and market quality concerns.
  • Technical Overextension and Mean-Reversion Risk: SOL is trading nearly 29% above its 200-day exponential moving average with daily momentum indicators reaching near-overbought territory, heightening the likelihood of a sharp corrective pullback toward underlying support zones near $119.90 or $115.
Disclaimer: For information purposes only. Past performance is not indicative of future results.
placeholder
Gold ends three-week slide at the $4,400 line — eight straight days of ETF inflows vs a 5% 10-year and a 100 dollarSpot gold closed Friday at $4,378.39, up 0.84% on the day and about 0.8% for the week — its first weekly gain in four weeks — with the intraday high of $4,399.67 leaving it 33 cents shy of the $4,400 line. Gold ETFs have now logged eight straight sessions of inflows, but with the 10-year back above 5% and the dollar index near 100, here is what decides whether this is a reversal or a bounce.
Author  Suzie
Sep 20, Sun
Spot gold closed Friday at $4,378.39, up 0.84% on the day and about 0.8% for the week — its first weekly gain in four weeks — with the intraday high of $4,399.67 leaving it 33 cents shy of the $4,400 line. Gold ETFs have now logged eight straight sessions of inflows, but with the 10-year back above 5% and the dollar index near 100, here is what decides whether this is a reversal or a bounce.
placeholder
October hike odds climb toward 60% as Goldman and BofA both flip — what Warsh's "dose of accommodation" really changedRate futures now price roughly 55% to 62% for a 25bp hike at the October 27-28 FOMC, up from about 30% before Chair Warsh's post-meeting framing that the Fed is merely "removing some accommodation." Goldman Sachs has added an October hike to its forecast and Bank of America now sees moves in both October and December. Here is the repricing, the language behind it, and the two data points that decide it.
Author  Irene Q.
Sep 23, Wed
Rate futures now price roughly 55% to 62% for a 25bp hike at the October 27-28 FOMC, up from about 30% before Chair Warsh's post-meeting framing that the Fed is merely "removing some accommodation." Goldman Sachs has added an October hike to its forecast and Bank of America now sees moves in both October and December. Here is the repricing, the language behind it, and the two data points that decide it.
placeholder
US input costs rose at the fastest pace in four years — the September flash PMI beat is an inflation story, not a growth storyUS September flash PMIs came in far above expectations, with the composite at 58.4, a five-year high. But the detail that moved markets was input cost inflation at its fastest since October 2022, driven by fuel, transport and supply shortages. Brent is back above $100 and the 10-year Treasury yield has hit its highest since 2007.
Author  Suzie
Sep 24, Thu
US September flash PMIs came in far above expectations, with the composite at 58.4, a five-year high. But the detail that moved markets was input cost inflation at its fastest since October 2022, driven by fuel, transport and supply shortages. Brent is back above $100 and the 10-year Treasury yield has hit its highest since 2007.
placeholder
Brent edges toward $99 as Trump rejects Iran's Hormuz proposal — why the war-risk premium won't rebuildBrent crude rose 0.92% to $98.51 and WTI gained 1.15% to $93.51 after President Trump rejected Iran's seven-day proposal to reopen the Strait of Hormuz. But both benchmarks remain about 12% below their early-September highs, because supply never actually stopped. Hormuz flows ran at 33.7 million barrels this week, in line with the prior week, and Saudi Arabia's East-West pipeline restarted on September 22.
Author  Suzie
20 hours ago
Brent crude rose 0.92% to $98.51 and WTI gained 1.15% to $93.51 after President Trump rejected Iran's seven-day proposal to reopen the Strait of Hormuz. But both benchmarks remain about 12% below their early-September highs, because supply never actually stopped. Hormuz flows ran at 33.7 million barrels this week, in line with the prior week, and Saudi Arabia's East-West pipeline restarted on September 22.
placeholder
Four jobs reports in five days: what JOLTS, ADP, claims and the September payrolls mean for the October Fed decisionThe US labour market faces its densest data week of the month. JOLTS job openings land Tuesday (7.2 million expected), ADP on Wednesday (70,000 expected), initial claims on Thursday and the September non-farm payrolls on Friday (100,000 expected, down from 162,000). Markets price a 64%-70% chance of another quarter-point Fed hike on October 28. The dollar index sits at 100.77 and the S&P 500 at 7,729.8.
Author  Mitrade
19 hours ago
The US labour market faces its densest data week of the month. JOLTS job openings land Tuesday (7.2 million expected), ADP on Wednesday (70,000 expected), initial claims on Thursday and the September non-farm payrolls on Friday (100,000 expected, down from 162,000). Markets price a 64%-70% chance of another quarter-point Fed hike on October 28. The dollar index sits at 100.77 and the S&P 500 at 7,729.8.
goTop
quote