


10X Genomics Inc Stock (TXG) Moved Up by 7.42% on Sep 24: What Signal Does It Send?
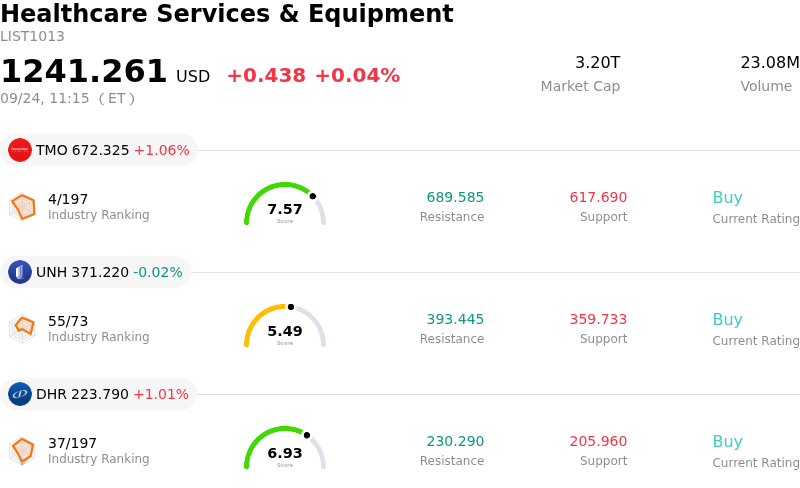
10X Genomics Inc (TXG) moved up by 7.42%. The Healthcare Services & Equipment sector is up by 0.04%. The company outperformed the industry. Top 3 stocks by turnover in the sector: Thermo Fisher Scientific Inc (TMO) up 1.05%; Unitedhealth Group Inc (UNH) down 0.02%; Danaher Corp (DHR) up 1.01%.
What is driving 10X Genomics Inc (TXG)’s stock price up today?
The upward movement in 10x Genomics stock reflects strong momentum and renewed buying interest following recent intraday volatility. Technical indicators, including positive moving average convergence divergence shifts and bullish trend signals, have catalyzed buying among momentum-driven market participants. The stock's capacity to rebound sharply demonstrates sustained institutional interest as traders capitalize on favorable technical setups and ongoing short-covering activity.
Fundamental catalysts are playing a central role in driving investor optimism surrounding the company's long-term commercial trajectory. Markets have responded favorably to enthusiasm and order momentum for the Atera spatial biology platform, which delivers whole-transcriptome spatial analysis at single-cell resolution. Sentiment has been further bolstered by strategic collaborations, including the integration of Lunit's AI pathology capabilities into the Xenium and Atera workflows, reinforcing the firm's position in oncology research and biomarker discovery.
Intellectual property litigation victories against industry peers have provided additional clarity and market confidence by protecting key technology assets. Although macro pressures on academic and biopharma research budgets continue to present potential sector-wide headwinds, the convergence of product innovation, strategic AI integrations, and expanding spatial biology adoption continues to draw capital toward the company as a key growth player in life science tools.
Technical Analysis of 10X Genomics Inc (TXG)
Technically, 10X Genomics Inc (TXG) shows a MACD (12,26,9) value of 1.227, indicating a buy signal. The RSI at 70.496 suggests buy condition and the Williams %R at 6.201 suggests overbought condition. Please monitor closely.
Fundamental Analysis of 10X Genomics Inc (TXG)
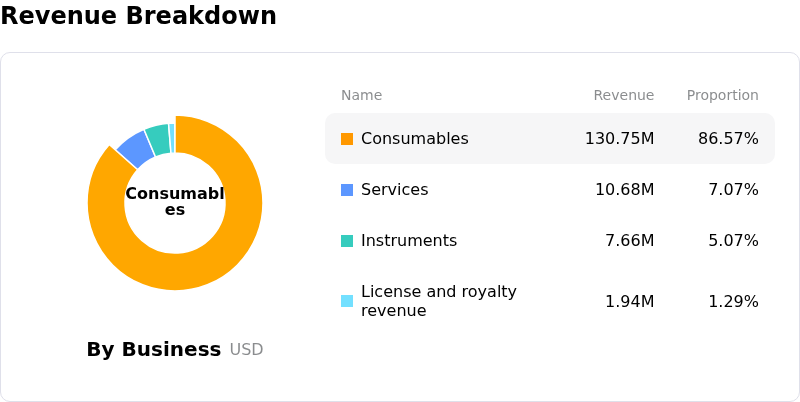
10X Genomics Inc (TXG) is in the Healthcare Services & Equipment industry. Its latest annual revenue is $642.82M, ranking 78 in the industry. The net profit is $-43.54M, ranking 181 in the industry. Company Profile
Over the past month, multiple analysts have rated the company as Buy, with an average price target of $57.07, a high of $90.00, and a low of $40.00.
More details about 10X Genomics Inc (TXG)
Company Specific Risks:
- Extreme Valuation Disconnect and Price Target Downside: Following a sharp multi-fold rally to a 52-week high of $82.68, TXG suffered a steep intraday pullback as market commentary highlighted an extreme price-to-sales multiple of over 16x, leaving the stock heavily overvalued relative to the consensus analyst price target of $44.00 and modeled fair value estimates of $49.54.
- Persistent Operational Losses and Top-Line Contraction: Recent financial reporting underscores structural profitability challenges, evidenced by a Q2 2026 operating loss of $19.6 million and net loss of $17.9 million alongside a year-over-year total revenue decline to $151.0 million, as lower instrument pricing continues to pressure gross margins.
- Insider Dispositions and Heavy Distribution Pressure: Regulatory Form 4 and Rule 144 filings disclose sustained insider selling, including multi-million-dollar sales by Chief Financial Officer Adam Taich and over $9.3 million in aggregate insider stock liquidations in recent months, dampening institutional sentiment during intraday rallies.
- High Short Interest and Technical Overbought Reversal: Short interest has climbed to 13.61% of the total float with 5.51 days to cover, combining with extreme overbought momentum indicators (RSI reaching 78) to trigger technical sell signals and amplify downside intraday price swings.
Recommended Articles


