


TD Synnex Corp Stock (SNX) Moved Down by 11.88% on Sep 24: Drivers Behind the Movement
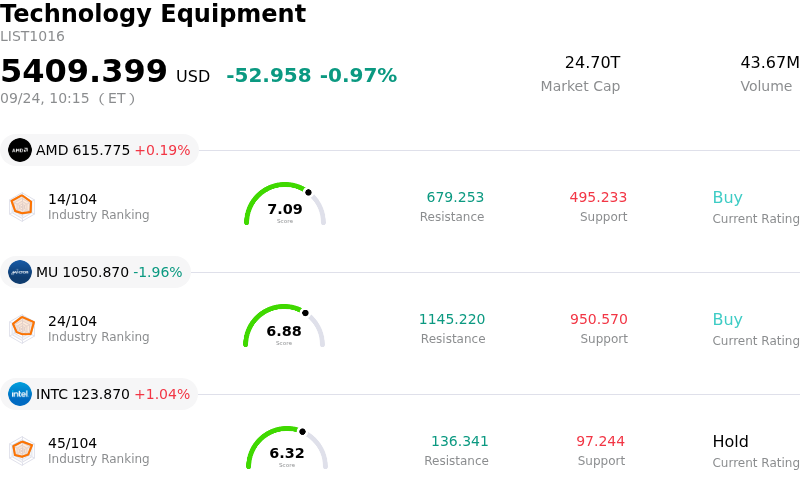
TD Synnex Corp (SNX) moved down by 11.88%. The Technology Equipment sector is down by 0.97%. The company underperformed the industry. Top 3 stocks by turnover in the sector: Advanced Micro Devices Inc (AMD) up 0.01%; Micron Technology Inc (MU) down 1.98%; Intel Corp (INTC) up 1.01%.
What is driving TD Synnex Corp (SNX)’s stock price down today?
TD SYNNEX experienced a sharp pullback following the release of its fiscal third-quarter financial results, despite delivering headline top-line revenue and adjusted earnings per share that comfortably surpassed Wall Street estimates and issuing solid forward guidance. The company benefited from robust enterprise artificial intelligence adoption, data center modernization, and strong volume growth across its Distribution and Hyve Solutions divisions. However, market participants looked beyond the headline beats, focusing instead on underlying operational friction and cash flow metrics that dampened institutional sentiment.
The primary factor driving the negative market reaction was severe cash flow deterioration and gross margin contraction. Accelerating demand for hyperscale AI server deployments and hardware fulfillment required massive upfront working capital investments, driving inventory levels significantly higher. Consequently, free cash flow turned sharply negative for the quarter. At the same time, gross margin compressed year-over-year due to a product mix shift toward high-volume, lower-margin server fulfillment projects and changes in revenue recognition for software and service arrangements. Investors grew concerned that fulfilling capital-intensive AI infrastructure orders is straining liquidity and eroding profitability in the short term.
The post-earnings decline was further amplified by market positioning and valuation dynamics. Heading into the quarterly report, the stock had rallied strongly toward multi-year highs, creating elevated market expectations. Once the financial results revealed that rapid top-line expansion was being funded through substantial cash consumption and margin dilution, short-term investors actively locked in profits. While TD SYNNEX remains well-positioned to capitalize on long-term enterprise AI and cloud infrastructure cycles, the immediate focus for investors remains on working capital management, cash flow normalization, and margin stabilization.
Technical Analysis of TD Synnex Corp (SNX)
Technically, TD Synnex Corp (SNX) shows a MACD (12,26,9) value of 1.981, indicating a buy signal. The RSI at 45.787 suggests neutral condition and the Williams %R at 91.788 suggests oversold condition. Please monitor closely.
Fundamental Analysis of TD Synnex Corp (SNX)
TD Synnex Corp (SNX) is in the Technology Equipment industry. Its latest annual revenue is $62.51B, ranking 4 in the industry. The net profit is $820.16M, ranking 9 in the industry. Company Profile
Over the past month, multiple analysts have rated the company as Buy, with an average price target of $331.69, a high of $355.00, and a low of $287.00.
More details about TD Synnex Corp (SNX)
Company Specific Risks:
- Gross Margin Compression: In its Q3 FY2026 financial report filed on Form 8-K, TD SYNNEX disclosed that gross margin contracted by 61 basis points year-over-year to 6.61%, revealing that the rapid top-line expansion in enterprise AI and hyperscale server distribution carries dilutive profitability margins.
- Severe Free Cash Flow Drain: Quarterly financial results highlighted a sharp deterioration in cash generation, with free cash flow dropping to negative $975.6 million compared to positive $213.9 million in the prior-year period due to significant working capital consumed by server inventory buildup.
- Inventory Capital Cost Strain: Inventories surged to $15.3 billion to support hyperscale artificial intelligence orders, tying up substantial capital and raising debt and inventory holding risks if customer deployment timelines slow down.
- Overhead Valuation and Insider Selling Pressure: With the stock trading near 52-week high levels, market analysts noted persistent overhead risk driven by recent market tracking showing 70 insider sales and zero insider purchases over the preceding six months, encouraging profit-taking.
Recommended Articles


