

Goldman Sachs Group Inc Stock (GS) Moved Up by 4.01% on May 20: Key Drivers Unveiled
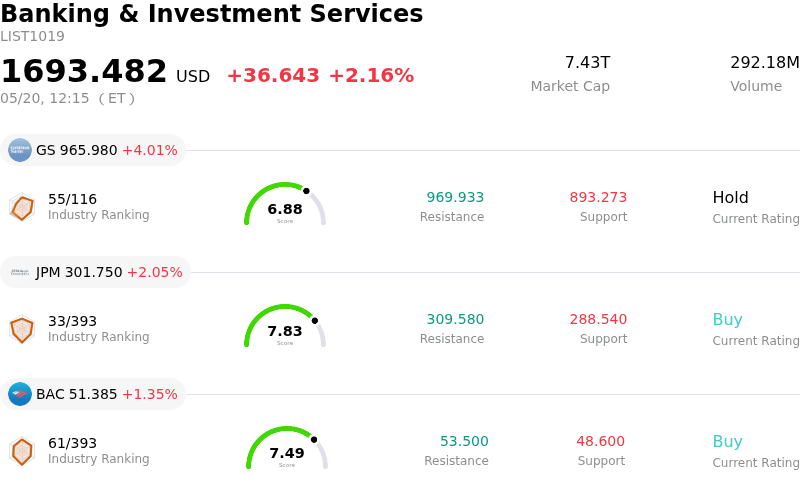
Goldman Sachs Group Inc (GS) moved up by 4.01%. The Banking & Investment Services sector is up by 2.16%. The company outperformed the industry. Top 3 stocks by turnover in the sector: Goldman Sachs Group Inc (GS) up 4.01%; JPMorgan Chase & Co (JPM) up 2.05%; Bank of America Corp (BAC) up 1.35%.
What is driving Goldman Sachs Group Inc (GS)’s stock price up today?
Goldman Sachs (GS) shares experienced an upward movement today, primarily driven by a confluence of positive developments concerning its core investment banking operations and recent financial performance. The most significant catalyst appears to be the firm securing the lead underwriting role for SpaceX's highly anticipated initial public offering. This prominent position in what could be one of the largest IPOs ever underscores Goldman Sachs' leadership in the investment banking sector and promises substantial fee generation.
Further contributing to the positive sentiment, Goldman Sachs delivered a robust first-quarter 2026 earnings report, surpassing analyst expectations for both earnings per share and revenue. The company reported a significant increase in its revenue year-over-year, with its investment banking segment showing a particularly strong performance, largely fueled by a resurgence in mergers and acquisitions activity. This strong financial data reinforces investor confidence in the firm's profitability and operational efficiency.
The firm's strategic outlook also played a role, with indications of a substantial deal backlog and expectations for continued robust M&A activity throughout 2026, partly due to anticipated interest rate declines. Additionally, Goldman Sachs' alternative investment arm recently completed the acquisition of FGI Worldwide, a move that expands its capabilities in working capital finance and trade credit insurance. While analyst ratings currently lean towards a consensus "Hold," recent adjustments from several firms have included upgraded price objectives and "outperform" ratings, reflecting an increasingly optimistic view of the company's prospects.
Technical Analysis of Goldman Sachs Group Inc (GS)
Technically, Goldman Sachs Group Inc (GS) shows a MACD (12,26,9) value of [15.60], indicating a neutral signal. The RSI at 51.38 suggests neutral condition and the Williams %R at -61.21 suggests oversold condition. Please monitor closely.
Fundamental Analysis of Goldman Sachs Group Inc (GS)
Goldman Sachs Group Inc (GS) is in the Banking & Investment Services industry. Its latest annual revenue is $117.10B, ranking 2 in the industry. The net profit is $16.30B, ranking 1 in the industry. Company Profile
Over the past month, multiple analysts have rated the company as Hold, with an average price target of $963.47, a high of $1050.00, and a low of $765.00.
More details about Goldman Sachs Group Inc (GS)
Company Specific Risks:
- Normalization of Asia prime balances and equity market volatility could compress equities financing, removing a key tailwind that drove a significant portion of the Q1 2026 Global Banking & Markets revenue.
- A prolonged Middle East conflict poses a risk to Net Interest Margin (NIM) compression in the Asset & Wealth Management private banking revenues, due to sustained elevated energy prices and delayed Federal Reserve rate cuts.
- Goldman Sachs' recent divestment from XRP and Solana ETFs, alongside reduced holdings in Bitcoin and Ether ETFs, signals a potential institutional de-risking from direct cryptocurrency exposure, which could negatively impact its asset management division's performance in digital assets.
- Despite strong Q1 2026 earnings, recent analyst commentary includes some lowered price targets from major firms such as Morgan Stanley and Bank of America, indicating potential concerns about the sustainability of current performance drivers or future growth.
Recommended Articles


