




This Market Signal Seen Only Once in History Points to What Comes Next
Key Points
The only other time that the Shiller P/E ratio was this high was just before the dotcom bust.
Investors shouldn't panic, but they should be aware of the historically high Shiller P/E ratio.
Knowing history can help investors make sound decisions about their portfolios.
- These 10 stocks could mint the next wave of millionaires ›
Only one other time in the 100-year history of the S&P 500 and its predecessor has the Shiller CAPE ratio been as high as it is right now.
It sounds potentially ominous. But what does that statement mean, exactly, and should you actually be concerned?
Missed AI’s "Act 1"? Act 2 Could Be 15x Bigger. Most investors think they missed the AI boat because they didn't buy Nvidia in 2005. But according to our analysts, we’re only at the end of "Act 1"—the R&D phase. "Act 2" is the global rollout. Continue »
You should definitely be aware of this lesser-known financial metric and prepare for any potential outcome, using history as your guide.

Image source: Getty Images.
What is the Shiller CAPE ratio?
Writers at The Motley Fool have sounded the alarm about the Shiller CAPE ratio for a while now, and they continue to, because it keeps going up.
The Shiller ratio, created by famed economist Robert Shiller, is also known as the cyclically adjusted price-to-earnings (CAPE) ratio. It has a solid reputation among veteran investors as an accurate gauge of the market's valuation. That's because the CAPE ratio looks at the valuation of the S&P 500 as a whole over the prior 10 years, adjusted for inflation. This broader view (when adjusted) smooths out short-term market ups and downs, providing a more accurate measure of where the market is from a valuation standpoint.
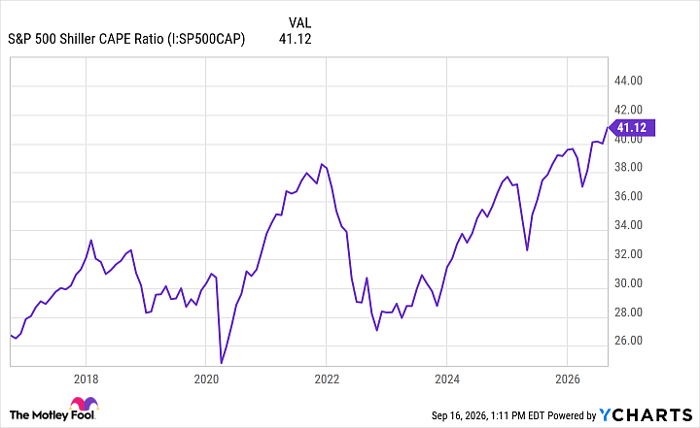
Data by YCharts.
The Shiller CAPE ratio is at 41.12 as of September. That's up from 40.90 in August and is roughly equal to the 41.13 mark in July. The July high-water mark, which September might beat before the month is out, is the highest the Shiller CAPE ratio has been since July 2020, when it was at 42.97.
That 1999-2000 dotcom boom was the period when the Shiller CAPE ratio reached an all-time high. From early 1999 to mid-2000, the Shiller CAPE was over 42, peaking at 44.19 in November 1999.
What comes next?
History tells us that the last, and only, time the Shiller CAPE ratio was this high, the bubble burst and the market spun into a multi-year bear market that saw the S&P 500 have three straight years of negative returns from 2000 through 2022.
The other occasion in recent history when the Shiller CAPE ratio soared to a historically high level was in November 2021, when it reached 38. What followed was the post-COVID-19 tech bubble bursting, and the 2022 bear market followed.
Will history repeat itself? History should always be heeded and used as a guide, but no two markets are the same, so it's hard to predict with a great degree of certainty if this cycle will follow past Shiller CAPE spikes. Compared to the dotcom bubble and even the post-COVID-19 tech bubble, this market features stronger earnings growth among its major players, like Nvidia, heavily fueled by AI. At the same time, there is still a good deal of speculation in many stocks, and those are the ones to watch out for.
The best way investors can protect themselves is to check the P/E ratios of the stocks in their portfolio and consider rebalancing those that are well above historical ranges. Investors may also want to be careful about piling into S&P 500 ETFs and add some active funds or some value-oriented exchange-traded funds (ETFs). This way, you're somewhat protected if the S&P 500 does sink.
Where to invest $1,000 right now
When our analyst team has a stock tip, it can pay to listen. After all, Stock Advisor’s total average return is 932%* — a market-crushing outperformance compared to 209% for the S&P 500.
They just revealed what they believe are the 10 best stocks for investors to buy right now, available when you join Stock Advisor.
See the stocks »
*Stock Advisor returns as of September 18, 2026.
Dave Kovaleski has no position in any of the stocks mentioned. The Motley Fool has positions in and recommends Nvidia. The Motley Fool has a disclosure policy.
Recommended Articles


