




The Stock Market Just Entered Its Worst Month of the Year. History Says This Will Happen Next.
Key Points
In the last 15 years, the S&P 500 has fallen by an average of 1.3% in September, making it the worst month of the year for the U.S. stock market.
Since 1950, the S&P 500 has fallen by an average of 18% at some point during midterm election years, but the index usually rebounds sharply afterward.
The S&P 500 has eventually recouped its losses from every past drawdown, which means all of them have been buying opportunities.
- 10 stocks we like better than S&P 500 Index ›
The S&P 500 (SNPINDEX: ^GSPC), widely considered the best barometer for the entire U.S. stock market, has added 12% year to date. That puts the benchmark index on course for its fourth consecutive year of double-digit gains.
But there may be trouble on the horizon. September has historically been the single worst month of the year for the U.S. stock market, with the S&P 500 delivering negative returns 53% of the time in the last 15 years. However, the probability of September losses is elevated this year because the stock market tends to decline sharply ahead of midterm elections.
Missed Nvidia in 2009? This Rare Signal Is Flashing Again. In 2009, a "Double Down" signal flashed for a little-known chipmaker called Nvidia. For the first time in years, that same "Total Conviction" signal is flashing for a company 1/100th the size of Nvidia. Continue »
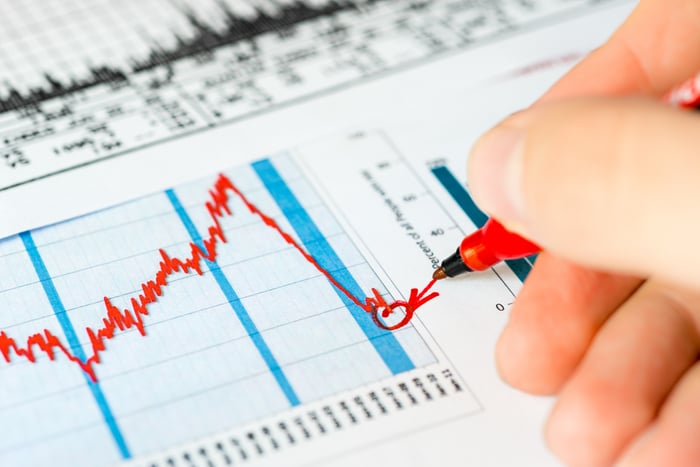
Image source: Getty Images.
September has historically been the worst month of the year for the S&P 500
In the last five years, the S&P 500 has fallen by an average of 2.7% in September, making it the worst month of the year for the stock market. That pattern holds over longer periods. In the last 15 years, the S&P 500 has declined by an average of 1.3% in September, but it has typically gained ground in every other month.
Some Wall Street strategists attribute that phenomenon, called the September Effect, to simple psychology. Investors anticipate losses in the market, so they sell stocks to avoid that outcome. But the decision to sell inevitably brings about the very losses they feared in the first place.
Another explanation is seasonality. Investors may rebalance their portfolios as they return from summer vacation; parents might sell stocks to cover school tuition; and mutual funds (many of which have fiscal years ending in September) frequently sell losing positions to harvest tax losses. All those behaviors could put downward pressure on the stock market.
Midterm elections create policy uncertainty that often drives steep losses in the stock market
Midterm election years have historically been the weakest of the four-year presidential cycle for the stock market. They are particularly well-known for their intra-year volatility. Between 1950 and 2022, the S&P 500 (and the precursor index) declined by an average of 18% at some point during midterm election years, per Carson Investment Research.
In most cases, those losses showed up later in the year, typically during the third or fourth quarter. In fact, between 1950 and 2022, the S&P 500's low point during midterm election years has occurred more often in October than any other month, and the drawdown has usually started in September.
Of course, there is no guarantee history will repeat itself this year. But the stock market tends to decline ahead of midterm elections because the president's party generally loses seats in Congress, which creates policy uncertainty. Some investors navigate the situation by selling stocks. And Donald Trump's presidency has been defined by uncertainty.
Fortunately, there is some good news: Since 1950, after the S&P 500 has hit bottom during a midterm year, the index has never been lower a year later. In fact, the S&P 500 has gained an average of 32% over the 12 months following its low point during midterm years.
What does that mean? Year to date, the S&P 500's lowest point was 6,344 on March 30. If the index's performance matches the historical average, it will advance 32% to 8,374 by March 30, 2027. That implies 9% upside from its current level of 7,659 over the next seven months.
Here's the big picture: Investors have reason to think this month will be challenging. Not only has September historically been the worst month of the year for the stock market, but the upcoming midterm elections also represent an additional source of volatility. Collectively, those headwinds could lead to steep losses.
However, the S&P 500 has always recouped past losses, and the index has delivered especially strong returns once midterm election results are finalized and policy uncertainty dissipates. So investors should treat any substantial declines this month as opportunities to buy an S&P 500 index fund or quality stocks.
Should you buy stock in S&P 500 Index right now?
Before you buy stock in S&P 500 Index, consider this:
The Motley Fool Stock Advisor analyst team just identified what they believe are the 10 best stocks for investors to buy now… and S&P 500 Index wasn’t one of them. The 10 stocks that made the cut could produce monster returns in the coming years.
Consider when Netflix made this list on December 17, 2004... if you invested $1,000 at the time of our recommendation, you’d have $437,097!* Or when Nvidia made this list on April 15, 2005... if you invested $1,000 at the time of our recommendation, you’d have $1,355,077!*
Now, it’s worth noting Stock Advisor’s total average return is 978% — a market-crushing outperformance compared to 213% for the S&P 500. Don't miss the latest top 10 list, available with Stock Advisor, and join an investing community built by individual investors for individual investors.
See the 10 stocks »
*Stock Advisor returns as of September 2, 2026.
Trevor Jennewine has no position in any of the stocks mentioned. The Motley Fool has no position in any of the stocks mentioned. The Motley Fool has a disclosure policy.
Recommended Articles


