


Why Some Stocks Hold Their Ground When Everything Else Falls
Let me start with a true story.
In 2008, the United States experienced the worst financial crisis in modern history. That year, the S&P 500 fell roughly 38.5% for the full year.
That number might sound manageable — until you realize that if you held not just the broad market but stocks at the center of the storm — financial stocks, or the tech darlings that so many people were chasing at the time, like Apple or Google — those dropped well over 55% that year. That means $1,000,000 invested in January could be worth less than $450,000 by December. Many people's retirement funds and pension accounts were cut nearly in half that single year.
And yet, in the same year of across-the-board collapse:
- Walmart rose roughly 18% for the full year.
- McDonald's delivered a total return of around 8%, including dividends.
- Dollar Tree, the discount retailer, surged 60% while everything else was in freefall.
This wasn't a coincidence, and it wasn't inside information. It's a pattern that repeats itself in every single economic recession throughout history.
Today I want to explain clearly: Why do some stocks fall less — or even go up — when markets crash? What do they have in common? And once you understand the logic, what can you do with it?
Why Now Is the Right Time to Talk About This
Let me first explain why I chose this particular moment to cover this topic.
It is now March 2026. Over the past few months, several things have happened nearly simultaneously:
The Middle East situation has remained volatile, disrupting oil supplies and pushing Brent crude prices toward $100 per barrel. When energy prices rise, inflation goes up with them. When inflation rises, the Federal Reserve faces an impossible dilemma — raise rates and drag the economy down, or hold off and lose control of inflation.
At the same time, Goldman Sachs raised its 12-month recession probability from 20% to roughly 25–30% in late March, and JPMorgan's estimate sits at 30–35%.
On the sentiment side, the American Association of Individual Investors (AAII) survey showed bearish readings hovering between 36–40% in late February through early March — well above the long-term average.
In other words, a lot of people in the market are already worried about a recession — but the recession itself hasn't arrived yet.
This in-between phase is precisely the best time to understand the logic of defensive stocks. By the time a recession actually hits, prices will have already adjusted. Thinking about it then is too late.
The Trap Most Retail Investors Fall Into
Before getting into the substance, I want to highlight a mistake that almost every retail investor has made at least once.
When recession fears build, the first instinct for many people is: Sell everything now, wait for the market to stabilize, then get back in.
The other type does the opposite: Hold everything and don't move — I'm a long-term investor, short-term volatility doesn't matter.
Both of these approaches share a hidden assumption: when the market falls, all stocks fall together.
But the data tells a completely different story.
In 2008, many individual financial sector stocks fell 70%, 80%, or even more from their peaks. In that same year, the consumer staples sector as a whole declined only in the mid-teens — a fraction of the damage.
In the sharp sell-off of February–March 2020, the energy sector ended the full year down over 37%, while healthcare and consumer staples held up comparatively well and were among the most resilient sectors during the crash phase.
Do you see the implication? If you had shifted the cyclical portions of your portfolio into defensive holdings before a recession, you might have dropped only 5–10% even while the broader market fell 30%.
That gap, when compounded through the subsequent recovery, amounts to far more than just those 20 percentage points.
So the central question we're discussing today has never been whether a recession will come. It's: What role will what you currently hold play inside a recession?
Core Concept: Cyclical vs. Defensive
Let's establish a foundational framework. This is the most important concept in today's piece — every example that follows builds on it.
Stocks can be broadly divided into two categories based on their sensitivity to the economic cycle:
The first category: Cyclical stocks.
These companies' businesses are directly tied to the ups and downs of the broader economy. When the economy is strong, consumer spending is robust and these companies post great earnings. When the economy weakens, consumers tighten their belts and these companies are hit first.
Airlines, hotels, automobiles, luxury goods, semiconductors, steel — these all fall into this category.
The reason is simple: these are things people buy when they have money, and can easily defer or skip when they don't. You can hold off on buying a new car, skip a vacation, or use your old phone for another two years.
The second category: Defensive stocks.
These companies sell things that people need to buy regardless of economic conditions. During downturns, demand barely contracts, so revenues stay relatively stable — and share prices tend to hold up during recessions, sometimes even rising.
Key defensive sectors include:
- Consumer Staples: Supermarkets, household goods, food and beverages. Walmart, Procter & Gamble, Coca-Cola all belong here.
- Healthcare: Pharmaceutical companies, medical device makers. People don't postpone getting sick just because the economy is weak.
- Utilities: Water, electricity, natural gas. These bills must be paid.
- Discount Retail: Companies like Dollar Tree. When times are hard, people actually trade down toward cheaper options.
There is one more asset class worth singling out — gold. Strictly speaking, it's not a stock, but when recession expectations heat up, the dollar weakens, and inflation picks up, gold is often one of the first assets institutional investors add to their portfolios. Its defensive quality doesn't come from stable cash flows — it comes from a safe-haven consensus built over thousands of years: when people stop trusting paper currency, banks, or any category of financial asset, gold is the final refuge.
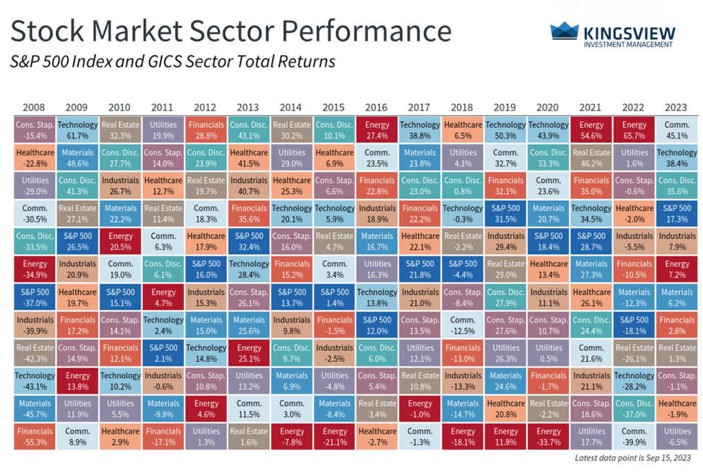
Source: Kingsview
The sector heatmap showing S&P 500 performance by sector from 2008 to recent years illustrates this clearly — in the 2008 column, most sectors show deep red, while consumer staples and healthcare show far milder declines.
This is how defense truly appears in the data.
The 2008 Financial Crisis
Let's look at three major historical recessions and examine how defensive stocks actually performed.
First: 2008.
This was the worst financial crisis the United States had experienced since World War II, triggered by the subprime mortgage bubble. Banks had packaged enormous volumes of mortgages and sold them to people who had no ability to repay — and eventually the entire financial system suffered a systemic collapse.
The S&P 500 fell nearly 57% from its October 2007 peak to its March 2009 trough. Financials bore the brunt of it; technology, industrials, and consumer discretionary all fell sharply too.
Yet in that same year, a few companies turned in remarkable results:
Walmart rose 18% for the full year of 2008. The reason is straightforward: in a tough economy, people stopped shopping at upscale grocers and went to Walmart instead. Foot traffic and revenues actually increased during the crisis.
McDonald's gained roughly 6% for the year. Same logic — when people cut back on dining, they don't stop eating out entirely. They downgrade from sit-down restaurants to fast food. McDonald's was a direct beneficiary of that trade-down.
Dollar Tree surged over 80% cumulatively during 2008–2009. This extreme-value dollar store sells basic household items at rock-bottom prices. During the crisis, it attracted floods of middle-class shoppers who would never have set foot there before.
Consumer staples as a whole were among the least-damaged sectors of the entire S&P 500 in 2008, dramatically outperforming the index.
Gold told its own completely different story that year.
In 2008, almost every asset class fell. Stocks dropped, real estate collapsed, commodities cratered — even crude oil plunged from nearly $150 per barrel to below $40. But gold ended the full year up over 5%, making it one of the rare assets that genuinely moved in the opposite direction.
The reason is not hard to understand. People in 2008 weren't buying gold out of optimism — they were fleeing everything else. When Lehman Brothers collapsed, when banks began lining up for government rescues, when nobody knew who would be the next to fail, capital needed a place to park that had no connection whatsoever to any financial institution. Gold was that place. It carries no counterparty risk, it cannot go bankrupt, it depends on nobody's creditworthiness. The more systemic the crisis, the more valuable those properties become.
And the aftermath was even more significant. Gold rallied continuously from late 2008 all the way through 2011 — rising from roughly $800 to over $1,900 per ounce, more than doubling in three years. Even after the immediate crisis passed, the aftershocks did not. Governments around the world had injected enormous sums of money to stabilize the system, and markets began to worry that all that stimulus would eventually return as inflation. That long-term fear of currency debasement kept gold in a multi-year bull run well after the crisis itself was over.
Why does all this happen?
There is a pattern that is easy to understand: some things people must buy no matter how bad conditions get.
- Food — if you're hungry, you eat.
- Medicine — if you're sick, you seek treatment.
- Utilities — the bills arrive regardless.
Luxury cars, high-end travel, the latest smartphone — people are willing to pay for these in good times, and can stop almost immediately when times turn hard. Conversely, no matter how good the economy is, people don't eat six meals a day or take medicine they don't need.
Gold operates through a different mechanism: the more chaotic the market, the more people holding cash don't know where to put it — and gold becomes that default destination. Especially when markets begin to doubt dollar credibility, worry about inflation, or question whether the financial system itself might fracture, gold attracts the most extreme safe-haven demand.
Whether it's consumer staples, discount retail, or gold — the underlying logic is the same: In the worst of times, how hard is it to give up what you're selling? That is the moat of a defensive asset.
The 2020 Pandemic Crash
The second case: 2020.
From the February 19 peak to the March 23 trough, the S&P 500 fell roughly 34% in just 23 trading days — the fastest descent into a bear market in history.
But the rebound was equally stunning. The market recovered all its losses in just five months, and the S&P 500 closed the full year up 18.4%.
This time, the winners and losers were distributed a little differently — because this recession was triggered by a pandemic, not by structural economic dysfunction.
On the losing side: the energy sector fell over 37% for the full year, as global travel came to a halt and oil prices imploded. Financials fell over 20%, as the low-interest-rate environment crushed bank profitability.
On the winning side, something interesting happened: among technology companies, Amazon surged 76% for the year, because lockdowns caused explosive growth in e-commerce and cloud computing demand. Healthcare also performed strongly, with pandemic-related diagnostics, pharmaceuticals, and medical devices all benefiting.
There is something worth examining here: the 2020 winners were not exactly the same as the 2008 winners.
In 2008, the winners were physical discount retail — Walmart, McDonald's, Dollar Tree.
In 2020, digital infrastructure was added to the roster. Amazon had become an essential service provider; during lockdowns, people genuinely could not function without it.
Gold was also a winner in 2020. Gold rose roughly 25% that year, briefly breaking above $2,000 per ounce in August — a new all-time high at the time. The mechanism was slightly different from the defensive play in equities: after the pandemic, central banks around the world engaged in unprecedented monetary stimulus. The Federal Reserve's balance sheet nearly doubled in a matter of months. Markets began to worry about currency debasement, and in that context, gold was playing its other role — a hedge against excessive money printing. It rose sharply because people were beginning to lose confidence in the value of the money in their pockets.
This illustrates an important point: defensiveness is not a fixed label attached to a sector — it is a context-dependent quality. The key question is: In this particular crisis, is what you provide a necessity?
Amazon was a high-risk growth stock during the 2001 dot-com crash. In the 2020 pandemic, it was infrastructure. Same company, completely different defensive characteristics — because the context changed.
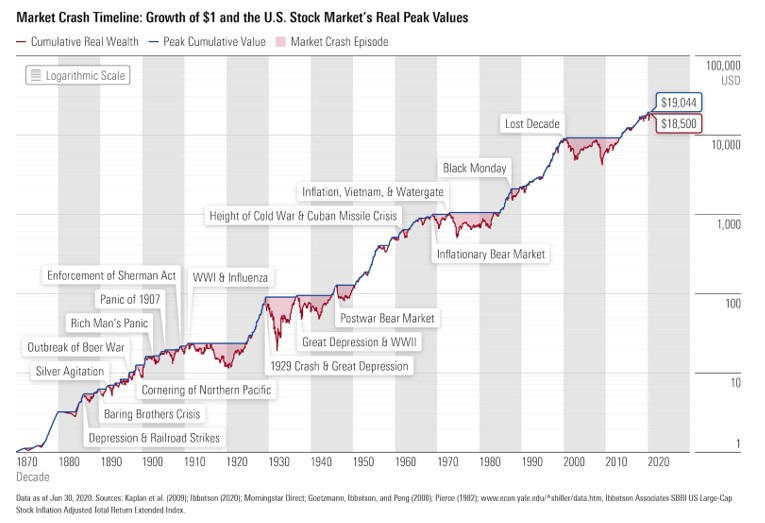
Source: Morningstar
The long-run chart of U.S. equity markets from 1870 to the present makes one thing abundantly clear: every major crash — the Great Depression, Black Monday in 1987, 2008, 2020 — the market eventually recovered and pushed to new highs.
The value of defensive assets was never about avoiding all losses. It is about losing less at the bottom of each crash, so that when recovery comes, you are standing on higher ground.
Why the Math of "Losing Less" Matters
Let's work through a simple calculation that many people have never seriously thought about.
Assume you have $1,000,000. In a major downturn:
- Scenario A (Aggressive): Portfolio falls 50%. You have $500,000. You need a 100% gain just to break even.
- Scenario B (Defensive): Portfolio falls 15%. You have $850,000. You only need an 18% gain to break even.
When the market subsequently rallies 50%:
- Scenario A goes from $500,000 to $750,000 — still not back to your starting point.
- Scenario B goes from $850,000 to $1,275,000 — already at a new all-time high.
Same recession. Same recovery. Final difference: $525,000.
That is why losing less is sometimes more important than gaining more. What makes this especially painful for Scenario A is that you would need to wait for a full doubling — a rare event — just to get back to even, let alone catch up to Scenario B. Those opportunities are scarce, and they require surviving all the volatility in between. This is why many people who lived through a great bull market still find their accounts lagging far behind.
Historical data supports this logic. Using the 2008–2010 period as an example: the S&P 500's total annual returns were approximately -37% in 2008, +26.5% in 2009, and +15.1% in 2010. Over that same stretch, the consumer staples ETF XLP returned roughly -15% in 2008, +14.3% in 2009, and +13.8% in 2010.
If you had invested $1,000,000 in each at the start of 2008 and done absolutely nothing for three years:
- The S&P 500 side ends up at roughly $920,000.
- The XLP side ends up at roughly $1,050,000.
What is striking: in 2009 and 2010, the S&P 500 actually outperformed XLP in those individual years — yet it still never caught up, because the 2008 deficit was simply too large to overcome.
The 2022 bear market showed the same structure: the S&P 500 fell nearly 20% that year, while XLP fell only around 3% — a gap of roughly 17 percentage points. That cushion, compounded through the recovery, grows into a meaningfully larger final number than most people expect.
What Is Happening in the Market Right Now
Let's bring this back to the present.
If you zoom in on the past few months of 2026, you can see two very different defensive postures playing out simultaneously:
On one side: institutional investors and large capital allocators who have been quietly repositioning since early in the year.
On the other side: retail investors and active traders who are largely continuing the habits developed during the bull market years.
On the institutional side:
From the very start of this year, sector performance has been sending an unusual signal. Through the end of February, the top-performing sectors year-to-date have almost uniformly been either resource-oriented or defensive: energy approximately +25%, materials +17.9%, industrials +14.3%, consumer staples +15.9%, utilities +11.9%. The technology and financial sectors — the favorites of recent years — have lagged noticeably. Large institutional capital has been rotating toward defensive and real asset exposures.
Sell-side research has reinforced this narrative. Bank of America's early-2026 strategy report listed healthcare and real estate as its top overweight recommendations for U.S. equities, while maintaining a generally favorable view on consumer staples. CTA and quantitative strategies have systematically begun reducing equity exposure, adding short positions and hedges — Bank of America estimated that these systematic strategies represent potential selling pressure in the range of tens of billions of dollars. High-valuation, economically-sensitive assets have been quietly downweighted; energy, resources, and defensive sectors have been incrementally lifted. On gold, an increasing number of institutions are treating it as a permanent portfolio hedge, with allocation levels trending higher over the past two years and recent capital flows reflecting that positioning.
In other words, institutions didn't begin thinking about defense after the recent geopolitical escalation. They started rebalancing earlier — when valuations were elevated and oil prices and geopolitical risk were just beginning to rise.
On the retail side, the rhythm is completely different.
Trading data this year shows that typical retail behavior has largely been an extension of habits built over the past several years: when tech dips, buy more.
JPMorgan's Flow Deck report showed that in early February, the software sector as a whole had fallen nearly 20% from its year-to-date highs — technically entering a bear market. In the days following that software sell-off, retail inflows noticeably picked back up, with daily buying activity exceeding the year-to-date average. Microsoft, Palantir, and AppLovin — all viewed as high-quality AI-related software stocks — saw the strongest retail buying interest.
By mid-March, total retail buying activity had declined roughly 30% from its early-year peak, but sector preferences had not meaningfully rotated toward defense. Money was still flowing to familiar names: large-cap AI-related tech, some semiconductors, and high-beta plays. Meanwhile, energy — which earlier in the year had been viewed as a geopolitical beneficiary — was actually seeing net retail selling.
To summarize the contrast:
Institutional defense has largely meant rotating out of high-growth, high-valuation positions and into defensive sectors and real assets — shifting from max-tech + index exposure into selective sectors, using energy and industrials to hedge inflation and geopolitical risk, while gradually building up healthcare, utilities, and consumer staples that tend to hold up during recessions.
Retail defense, by contrast, looks more like doubling down in familiar territory — buying tech dips, especially anything labeled with an AI narrative, with the biggest retail flows appearing precisely when those stocks have experienced the sharpest corrections. This approach worked well during the bull market years, but whether it holds up inside an actual recession is an entirely different question.
This is exactly why I've taken the time at this particular moment to walk through the full logic of defensive assets. The goal is not to tell you to sell everything and load up on utilities and consumer staples. The goal is to give you an additional option: beyond buying tech dips, you can also think about your portfolio the way institutions do — clearly separating what is in your portfolio for offense, and what is there to absorb risk. Defensive sectors deserve attention. So does gold — historically, in every truly serious equity market event, it has fallen less and often moved in the opposite direction, maintaining low correlation with stocks. How exactly you implement this depends on your individual situation, but having this perspective in your mind is what this article set out to leave you with.
An Action Framework: Three Questions
Finally, three actionable questions. When recession expectations are building, run each position in your portfolio through these.
Question 1: Does each company I own sell things people want — or things they must have?
Think through every company's core business: if the unemployment rate rose two percentage points tomorrow, would this company's customers meaningfully cut their spending? If yes — it's cyclical. If no — it's defensive.
Question 2: Do I actually know how much my portfolio would fall in a recession?
Most people have never honestly confronted this number. Historically, the consumer staples sector's maximum drawdown in recent recessions has been roughly 15–30%. Healthcare is similar. Both are dramatically more moderate than financial stocks or consumer discretionary names, which can fall 50% or more. What is your own maximum tolerable drawdown? Does your current portfolio match that number?
Question 3: Am I considering making a change because I have a logical reason — or because I'm scared?
This is the hardest one.
Once recession fears arrive, if you feel the impulse to sell all your tech stocks and immediately buy defensive names, that move may not be strategy — it may be emotion. A logically sound adjustment means reviewing your portfolio weights, comparing them against your actual risk tolerance, and making small, reasoned rebalancing moves — not panic-selling everything in the most fearful moment and sprinting to a completely different strategy.
Conclusion
Here is what today covered:
First, markets do not fall uniformly in recessions. Consumer staples, healthcare, and utilities have consistently outperformed the broader market during most economic downturns.
Second, the underlying principle can be stated in one sentence: In the worst of times, how hard is it to give up what you're selling? People can skip a new car, skip a vacation, skip a new phone — but they cannot skip eating, cannot skip medicine, cannot skip the utility bill.
Third, losing less is sometimes more important than gaining more. Losing 20 fewer percentage points in a recession, compounded through the subsequent recovery, translates into real money — more than most people intuitively expect.
Fourth, gold occupies a special category among defensive assets. People can choose not to buy stocks, but when the monetary system is under stress, when inflation is spiraling out of control, when markets begin to lose faith in paper currency — thousands of years of accumulated safe-haven consensus cause capital to flow toward it naturally.
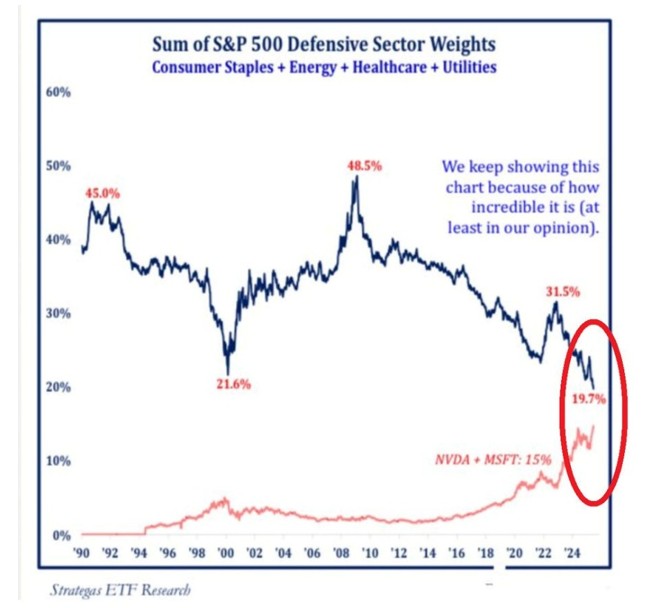
Source: ETF Research
The chart showing consumer staples, healthcare, and utilities weights within the S&P 500 over time illustrates this: zooming out, these sectors have trended upward during major drawdown periods, reflecting capital flowing in from more interest-rate-sensitive and higher-valuation sectors like technology and consumer discretionary.
A final thought to leave you with:
When markets are good, everyone is asking how to make more. What truly separates people over time is the small number who, before markets turn bad, have already thought clearly about how much they are willing to lose.
Disclaimer: This article is for informational and educational purposes only and does not constitute investment advice. Any stocks, sectors, or asset classes mentioned are referenced solely to illustrate historical patterns and do not represent a recommendation or endorsement of any investment product. All investments involve risk. Please consult a qualified financial advisor before making any investment decisions.
Recommended Articles


