


U.S. September PCE: Likely to Fall Short of Expectations, Bullish for US Stocks
1. Introduction
Due to the U.S. government shutdown, the October CPI is not expected to be released, and the November CPI is projected to come out after the Federal Reserve's monetary policy meeting. This means the PCE (Personal Consumption Expenditures Price Index) data, scheduled for release on 26 November, will be particularly critical to the Federal Reserve's interest rate decision on 10 December. Currently, the market widely anticipates that the core PCE year-on-year growth rate for September will stand at 2.9% (Figure 1), and we expect the upcoming data to be slightly below this consensus forecast.
If the core PCE data falls short of expectations (in line with our projection), it will reinforce the expectation that the Federal Reserve will continue to cut interest rates in December and the first half of next year, which in turn will be bullish for the broader U.S. stock market—investors may focus on broader market ETFs such as SPY and QQQ; at the sector and individual stock levels, weaker-than-expected core PCE will directly benefit the U.S. consumer discretionary and consumer staples sectors, with investors paying attention to staples leaders Colgate-Palmolive (CL) and Grocery Outlet (GO), as well as discretionary leaders Carnival Corporation (CCL) and Lowe’s Companies (LOW); indirectly, the core PCE miss is likely to prompt the Federal Reserve to ease monetary policy, which will be significantly bullish for U.S. technology stocks (e.g., NVIDIA (NVDA), Microsoft (MSFT)) and gold stocks (e.g., Newmont Corporation (NEM), Barrick Gold Corporation (B)).
Figure 1: U.S. PCE (%, y-o-y)
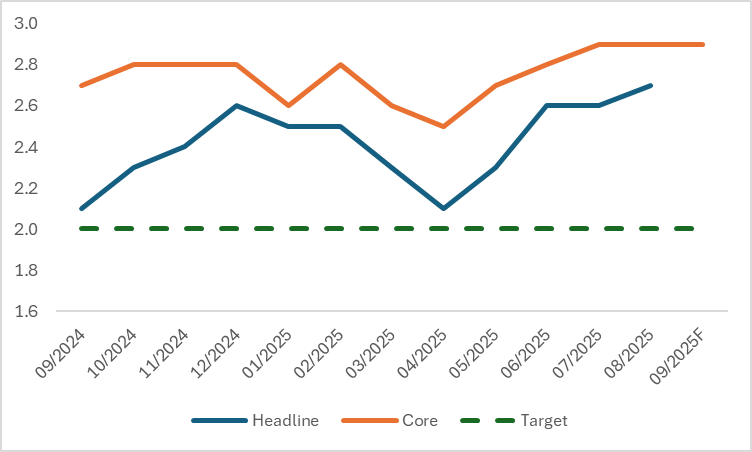
Source: Refinitiv, TradingKey
2. Differences Between PCE and CPI
Both the PCE and the CPI are core indicators for measuring price changes, but they differ significantly in statistical logic, coverage scope, and application scenarios. The key distinctions focus on three aspects.
In terms of statistical scope, the CPI focuses on a fixed basket of goods for urban residents' daily consumption, covering 8 major categories and 262 basic subcategories—including food, housing, and transportation—and emphasises reflecting price changes of goods and services "directly purchased" by residents. In contrast, the PCE has a broader coverage: it not only includes residents' direct consumption but also incorporates "indirect consumption" such as medical insurance provided by employers and consumption derived from government transfer payments, thus more comprehensively reflecting the overall price level of the consumer market.
There are significant differences in weight calculation methodologies: the commodity weights of the CPI are based on household consumption expenditure surveys and adjusted at fixed intervals (once every several years), resulting in strong short-term rigidity, while the PCE weights are derived from national economic accounting data and adjusted dynamically in real time as consumption behaviours change, allowing the PCE to more promptly reflect shifts in residents' consumption structures—for instance, the rapid increase in the weight of online consumption following the pandemic.
Due to differences in data sources and application scenarios, the CPI is derived from sampling surveys of urban and rural households. Directly linked to people’s livelihood perceptions, it serves as a crucial basis for adjusting pensions and minimum wage standards. In contrast, the PCE integrates multi-source data such as enterprise sales figures and administrative records, making it more aligned with the needs of macroeconomic accounting.
Despite numerous differences, the two key inflation indicators have shown a high degree of similarity in their trends (Figures 2.1 and 2.2). Core CPI came in at 3% in September, slightly below the broad market expectation and August’s 3.1%; core PCE for the month is also highly likely to be lower than its August reading.
Figure 2.1: U.S. PCE and CPI (%, y-o-y)
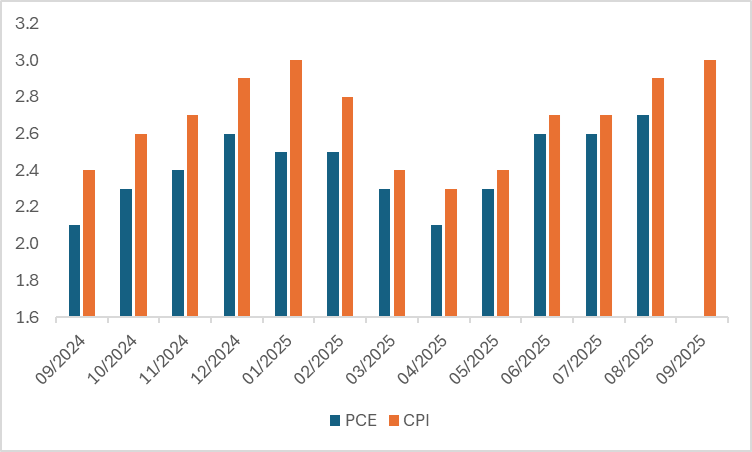
Source: Refinitiv, TradingKey
Figure 2.2: U.S. Core PCE and CPI (%, y-o-y)
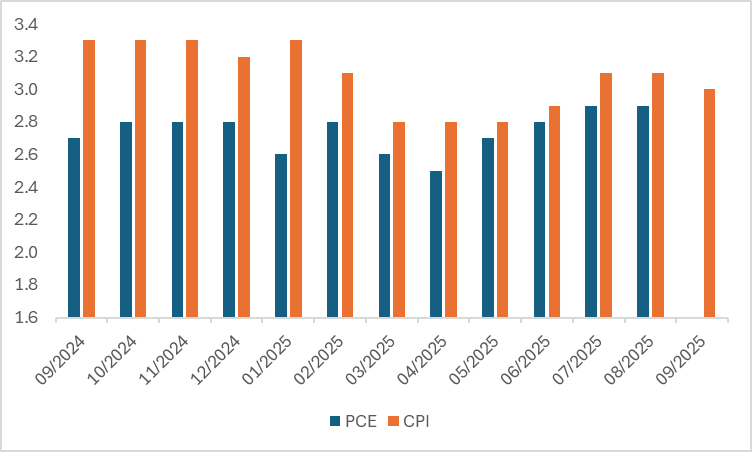
Source: Refinitiv, TradingKey
3. What Do Changes in Core PCE Indicate?
Core PCE has emerged as the Federal Reserve’s primary reference for monetary policy, largely due to its ability to accurately reflect long-term inflation trends. Compared to CPI, core PCE boasts a broader coverage—incorporating indirect consumption such as employer-sponsored healthcare costs—and its consumption basket is dynamically adjusted annually. This avoids "substitution bias" and better aligns with actual consumer behaviour. More importantly, it excludes short-term volatile components like food and energy, which are susceptible to seasonal and geopolitical factors. Instead, it focuses on price movements in service sectors (e.g., healthcare and housing) driven by wage growth—key to assessing the "wage-price spiral" and directly linked to the persistence and stickiness of inflation. The Federal Reserve’s 2% inflation target is explicitly anchored to core PCE, making it the central fulcrum for balancing its dual mandate of "price stability" and "maximum employment."
If core PCE falls in September, it will raise the probability of the Federal Reserve cutting interest rates in December. First, a decline in this indicator reflects easing inflationary pressures and may signal reduced risks of an inflationary rebound in the coming months, creating a "safe window" for accommodative monetary policy. Second, as core PCE is directly linked to aggregate demand, its drop is often accompanied by a sustained slowdown in consumption and investment momentum. In such a scenario, further rate cuts can stimulate demand by lowering borrowing costs, helping to avert an economic recession. Finally, historical lessons underscore the need for the Federal Reserve to respond promptly to cooling inflation. If core PCE in September and beyond consistently falls short of market expectations, ramping up rate cuts would be a forward-looking move by the Fed to balance steady growth and stable inflation (Figure 3).
Figure 3: Fed Policy Rate (%)
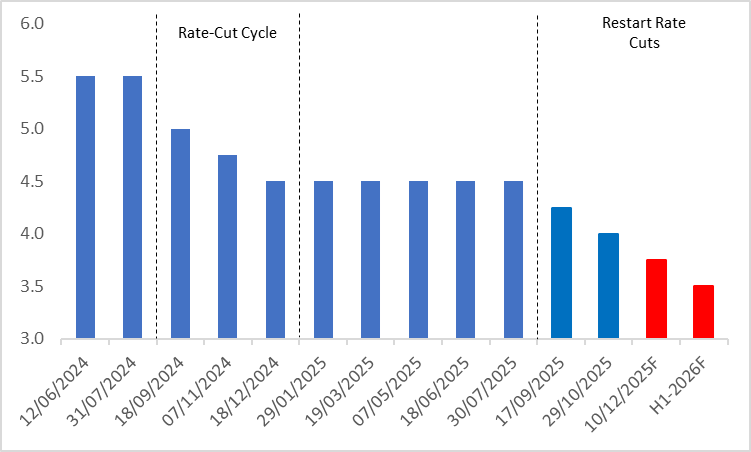
Source: Refinitiv, TradingKey
4. Post-Market Trend of U.S. Stocks
If U.S. inflation remains within a manageable range, the Federal Reserve’s sustained interest rate cuts will be favourable for the broader U.S. stock market. Especially driven by the current rate-cut trades, the ongoing monetary easing is expected to help the broader market achieve new heights. Therefore, investors may focus on broad-market ETFs such as SPY and QQQ.
At the sector and individual stock levels, the core PCE falling short of expectations is a direct positive catalyst for the U.S. consumer discretionary and consumer staples sectors. Backed by their inherent characteristics, both sectors are poised for a recovery. Consumer staples boast rigid demand, enabling stable profitability even amid market volatility; the easing of inflationary pressures further reinforces the certainty of their earnings. While consumer discretionary is cyclical, stable prices will boost households’ real incomes and enhance consumer spending sentiment, fuelling revenue and profit growth for the sector.
Specifically, among leading consumer staples companies, Colgate-Palmolive (CL) is expected to deliver steady profit growth backed by product innovation and channel advantages; as a discount retailer, Grocery Outlet (GO) maintains solid demand amid the consumer focus on cost-effectiveness. In the consumer discretionary sector, Carnival Corporation (CCL) has improved profit margins through asset optimisation, with robust booking data; Lowe’s (LOW) has benefited from the recovery in home improvement demand, and its growth momentum has been strengthened following acquisition integration. All these leading stocks are well-positioned to sustain gains as the consumption environment improves.
Regarding indirect factors, the core PCE falling short of expectations has prompted the Federal Reserve to cut interest rates, delivering a significant bullish boost to U.S. tech stocks and gold equities. Leveraging their inherent characteristics, both sectors are poised for strong performance. Interest rate cuts will lower corporate financing costs, providing ample liquidity for tech stocks’ R&D investment and business expansion. As a non-interest-bearing asset, gold becomes more attractive in a rate-cutting environment, with its safe-haven properties and value-preservation demand set to be further accentuated.
More specifically, among leading technology stocks, NVIDIA (NVDA) continues to benefit from the industry's high growth by leveraging its absolute dominance in the AI chip sector, while Microsoft (MSFT) has achieved robust growth in its Azure cloud business with its AI initiatives consistently delivering tangible returns. In the gold stock segment, Newmont Corporation (NEM), a sector leader, boasts significant economies of scale and superior resource reserves, and Barrick Gold Corporation (GOLD) maintains steady demand amid the interest rate cut cycle supported by its prudent operations and reliable dividend payouts—all these leading individual stocks are well-positioned to fully capitalize on the dividends brought by improved policy conditions.
5. Conclusion
In summary, if the core PCE data falls short of expectations (consistent with our projection), it will reinforce the market's expectation that the Federal Reserve will maintain interest rate cuts in December and the first half of next year. This, in turn, will be bullish for the broader U.S. stock market, and investors may focus on ETFs such as SPY and QQQ. At the sector and individual stock levels, moderating core PCE data will directly benefit the U.S. consumer discretionary and consumer staples sectors. Investors could consider leading consumer staples stocks like Colgate-Palmolive (CL) and Grocery Outlet (GO), as well as leading consumer discretionary names such as Carnival Corporation (CCL) and Lowe’s Companies (LOW). Indirectly, the core PCE miss is likely to prompt the Federal Reserve to cut interest rates, which will be significantly bullish for U.S. technology stocks (e.g., NVIDIA (NVDA), Microsoft (MSFT)) and gold stocks (e.g., Newmont Corporation (NEM), Barrick Gold Corporation (GOLD)).
Recommended Articles


