


Bitcoin Weekly Forecast: The capitulation phase unfolds
- Bitcoin extends losses on Friday, falling below $97,000 and shedding more than 7% so far this week.
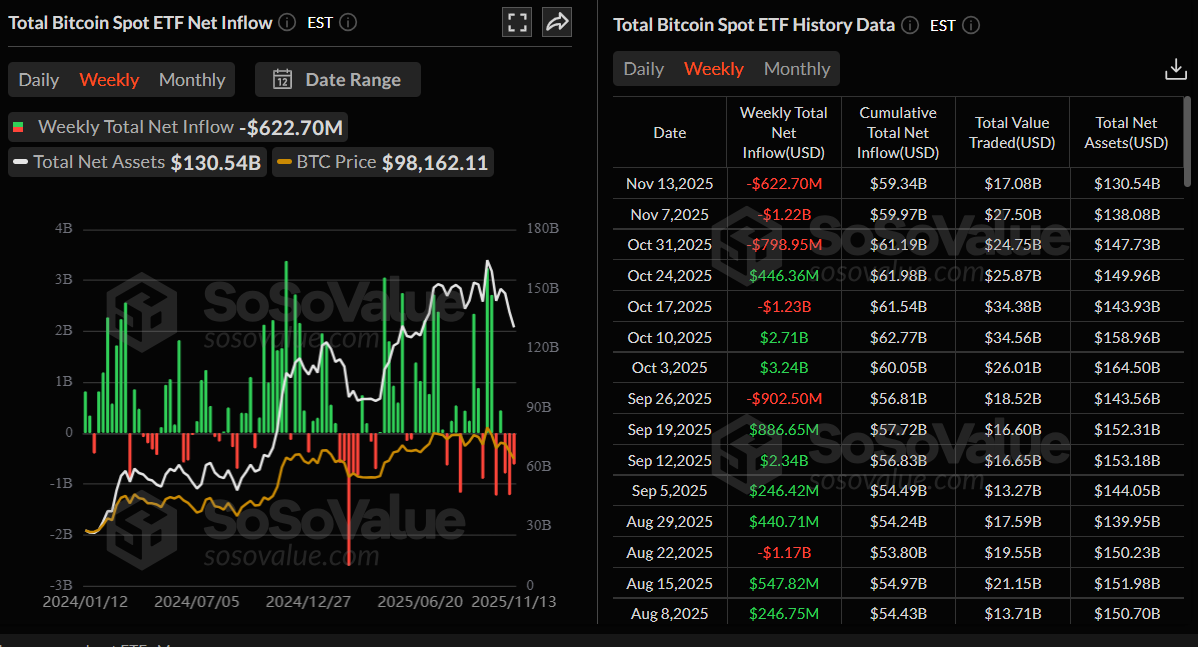
- US-listed spot Bitcoin ETFs record a weekly outflow of $622.70 until Thursday, marking a third consecutive week of investor pullback.
- On-chain data indicates that BTC remains in an extremely bearish phase as the price retreats further from the $100,000 zone.
Bitcoin (BTC) market structure continues to deteriorate as the capitulation phase begins to take shape, with BTC sliding below $97,000 on Friday and extending losses to more than 7% so far this week. Institutional demand continues to weaken as spot Bitcoin Exchange Traded Funds (ETFs) recorded an outflow of $622.70 million as of Thursday, marking a third consecutive week of withdrawals.
Meanwhile, on-chain data points to intensifying downside pressure as BTC drifts further away from the critical $100,000 threshold.
Fading institutional demand
Bitcoin began the week on a weak footing, losing momentum after a brief weekend recovery, and dropping more than 7% so far this week, hitting a low of $95,933 on Friday, which places BTC nearly 24% below its October all-time high of $126,199.
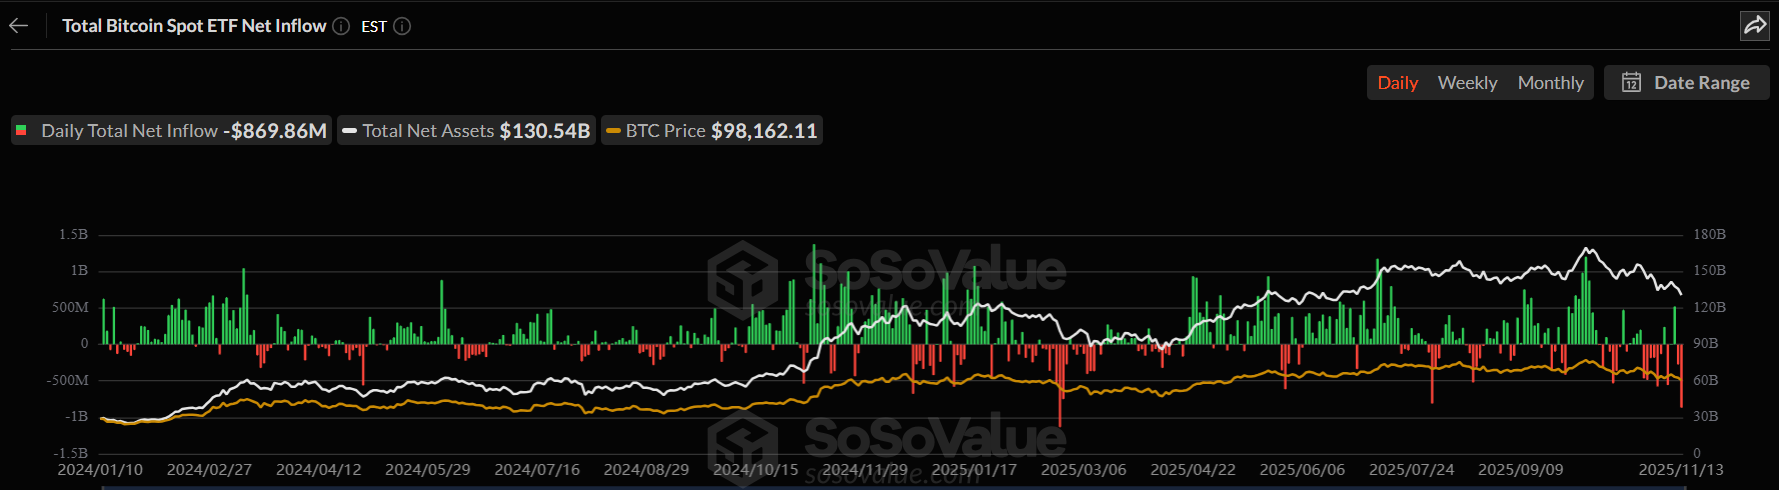
Institutional pressure intensified the selloff, with Bitcoin spot ETFs posting $622.70 million in net outflows so far this week, marking a third consecutive week of withdrawals since the end of October. Moreover, on Thursday, it recorded an outflow of $869.86 million, the highest single-day negative flow since February 25. If this trend persists and intensifies, Bitcoin could face a deeper price correction, reflecting waning institutional confidence.
Bitcoin price drops trigger a wave of liquidation
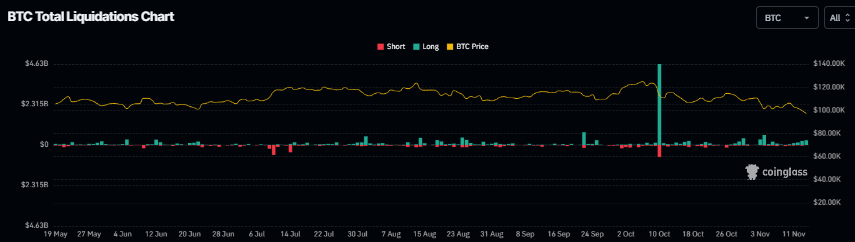
Bitcoin's price correction this week triggered a wave of liquidations for BTC traders, totaling $920 million, of which $749.75 million were long positions, according to Coinglass' chart.
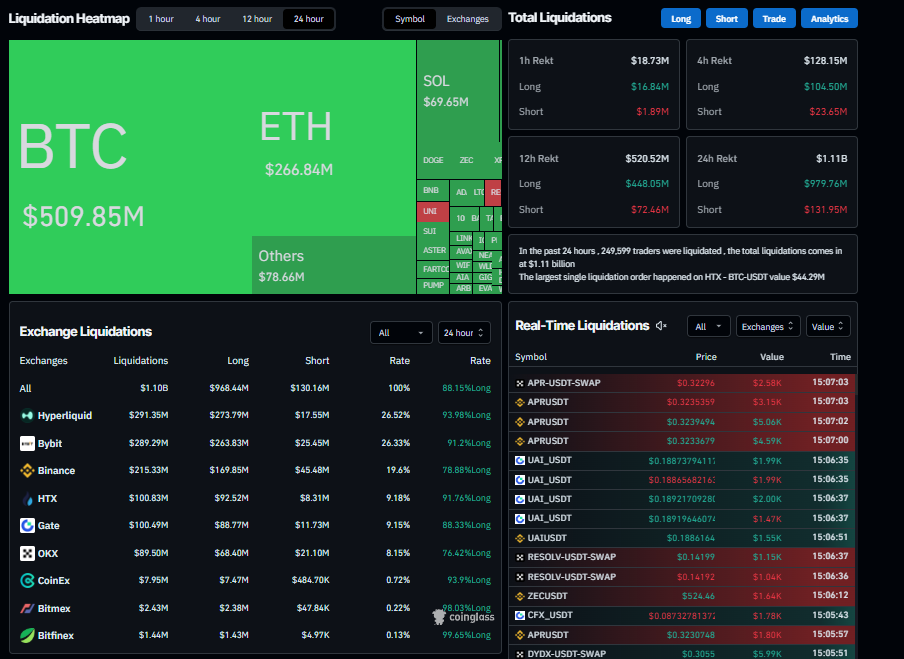
Over the past 24 hours, 249,599 traders were liquidated, resulting in total liquidation of more than $1.11 billion. Over 88% of these positions were long bets, highlighting traders’ overly bullish positioning, while the largest single liquidation occurred on HTX - BTC-USDT valued at $44.29 million.
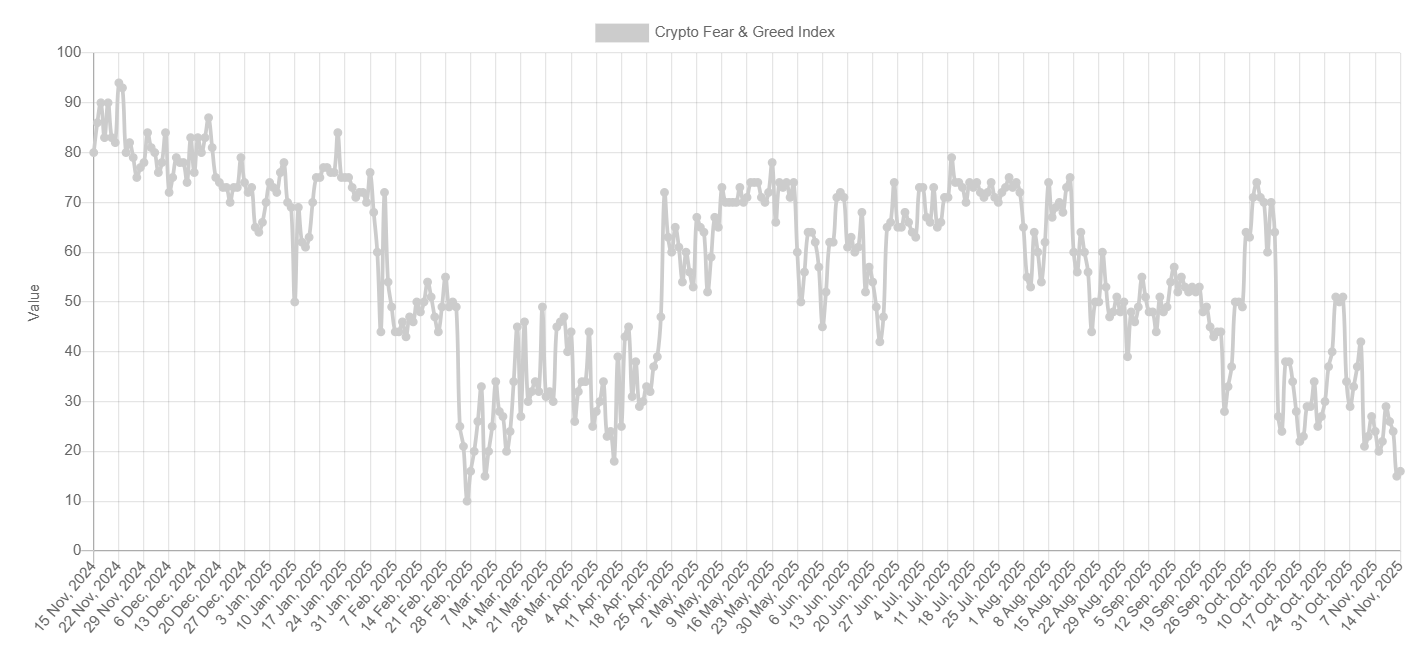
The Fear and Greed Index falls to 16 on Friday, nearing early March lows, indicating a sharp shift toward extreme fear as market participants brace for further downside.
On-chain metrics signal deepening bearish conditions
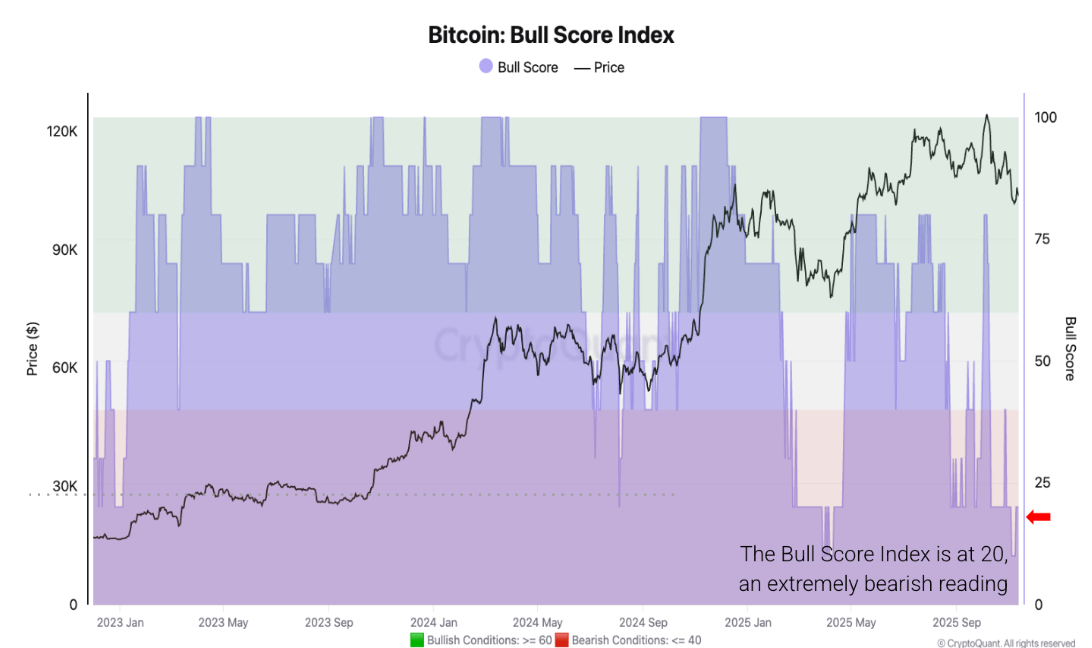
CryptoQuant's weekly report, released on Thursday, highlighted that the Bitcoin market remains in an extremely bearish phase as the price declined towards the $100,000 mark.
The graph below shows that CryptoQuant’s Bull Score Index has declined from 80 on October 6, when Bitcoin reached its record high of $126,000, to 20 on Thursday, as Bitcoin fell below $100,000 for the first time since June 22.
The Index first indicated a bearish phase on October 10, when Bitcoin closed at $113,000.Three main factors have driven the shift to bearish conditions:
- Price lost upward momentum after the October 10 “Big Liquidation” event (momentum metrics turned bearish).
- Spot demand contracted starting October 8.
- Stablecoin liquidity growth slowed down and failed to keep its upward trend.
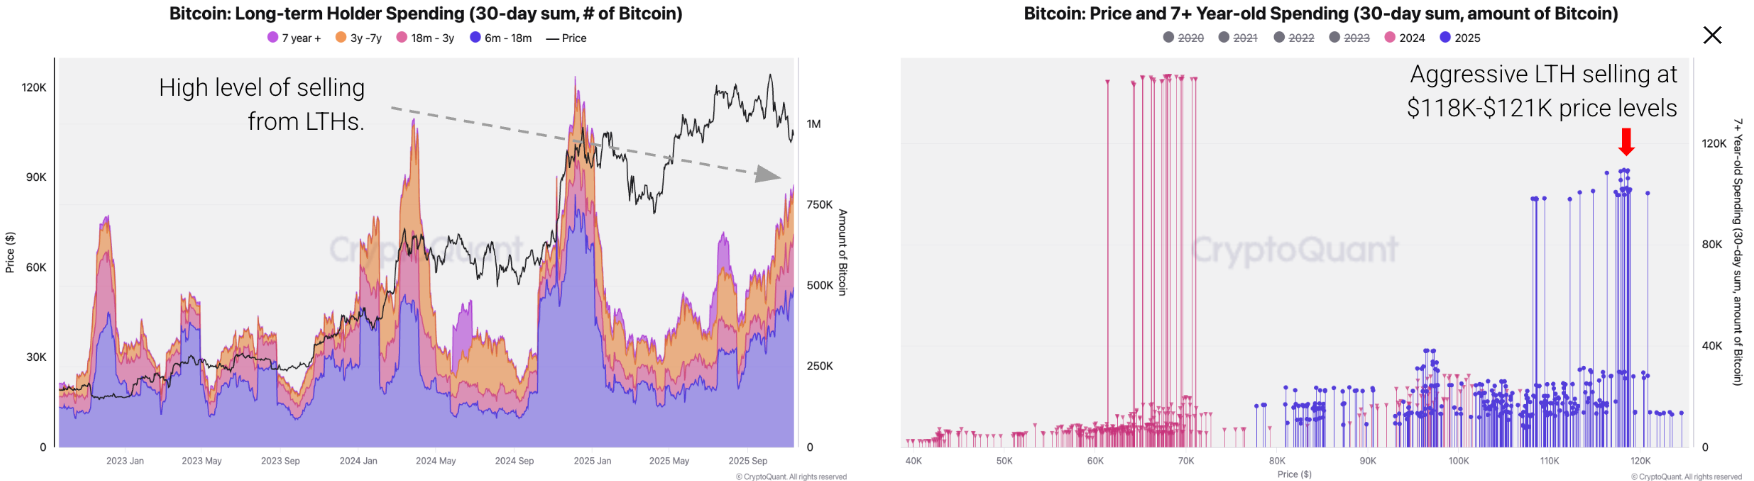
Moreover, the Long-term holders (LTHs) have sold a total of 815,000 BTC in the last 30 days, the highest level since January 2024, adding downward pressure to the price. This selling has come at a time when spot demand weakened/contracted as seen in net outflows from Bitcoin ETFs, a negative Coinbase price premium, and a contraction in apparent demand. In previous episodes of high LTHs sales, demand was strong enough to absorb this supply at higher prices, but this is not the case currently. LTHs sold aggressively at the $118,000 and $121,000 price zones.
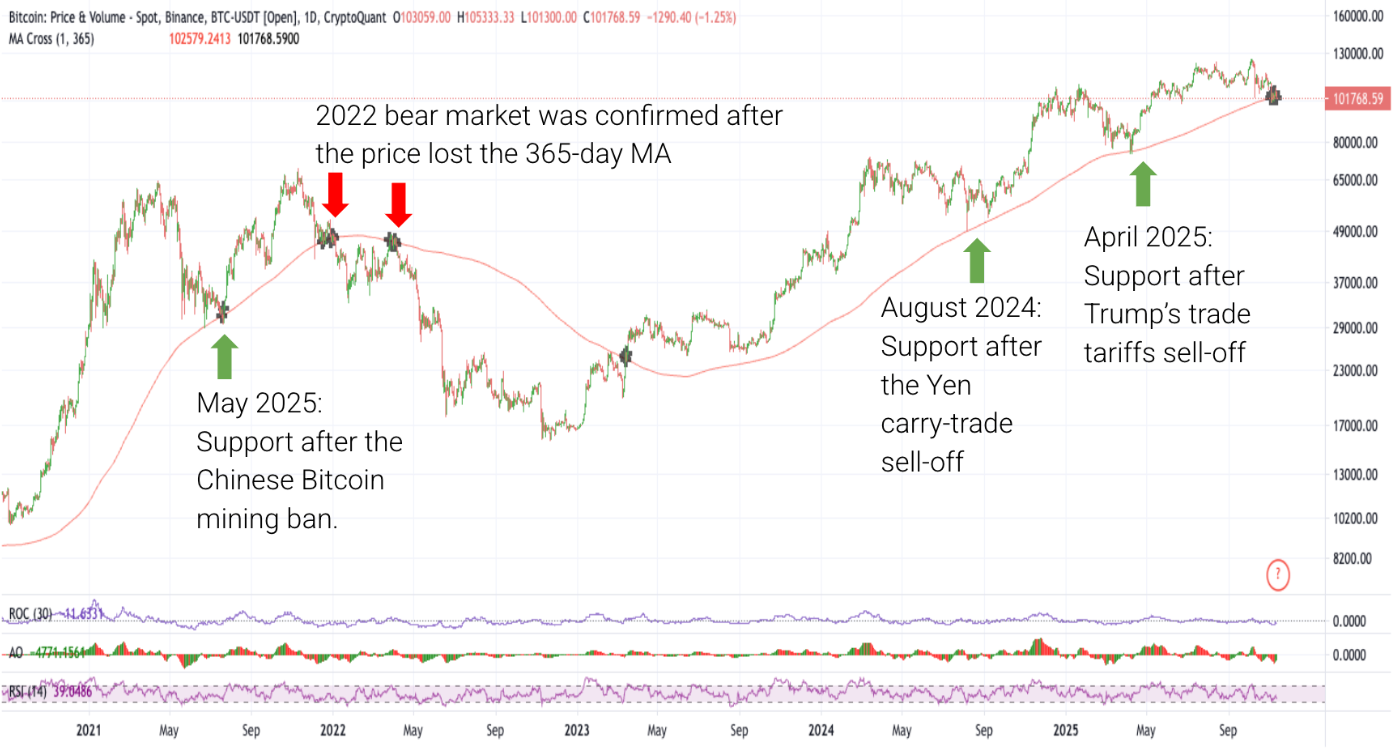
The report concluded that the 365-day Moving Average (MA) around $102,000 is the key technical and psychological support level to watch, as it has acted as the support level so far this bull cycle (green arrows in the chart below), and was one of the last signals triggered as the bear market began in December 2021-January 2022. Failure to reclaim the 365-day MA may accelerate a deeper correction. Notably, Bitcoin has closed below the 365-day MA on several occasions during the current period, a phenomenon that has not occurred previously in this bull market. If enough selling pressure emerges, the next price supports would be the 2x Metcalfe Network Value band at $91,000 and the Traders’ minimum price band at $72,000.
Is BTC out of the woods, or is this the start of a deeper correction?
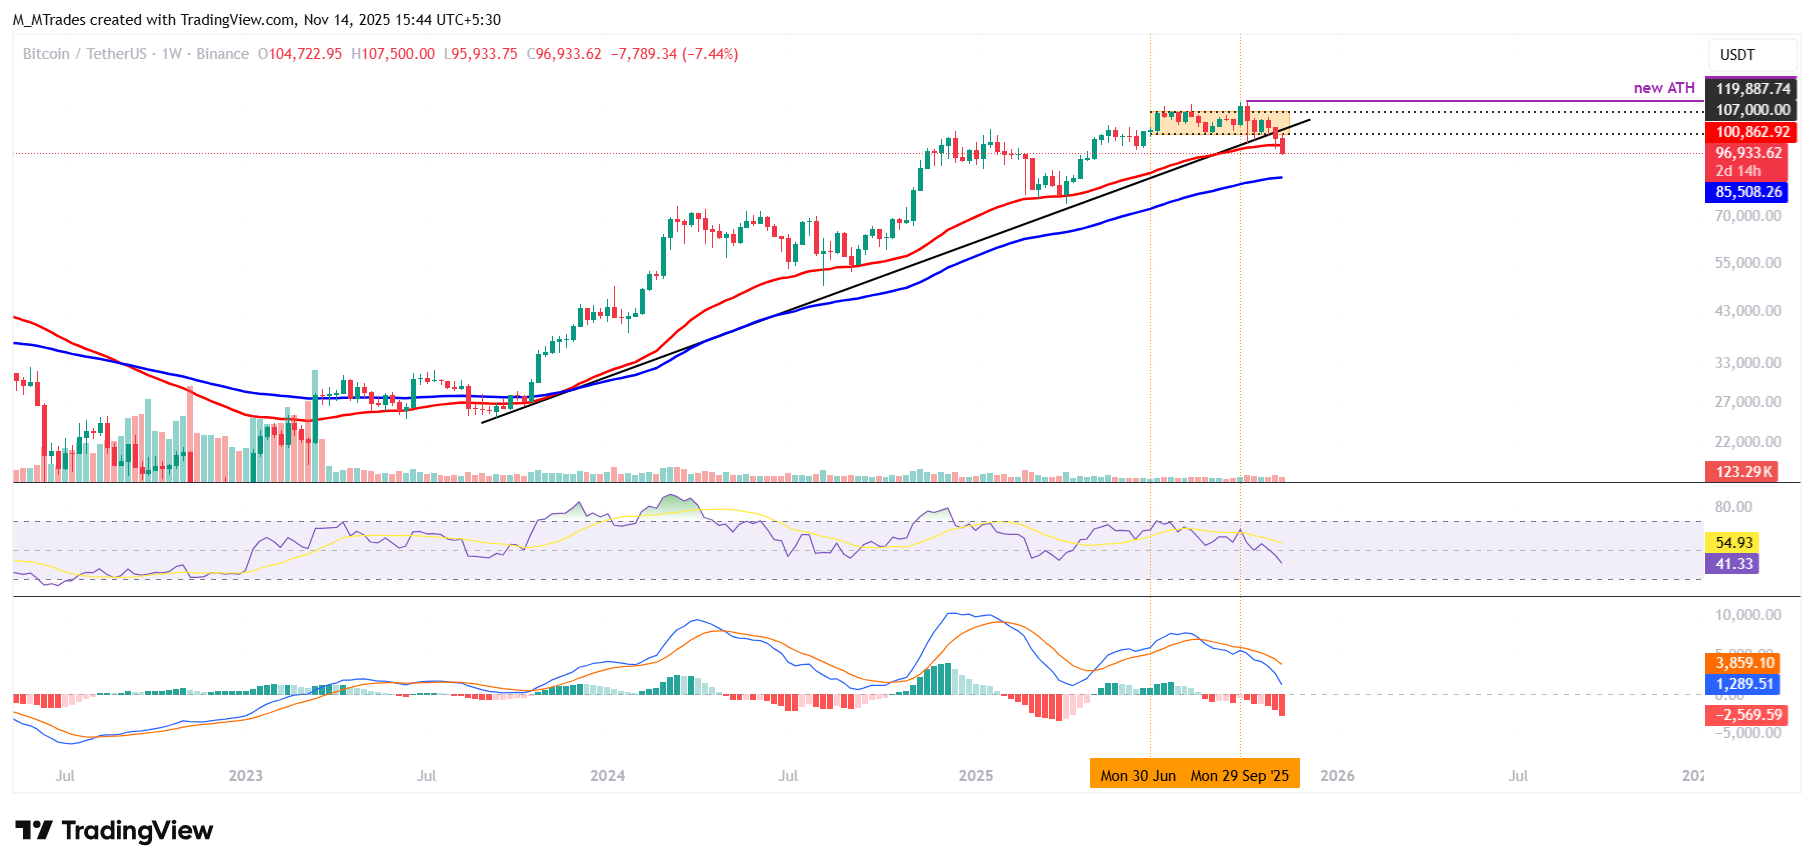
Bitcoin’s weekly chart shows a correction of more than 20% from its all-time high of $126,199 over the past six weeks, with the price hitting a low of $95,933 on Friday and trading below the 50-week Exponential Moving Average (EMA) around $100,862.
Historically, the 50-week EMA has acted as a key support for BTC. If the level is breached, BTC could extend the correction toward the 100-week EMA at $85,508.
The Relative Strength Index (RSI) on the weekly chart is 41, declining below its neutral level of 50, suggesting bearish momentum is gaining traction. Additionally, the Moving Average Convergence Divergence (MACD) indicator showed a bearish crossover that remains intact, with rising red histogram bars below the zero level signaling continuation of the bearish trend.
On the daily chart, Bitcoin price faced rejection at the 38.2% Fibonacci retracement level at $106,453 (drawn from the April 7 low of $74,508 to the all-time high of $126,299 set on October 6) on Monday and declined nearly 6% by Thursday. At the time of writing on Friday, BTC is trading down around $96,900.
If BTC continues its correction and closes below the daily support at $97,460, it could extend the decline toward the 61.8% Fibonacci retracement level at $94,253.
The RSI on the daily chart reads 32, nearing its oversold territory, indicating strong bearish momentum. The MACD also showed a bearish crossover, signaling a sell and further supporting the bearish view.
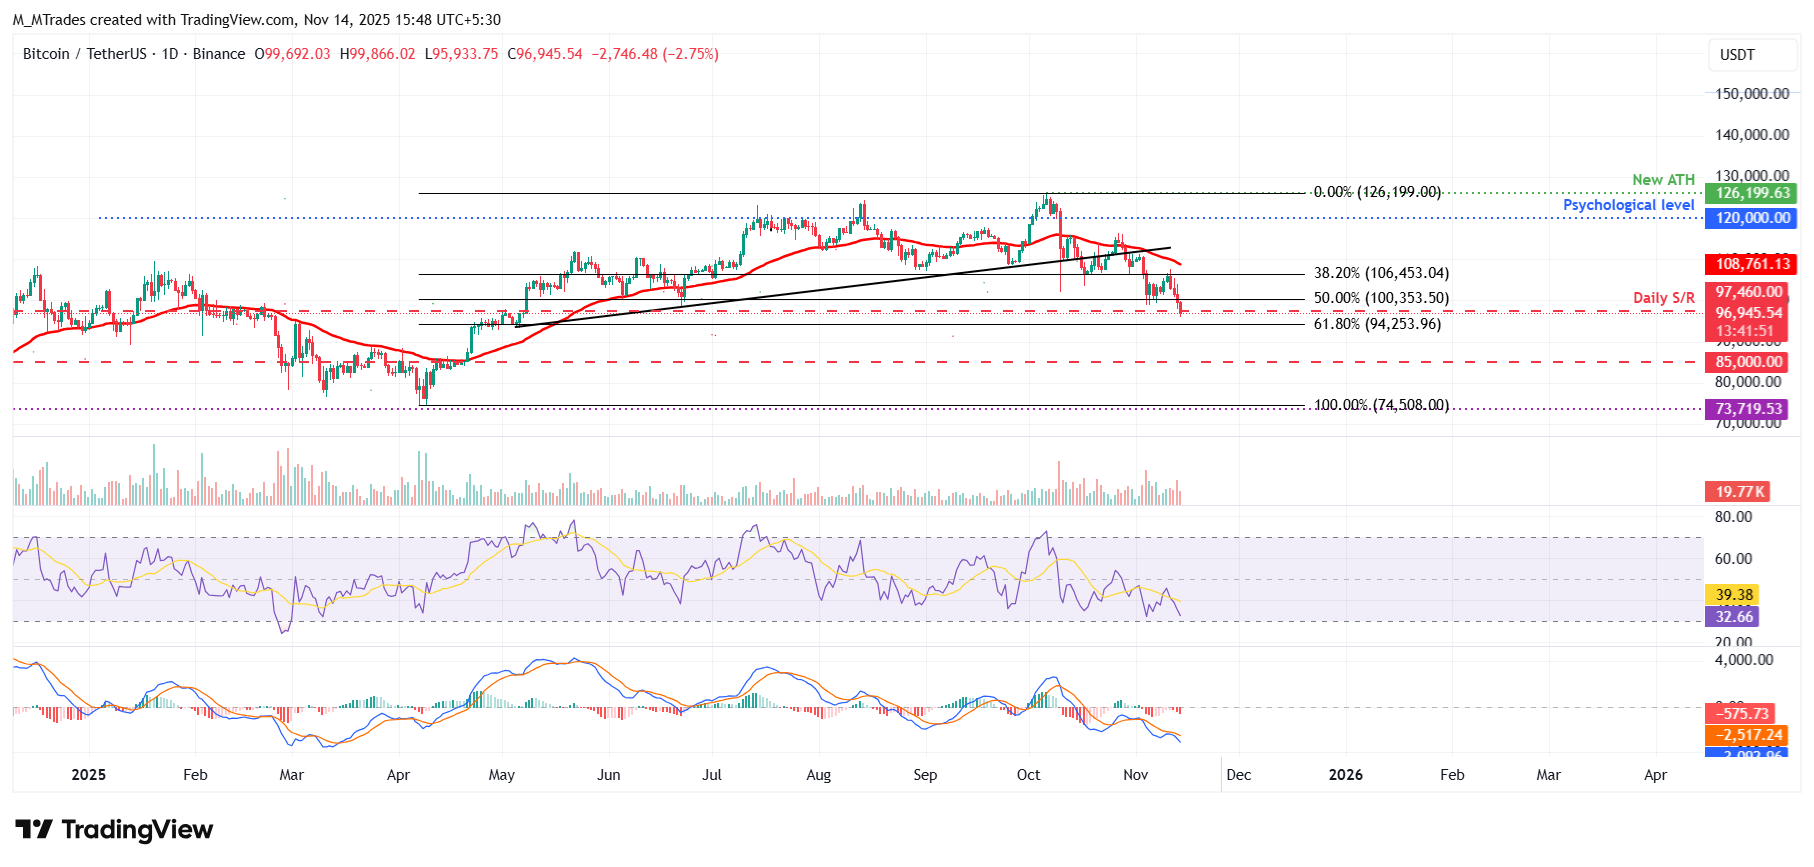
On the other hand, if BTC recovers, it could extend the recovery toward the 38.2% Fibonacci retracement at $106,453.
Bitcoin, altcoins, stablecoins FAQs
Bitcoin is the largest cryptocurrency by market capitalization, a virtual currency designed to serve as money. This form of payment cannot be controlled by any one person, group, or entity, which eliminates the need for third-party participation during financial transactions.
Altcoins are any cryptocurrency apart from Bitcoin, but some also regard Ethereum as a non-altcoin because it is from these two cryptocurrencies that forking happens. If this is true, then Litecoin is the first altcoin, forked from the Bitcoin protocol and, therefore, an “improved” version of it.
Stablecoins are cryptocurrencies designed to have a stable price, with their value backed by a reserve of the asset it represents. To achieve this, the value of any one stablecoin is pegged to a commodity or financial instrument, such as the US Dollar (USD), with its supply regulated by an algorithm or demand. The main goal of stablecoins is to provide an on/off-ramp for investors willing to trade and invest in cryptocurrencies. Stablecoins also allow investors to store value since cryptocurrencies, in general, are subject to volatility.
Bitcoin dominance is the ratio of Bitcoin's market capitalization to the total market capitalization of all cryptocurrencies combined. It provides a clear picture of Bitcoin’s interest among investors. A high BTC dominance typically happens before and during a bull run, in which investors resort to investing in relatively stable and high market capitalization cryptocurrency like Bitcoin. A drop in BTC dominance usually means that investors are moving their capital and/or profits to altcoins in a quest for higher returns, which usually triggers an explosion of altcoin rallies.
Recommended Articles


