


Algorand Price Forecast: Bearish outlook builds as recovery momentum cools
- Algorand extends losses on Tuesday as buying pressure cools after last week’s recovery.
- Derivatives data signal waning bullish sentiment among traders, anticipating further downside.
- The technical outlook for ALGO highlights a short-term corrective phase targeting the 100-day EMA.
Algorand (ALGO) is down 5% at press time on Tuesday, extending the 2% drop the previous day. The tokenization-focused layer-1 token is losing retail demand so far this week as the derivatives data signal reduced active long positions. Technically, a cluster of resistance-turned-support levels guards the downside risk in Algorand.
Algorand’s recovery run over post-quantum readiness wanes
Algorand surged 50% last week on the release of Google Quantum AI's whitepaper, which positioned its blockchain security as ready for future migration. However, the derivatives data shows the demand is waning this week.
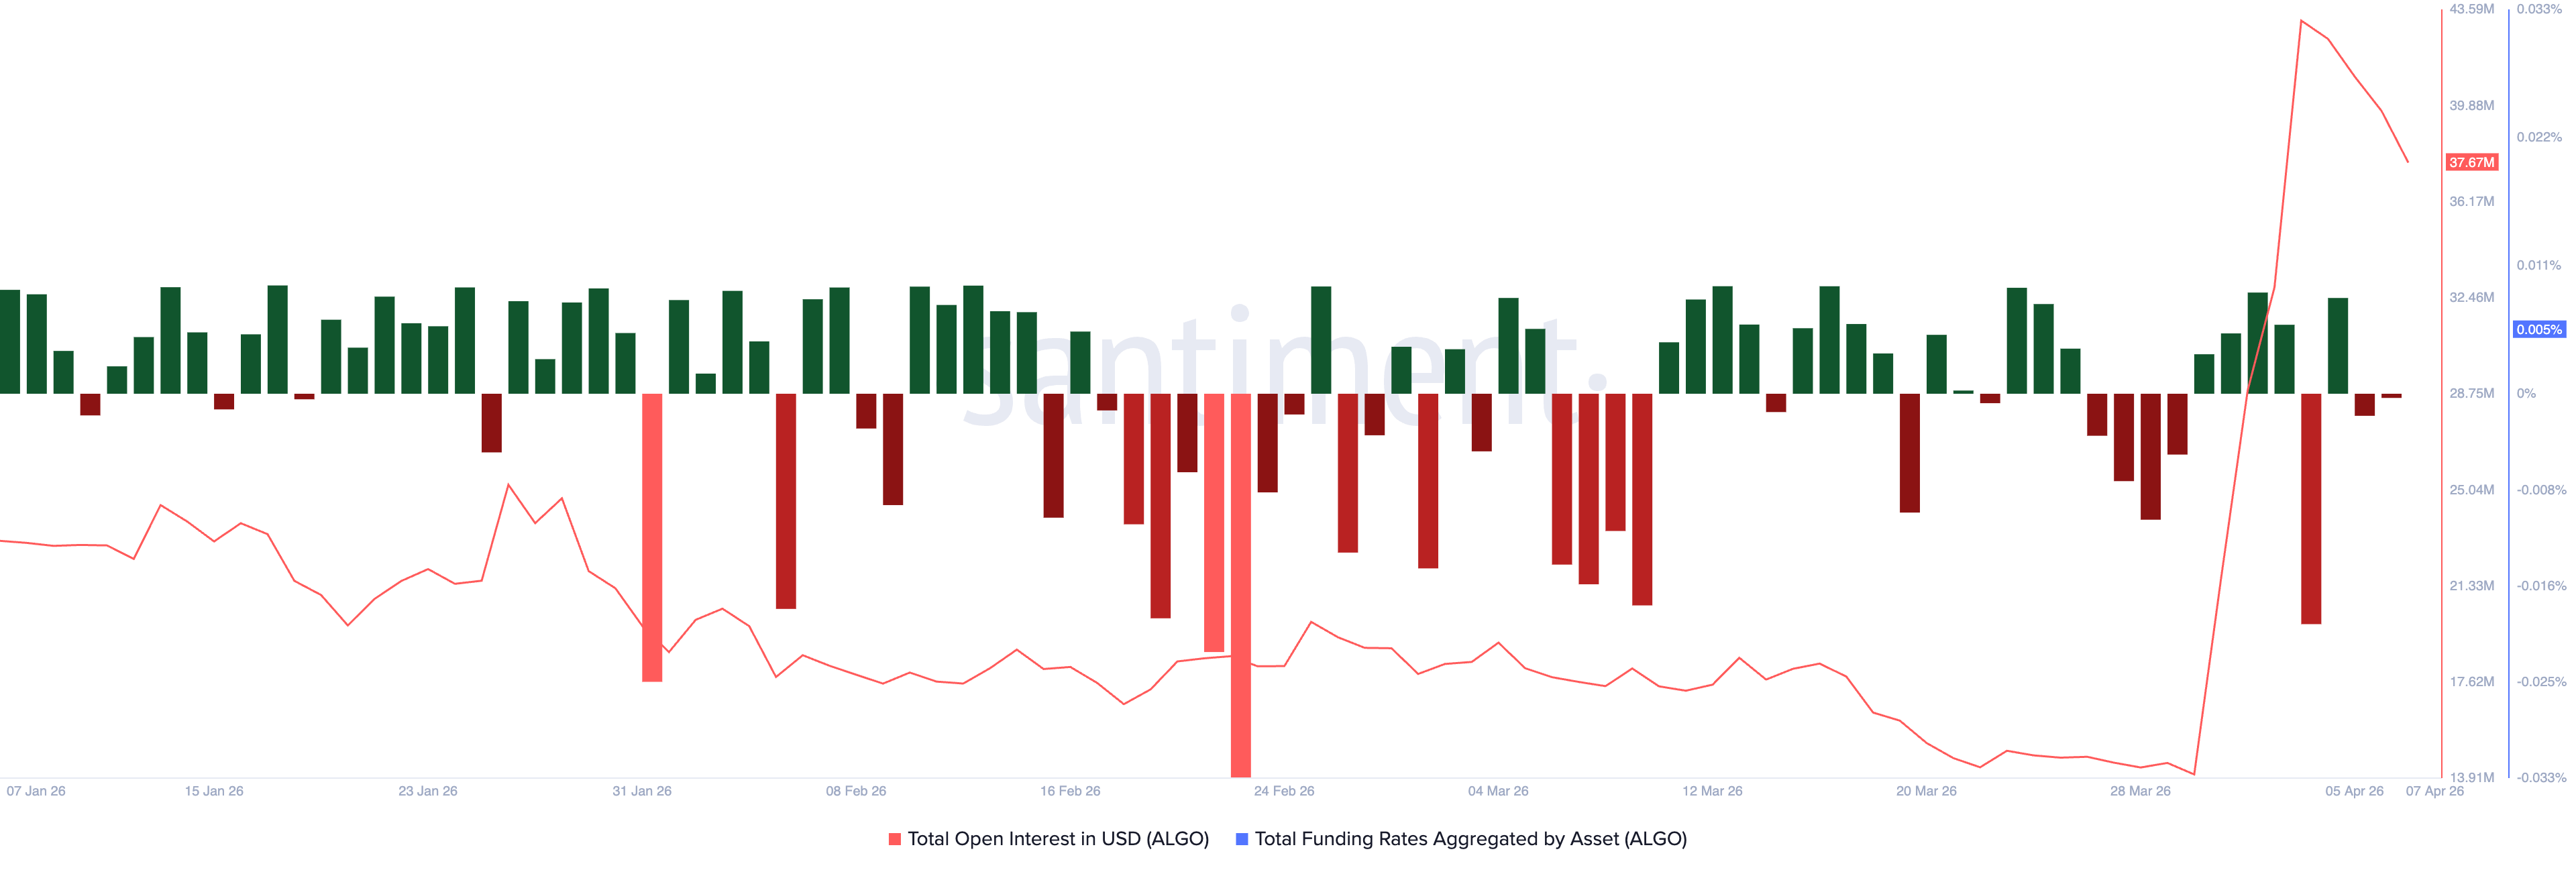
According to Santiment, the ALGO futures Open Interest (OI) is down to $37.67 million, from the $43.13 million peak on Friday. A reduction in OI signals reduced existing active contracts as traders either limit leverage exposure or liquidate positions.
Additionally, the funding rate has flipped negative on Tuesday, from 0.0081% on Saturday, suggesting that traders are inclined to hold short positions.
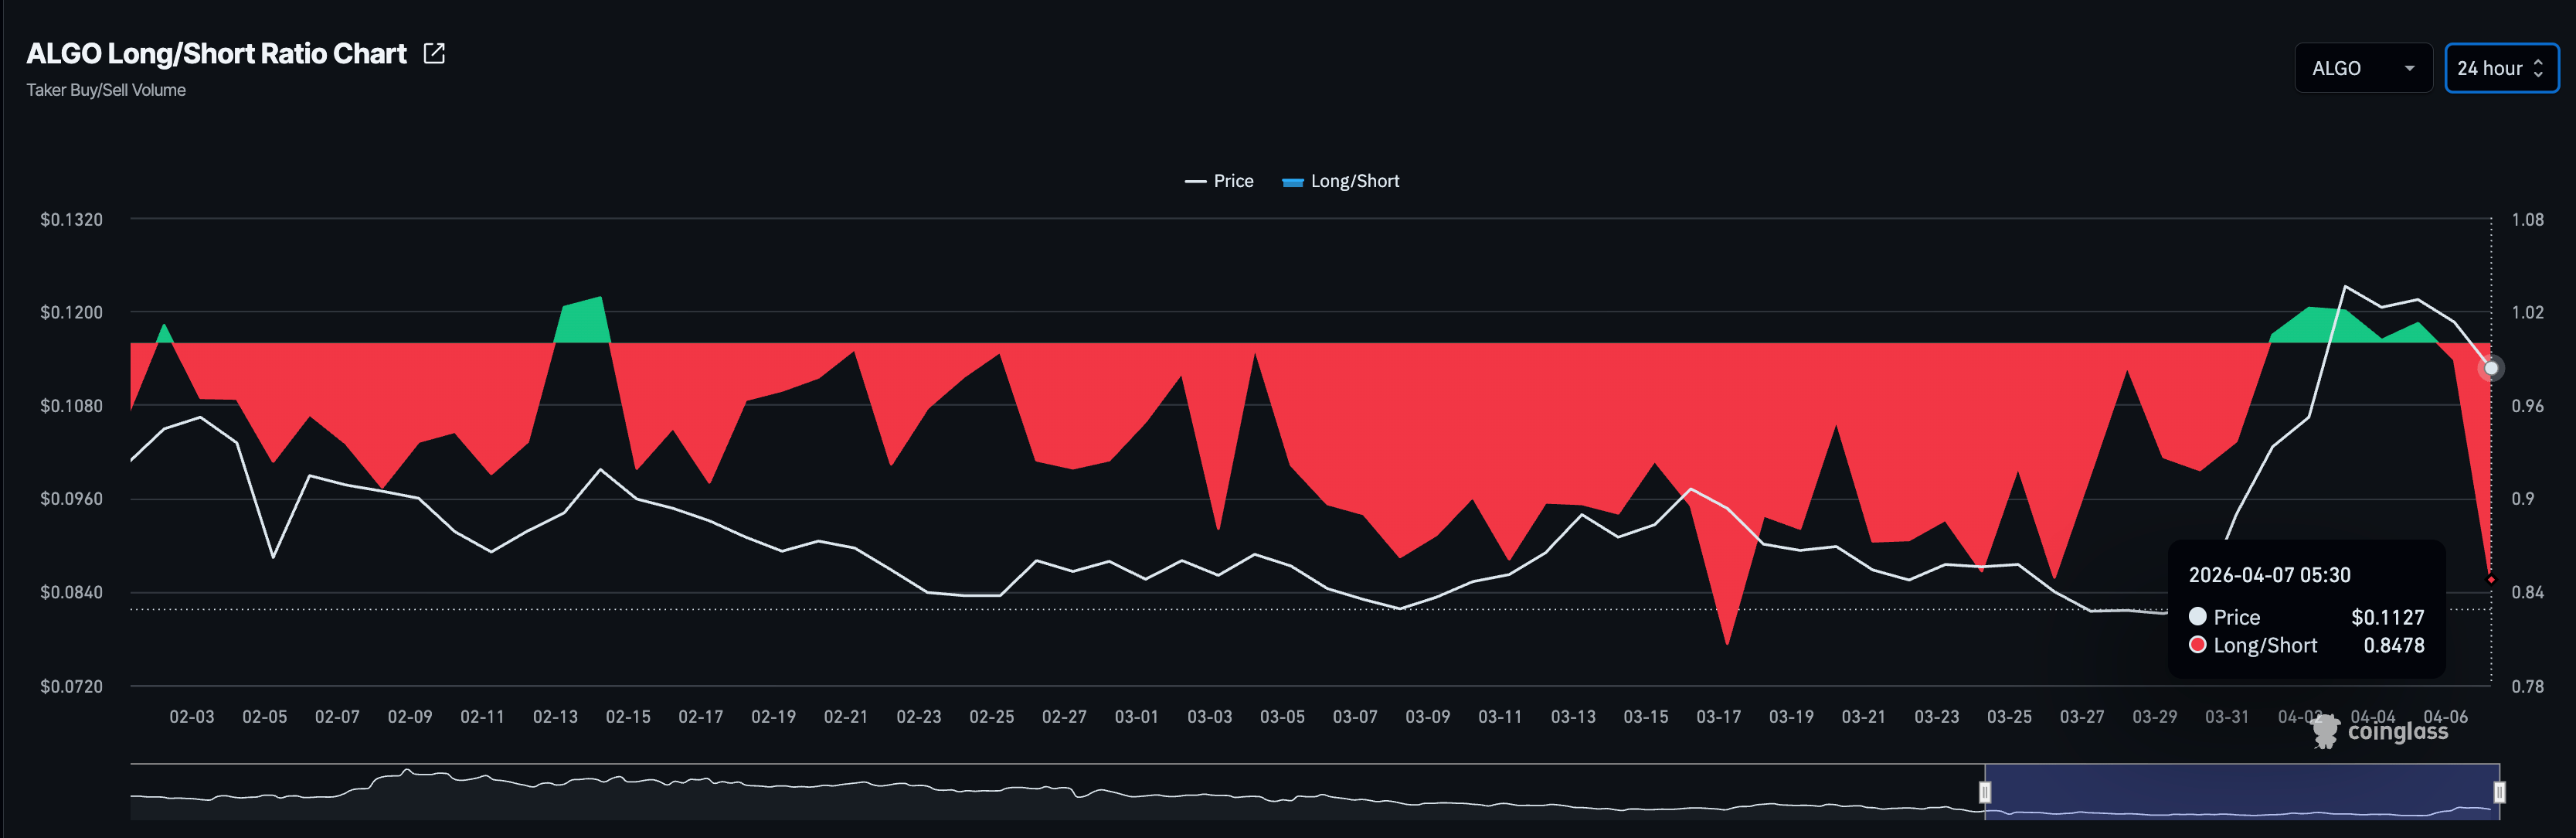
Corroborating the sell-side dominance, CoinGlass data shows the long-to-short ratio in ALGO futures has dipped to 0.8478, confirming a greater number of active short positions.
Algorand's reversal to put freshly turned support levels to the test
Algorand trades below $0.1200 at press time on Tuesday with a near-term mixed bias after the ALGO rebounded sharply from the $0.0810 area and reclaimed the 50% retracement at $0.1083, measured from the $0.1456 high to the $0.0807 low.
Algorand remains below the 200-day Exponential Moving Average (EMA), while the 50- and 100-day EMAs on the downside frame a strong recovery within a broader downtrend.
The Moving Average Convergence Divergence (MACD) line holds above its signal line and the zero line on the daily chart, with consecutive positive histogram bars, suggesting strengthening bullish momentum. At the same time, the Relative Strength Index (RSI) at 63 suggests firm upside pressure without reaching overbought conditions.
On the downside, initial support appears at 50% retracement level at $0.1083, followed by the 100-day EMA at $0.1072, forming a key demand zone. A break below this zone would weaken the nascent bullish bias and open a deeper pullback toward the 50-day EMA at $0.0975, risking a drop below the $0.1000 psychological level.
Immediate resistance is at the 78.6% Fibonacci retracement at $0.1283. A daily close above it would expose the 200-day EMA at $0.1313.
(The technical analysis of this story was written with the help of an AI tool.)
Recommended Articles


