


The $55 Oil Trade Is Still on the Table, but Brent’s Chart Has Conditions
The oil price surged on April 2 as Brent crude futures reclaimed $106 after briefly dipping below $100 intraday. The move came as markets processed Trump’s prime-time Iran address, which offered no concrete timeline for reopening the Strait of Hormuz despite stating that US forces would “finish the job” within two to three weeks.
Three technical signals are now converging to suggest the rally may be nearing exhaustion. A double top near $119, a bearish developing divergence on the daily chart, and a sudden shift in options positioning all build the case for a potential reversal. The conditions required to trigger that reversal, starting with whether the next candle confirms the divergence and whether the Hormuz situation shifts toward resolution, will determine if the Brent crude rally extends or the $55 oil price prediction scenario activates.
Brent Crude’s Double Top Frames the Entire $55 Thesis
The daily chart shows Brent crude futures testing the $119 zone twice. That double rejection confirms $119 as a structural ceiling for the oil price and establishes the framework for a measured move breakdown.
The neckline of the double top sits at $81. Between the two tops, the oil price corrected 32.01% before recovering, which validates the depth of the pattern. If the neckline breaks with a daily close below $81, the measured move projects a decline of approximately 32% to $55.
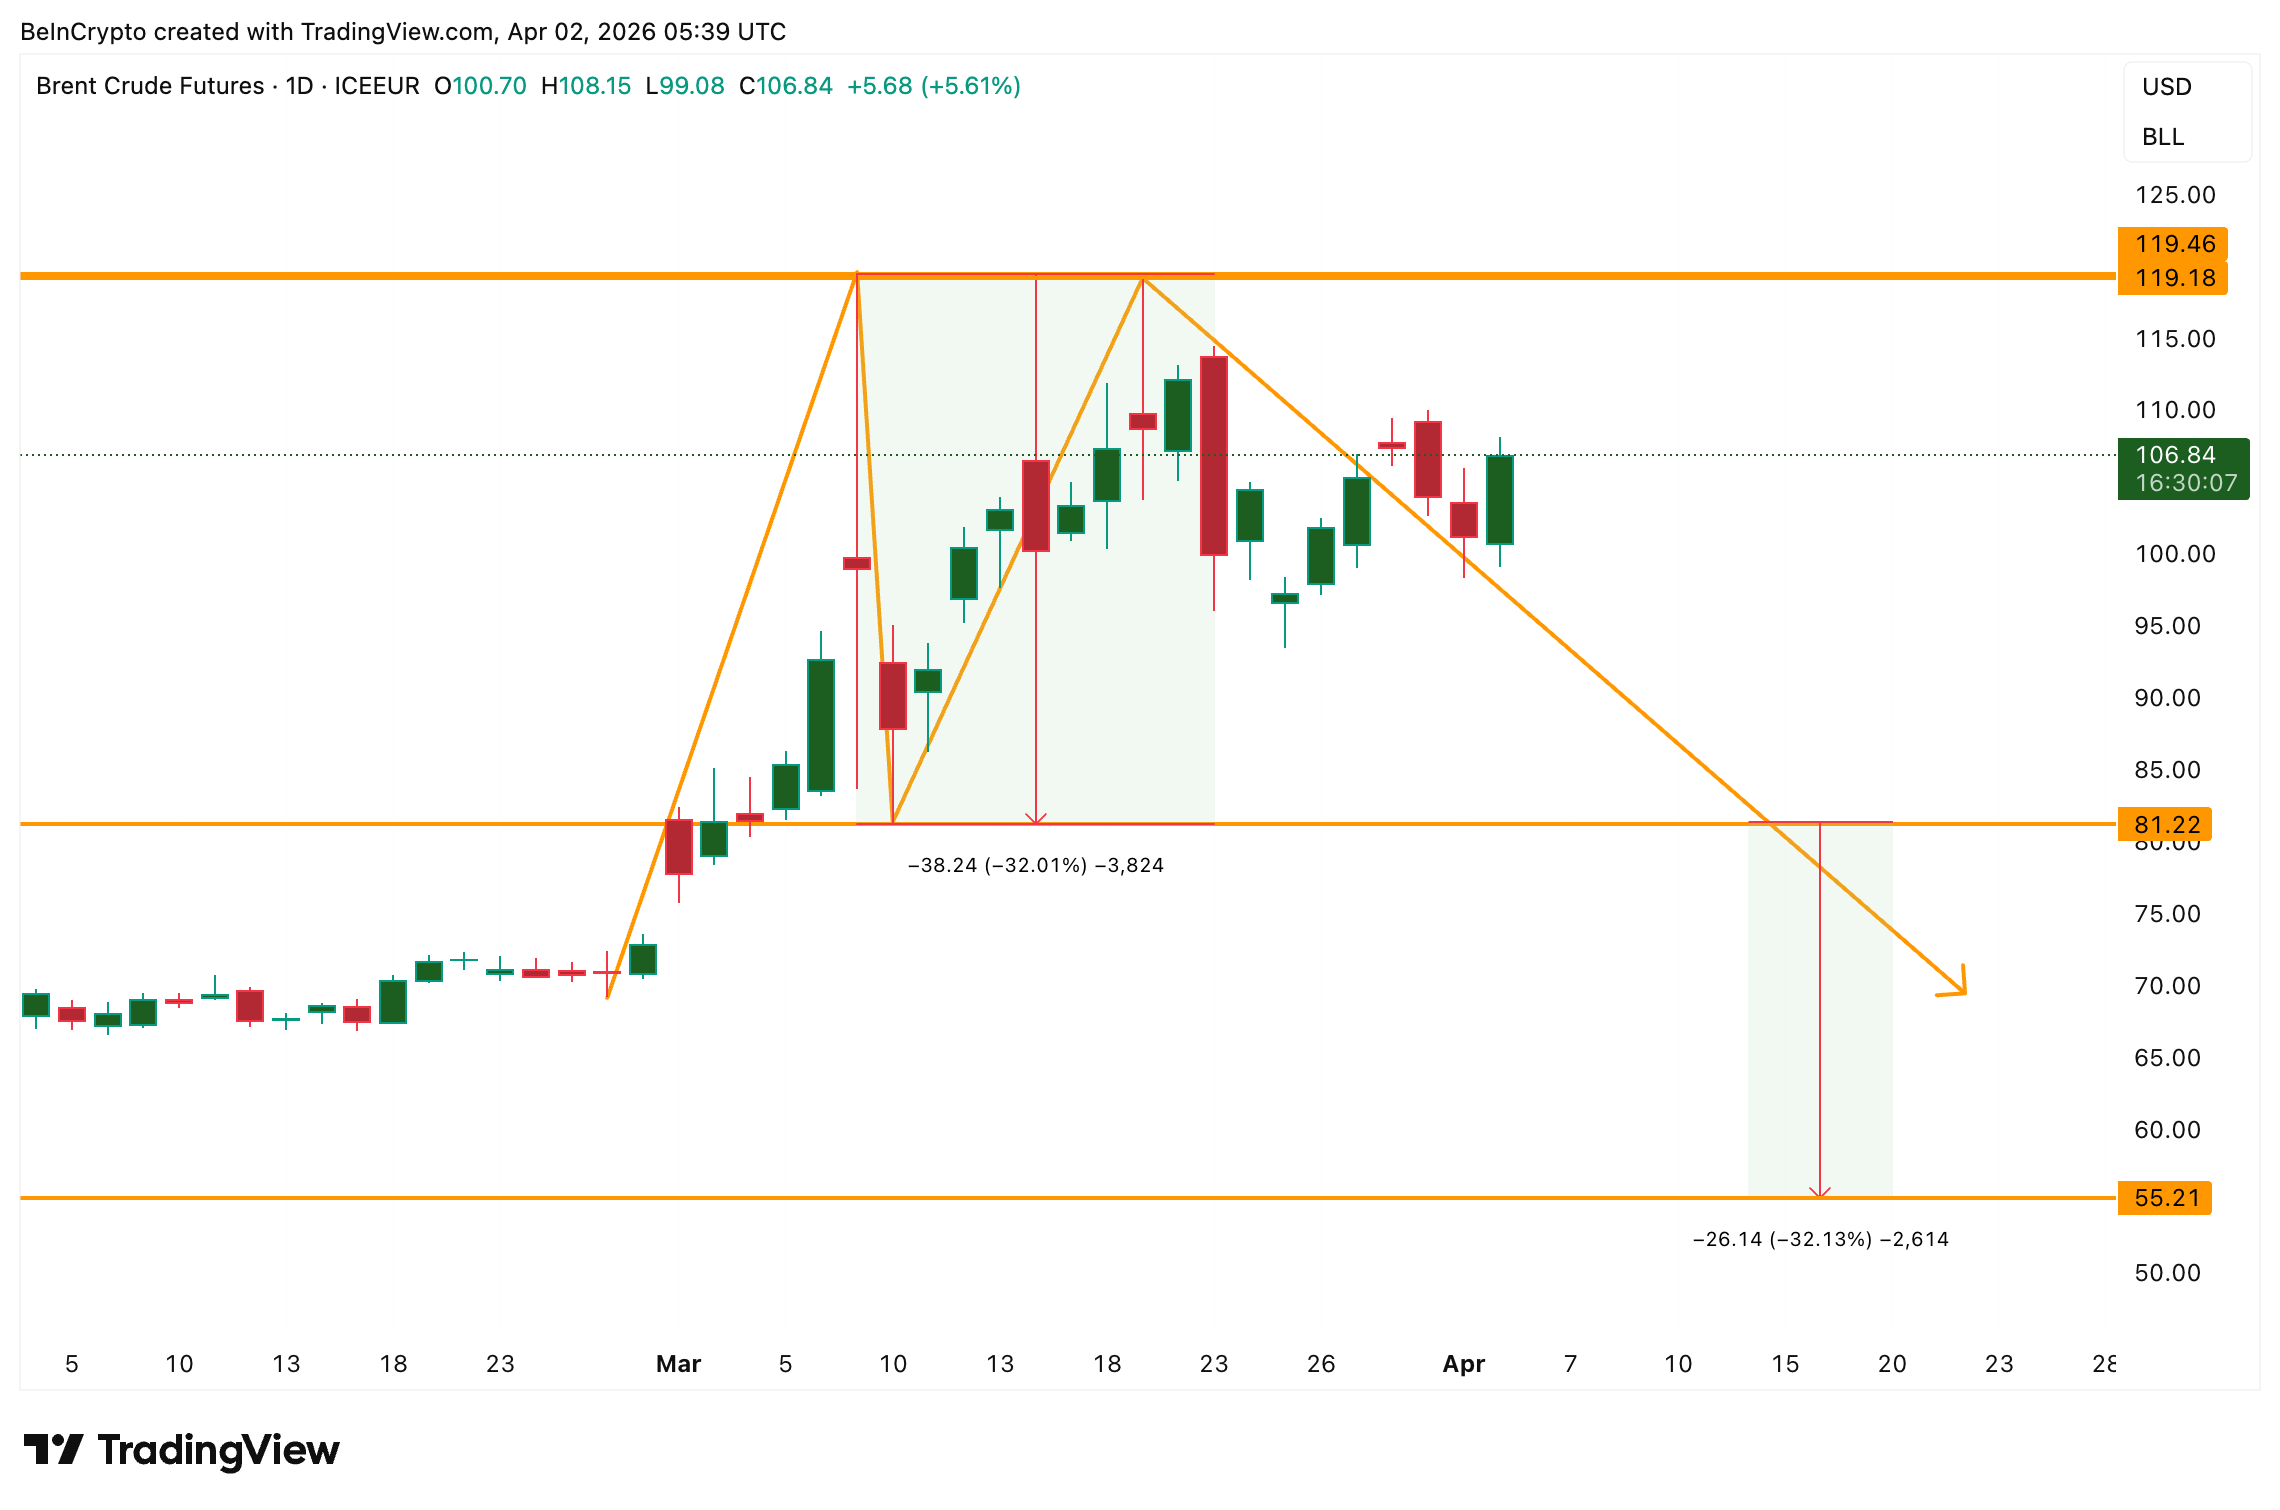 Brent Oil Price Pattern: TradingView
That double top activation remains the first condition for a reversal. But the narrative also extends to other oil markets.
Options Signal Conflict with Physical Market Demand
The second condition involves market positioning. The BNO Brent Oil ETF, the primary US-listed vehicle for Brent crude exposure, shows a sharp shift in how traders are hedging.
On March 30, the put-call volume ratio, which compares bearish put option activity to bullish call option activity, sat at 0.19. By April 1, that ratio had jumped to 0.44 while the open interest ratio remained flat at 0.25.
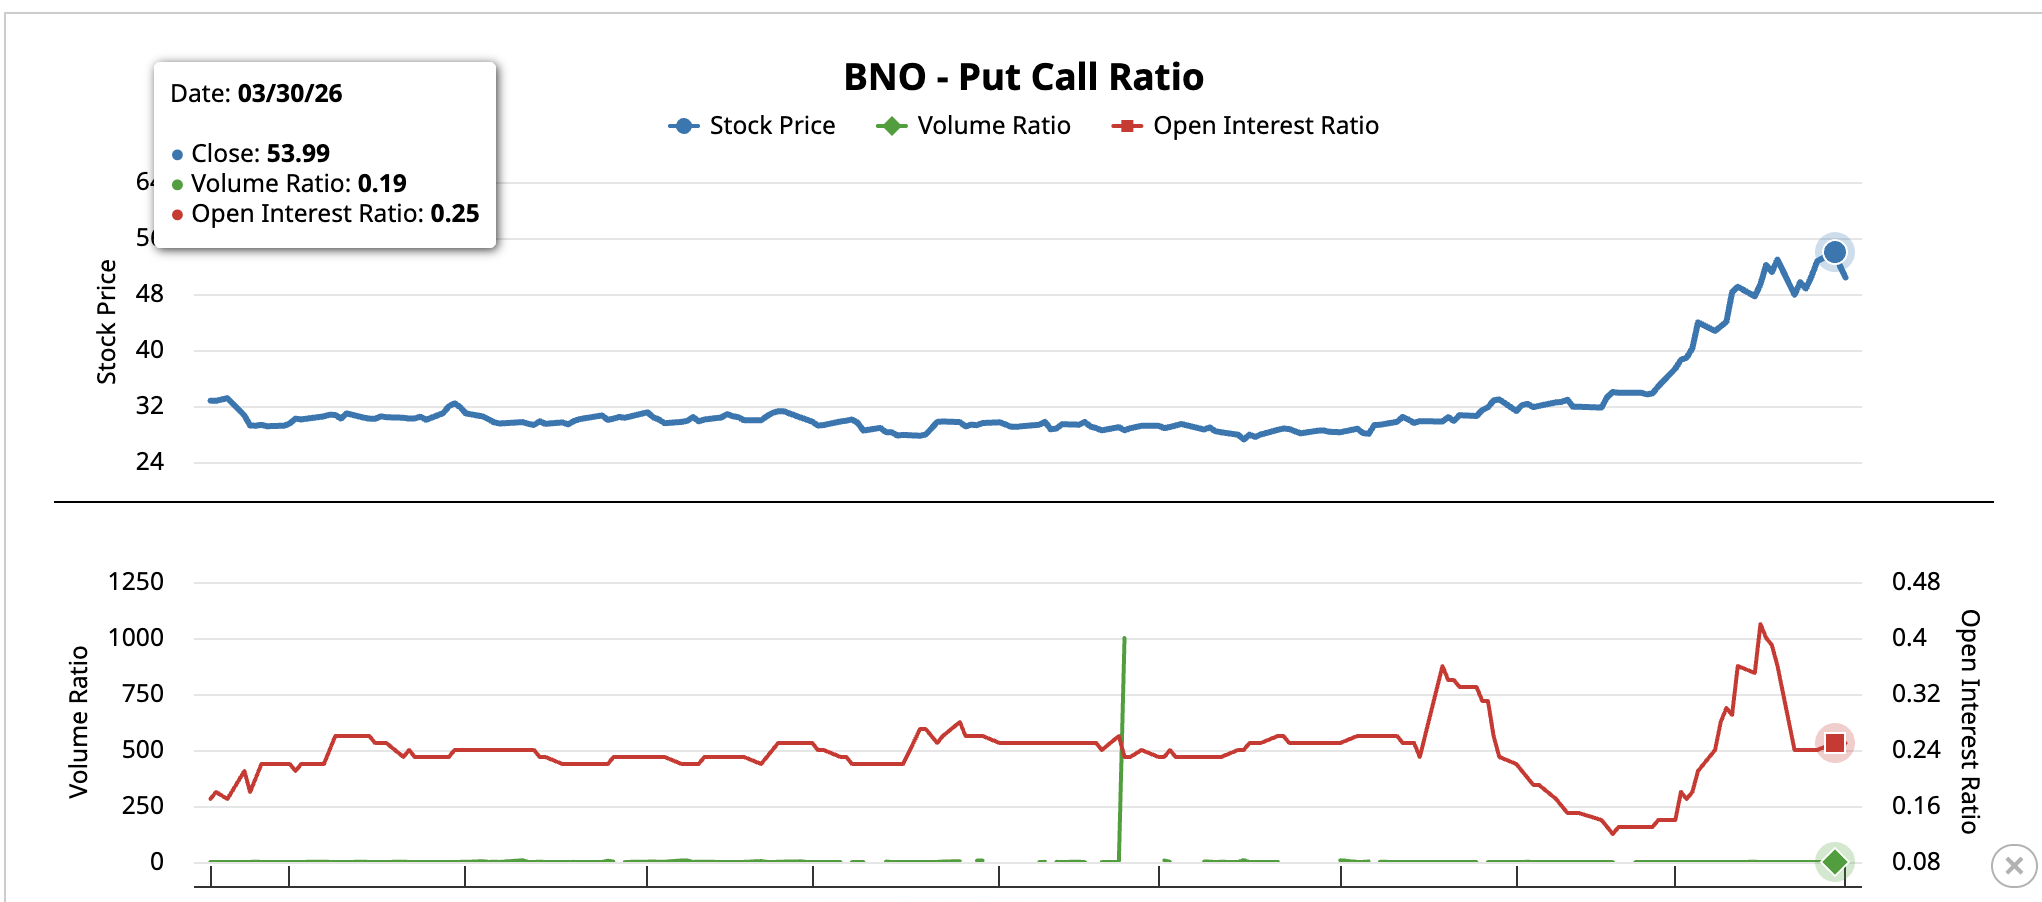 BNO Put-Call Ratio March 30: Barchart
The flat open interest means no significant new long-term positions were opened. The volume spike in puts means traders are buying short-term downside protection.
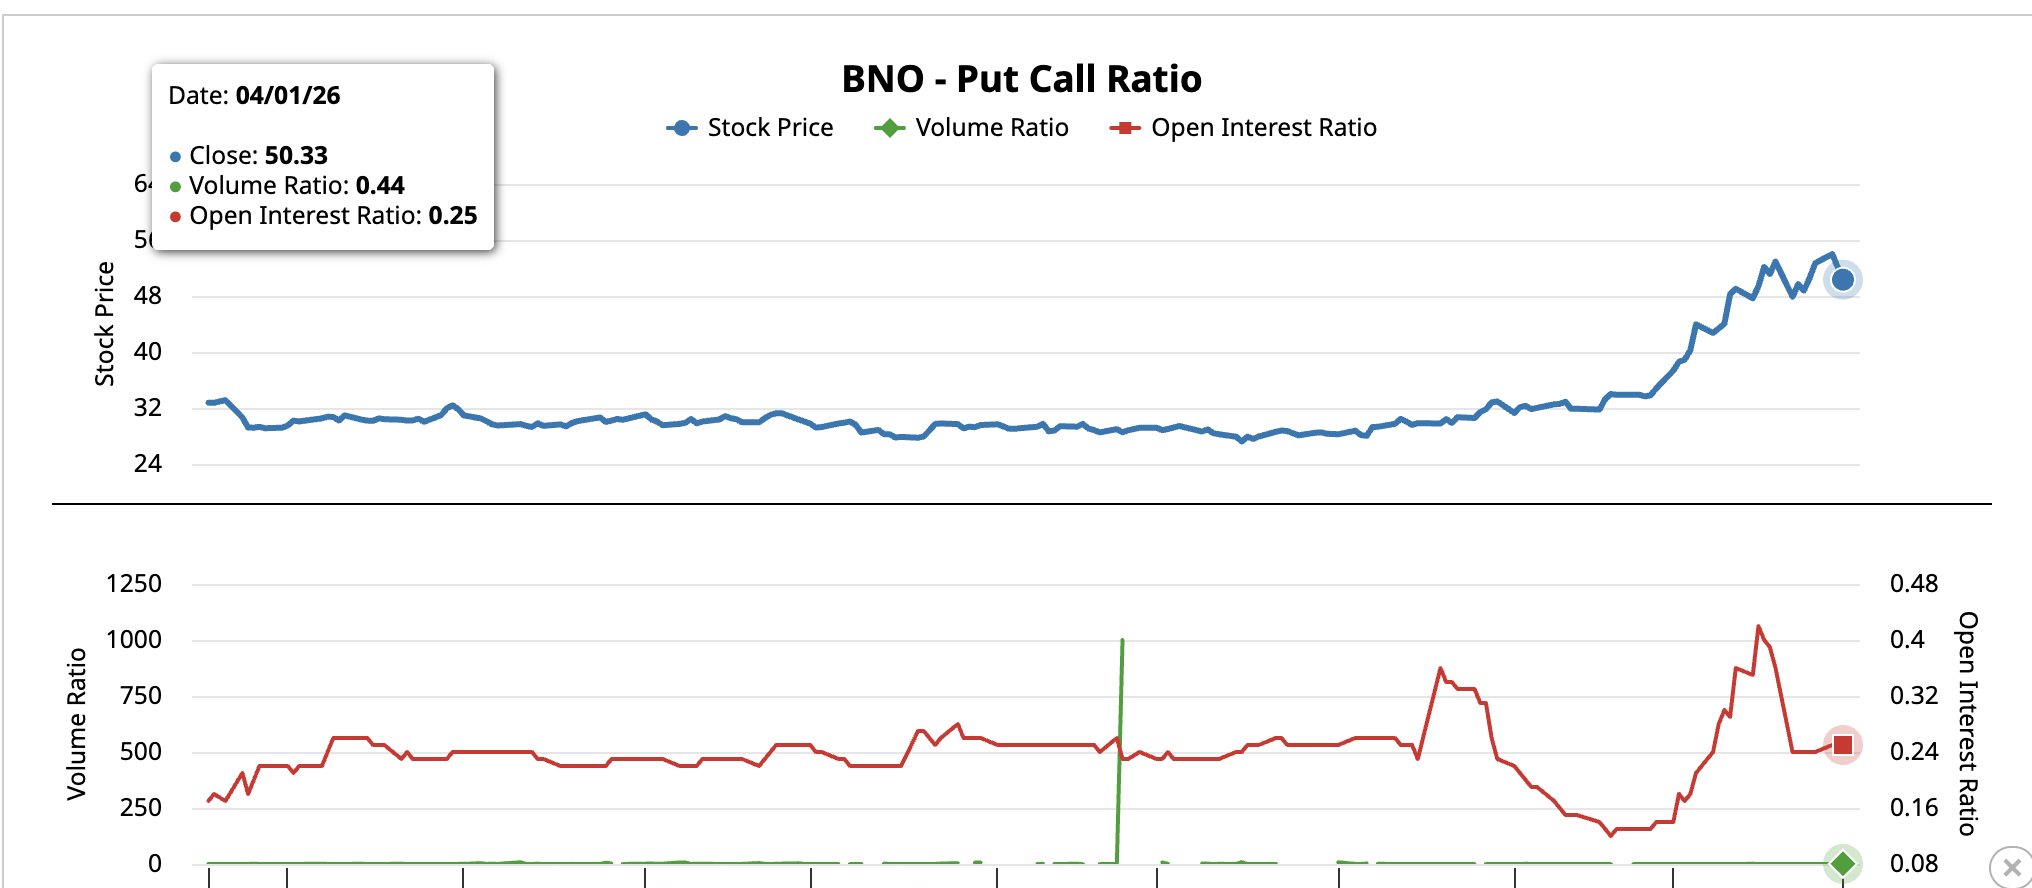 BNO Put-Call Ratio April 1: Barchart
The crude oil futures curve tells a conflicting story. The spread between the front-month and second-month Brent contracts, a measure of near-term supply urgency known as backwardation when positive, surged to $8.43 on April 2. Backwardation this steep means buyers of physical oil are paying a significant premium for immediate delivery because supply cannot meet current demand.
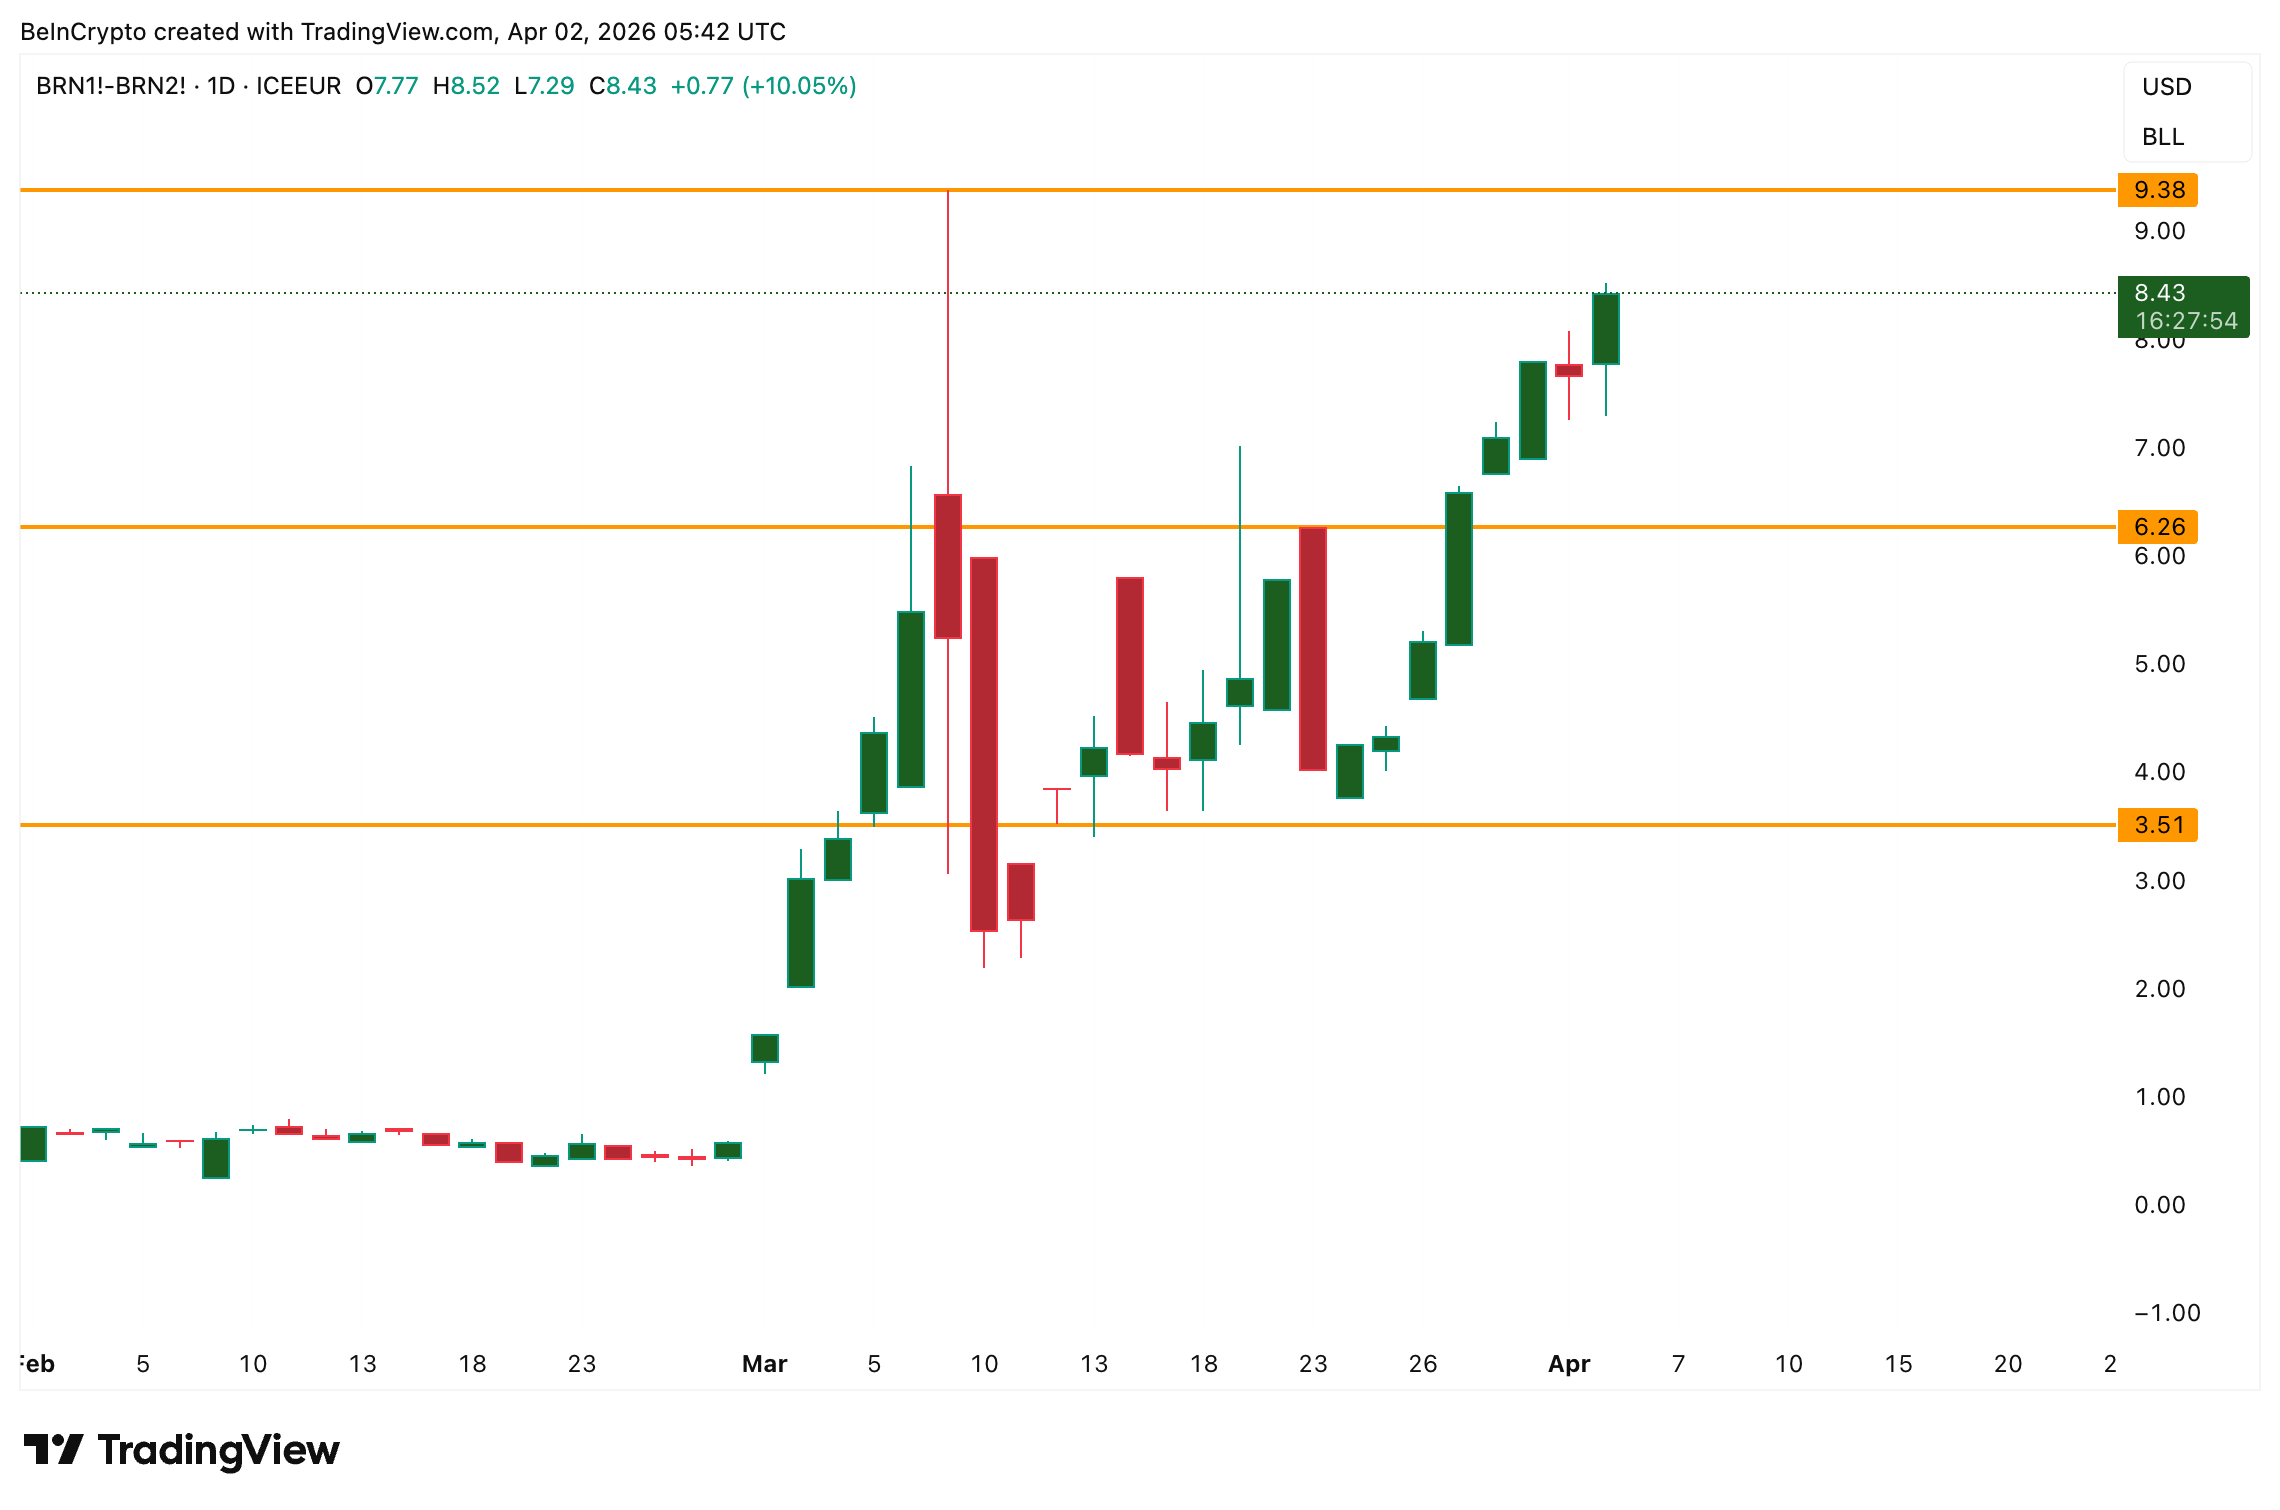 Brent Backwardation Spread: TradingView
The conflict between these two signals defines the current oil price environment. Options traders are hedging for a pullback, but the physical market is signaling that barrels remain scarce. As long as the Strait of Hormuz stays closed and physical supply remains disrupted, backwardation can override the bearish options positioning.
The put-call ratio gains conviction as a reversal signal only if the geopolitical backdrop shifts towards de-escalation. That is the second condition.
Oil Price Levels That Separate $119 Test From a Slide to $55
The oil price analysis now centers on whether $107 holds as a launchpad or fails as resistance. A daily close above $107, the keeps the door open for a third attempt at the $119 double top ceiling. That scenario requires the Hormuz disruption to persist and backwardation to remain elevated.
The Relative Strength Index (RSI), a momentum indicator, however, strengthens the case for exhaustion. Between March 3 and April 2, the oil price is forming a higher high while RSI is working on a lower high. That bearish divergence indicates the rally is losing internal momentum even as prices push higher. Each new high is being driven by thinner conviction than the one before.
For the divergence to activate as a reversal signal, the next daily candle needs to close below the current candle. If it does, the swing is established, and the Brent crude price faces downside pressure toward $100 first.
Failure to hold $107 shifts the focus to $100, the 0.382 level that has acted as both support and resistance during this rally. A break below $100 opens the path to $88, the 0.618 level. Each level below $107 represents a step closer to the neckline at $81, the structural trigger for the full 32% measured move to $55.
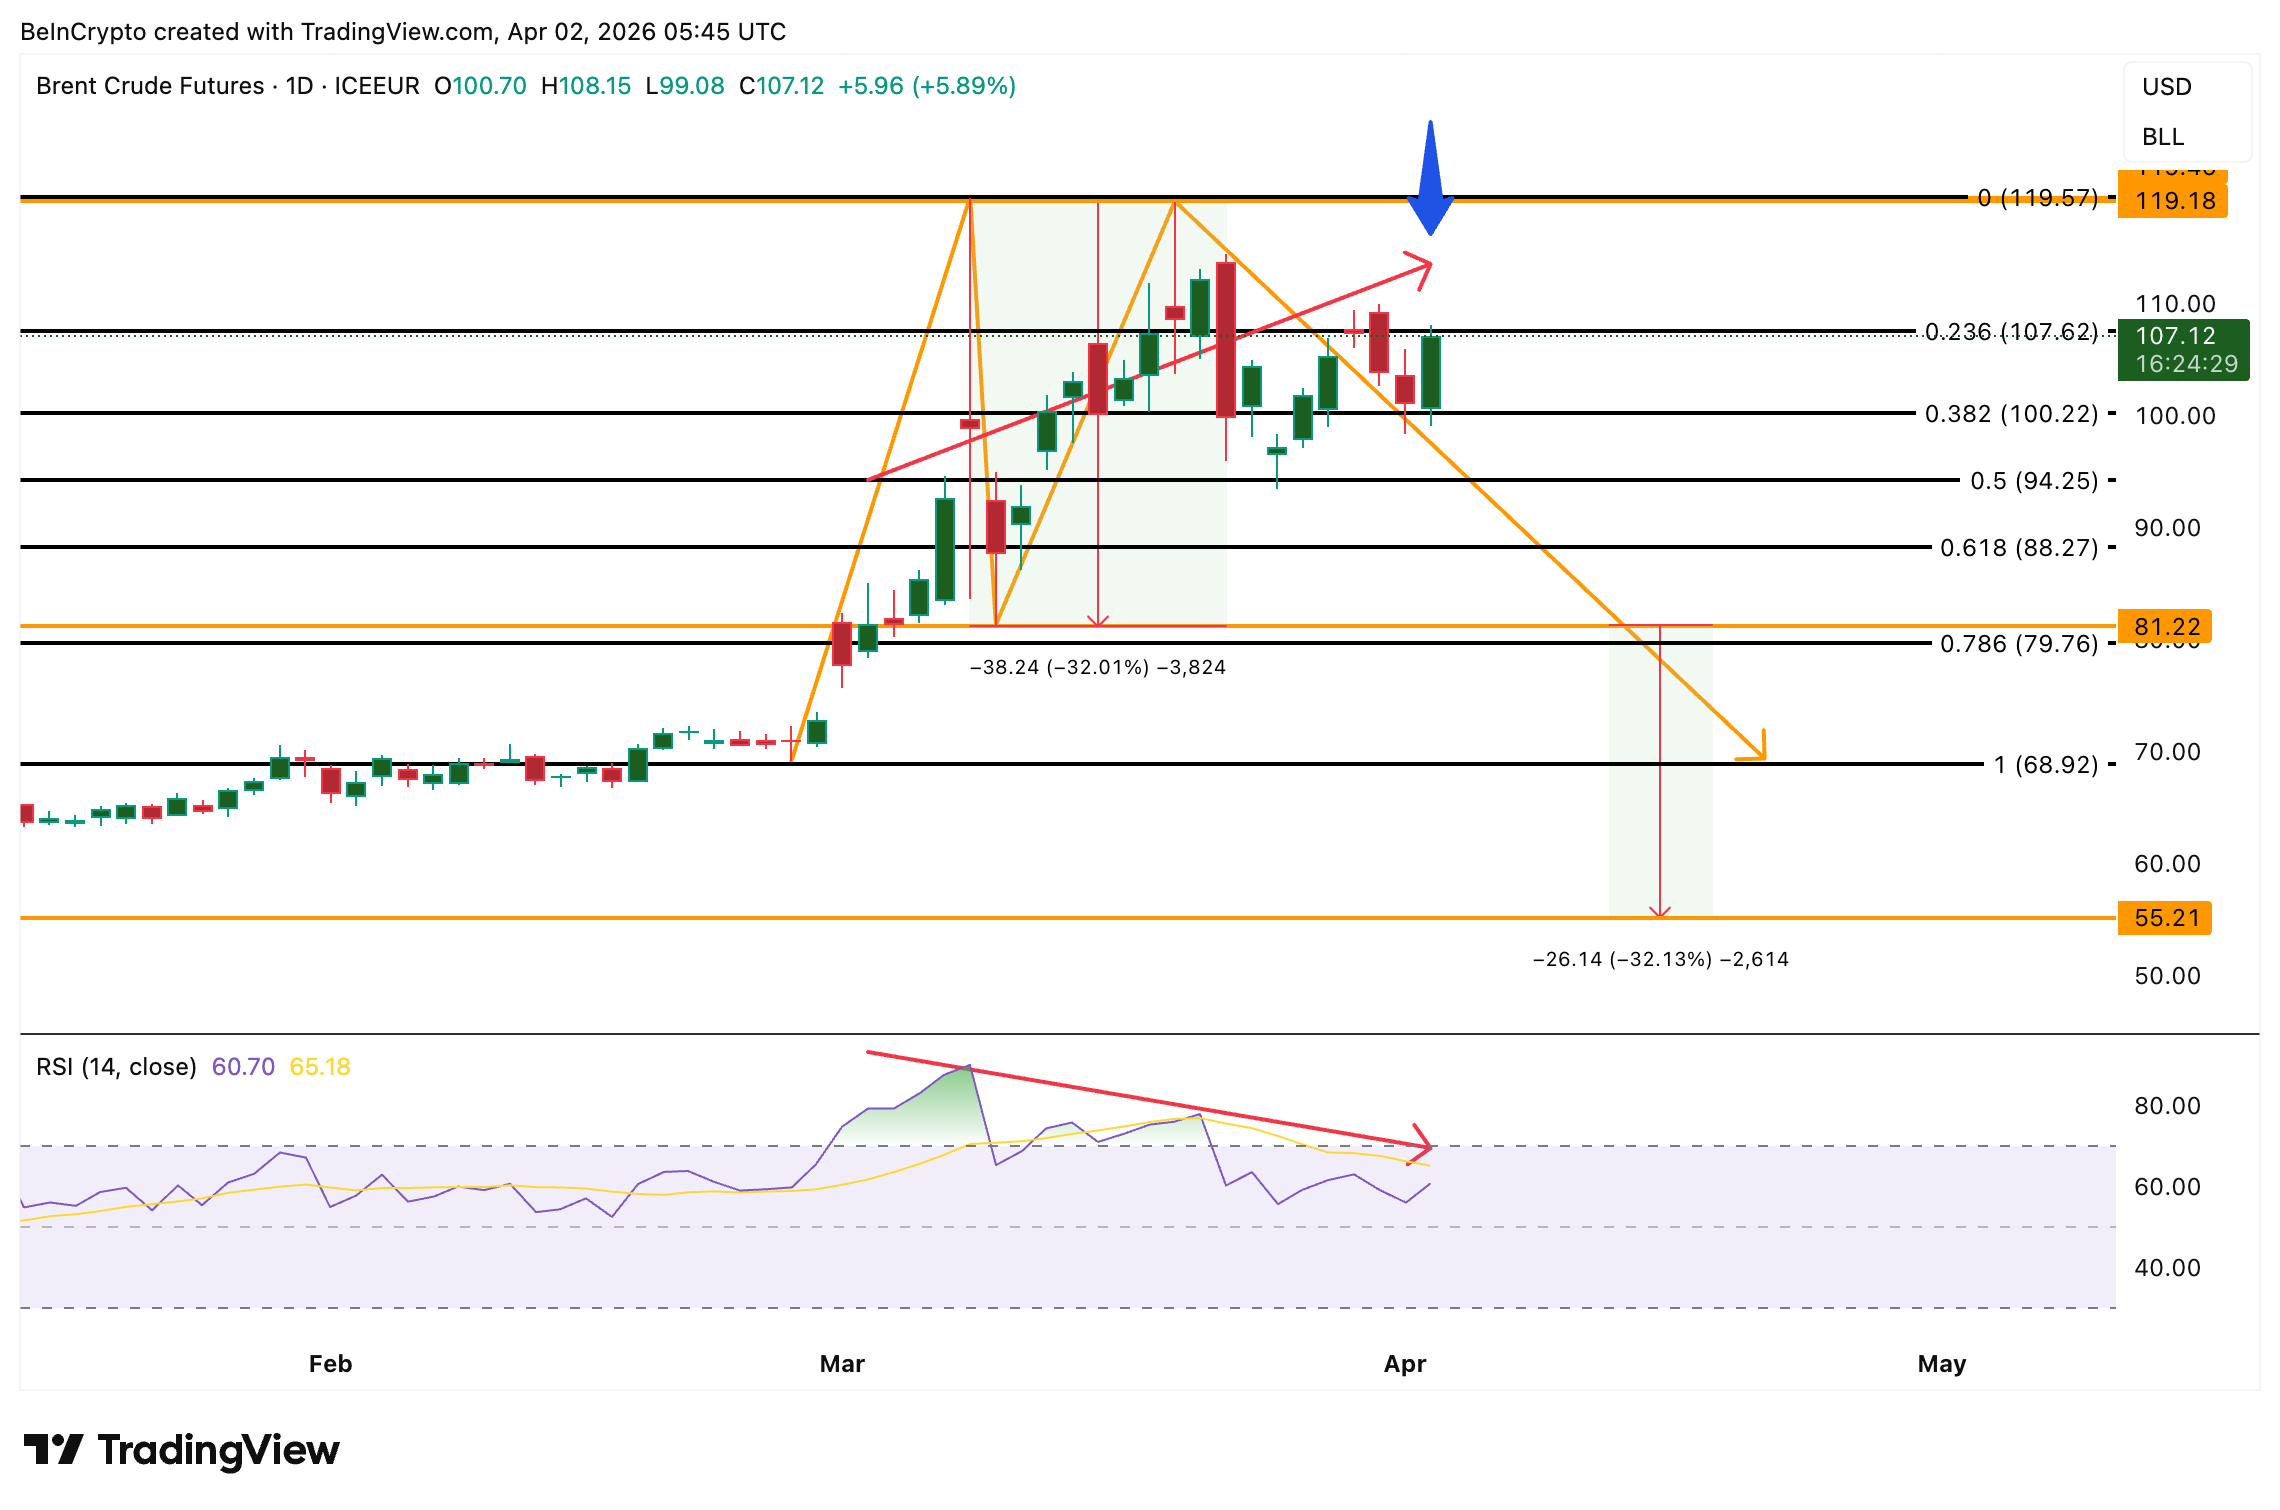 Brent Oil Price Analysis: TradingView
The $55 target remains theoretical as long as $81 holds. Three conditions must align for it to activate. The double top activation and RSI divergence need confirmation. The options positioning needs to shift from short-term hedging to sustained bearish commitment. That would be visible through rising open interest alongside the elevated put-call ratio.
And the geopolitical situation needs to move toward a resolution. Until all three converge, the oil price is more likely to oscillate between $100 and $119 than collapse to $55.
Recommended Articles


