


Solana Price Fails to Hold $90 as 17 Million SOL Blocks Path to $100
Solana (SOL) is trading at approximately $89 on March 20, unable to sustain a push above $92 after briefly touching $96 on March 16. The token has given back all of its mid-month gains in just four trading days.
The retreat follows a pattern visible throughout February and March, where SOL repeatedly reclaims key levels only to face rejection. Two on-chain signals are now pulling in opposite directions, making the next directional move harder to call.
Solana Holders Are Buying Again
Solana’s exchange balance fell sharply from approximately 28 million SOL on March 16 to roughly 26.3 million SOL by March 19, a reduction of around 1.7 million tokens in under 48 hours. Outflows of this scale typically indicate that holders are moving SOL off exchanges into self-custody, reducing immediate sell-side pressure.
Want more token insights like this? Sign up for Editor Harsh Notariya’s Daily Crypto Newsletter here.
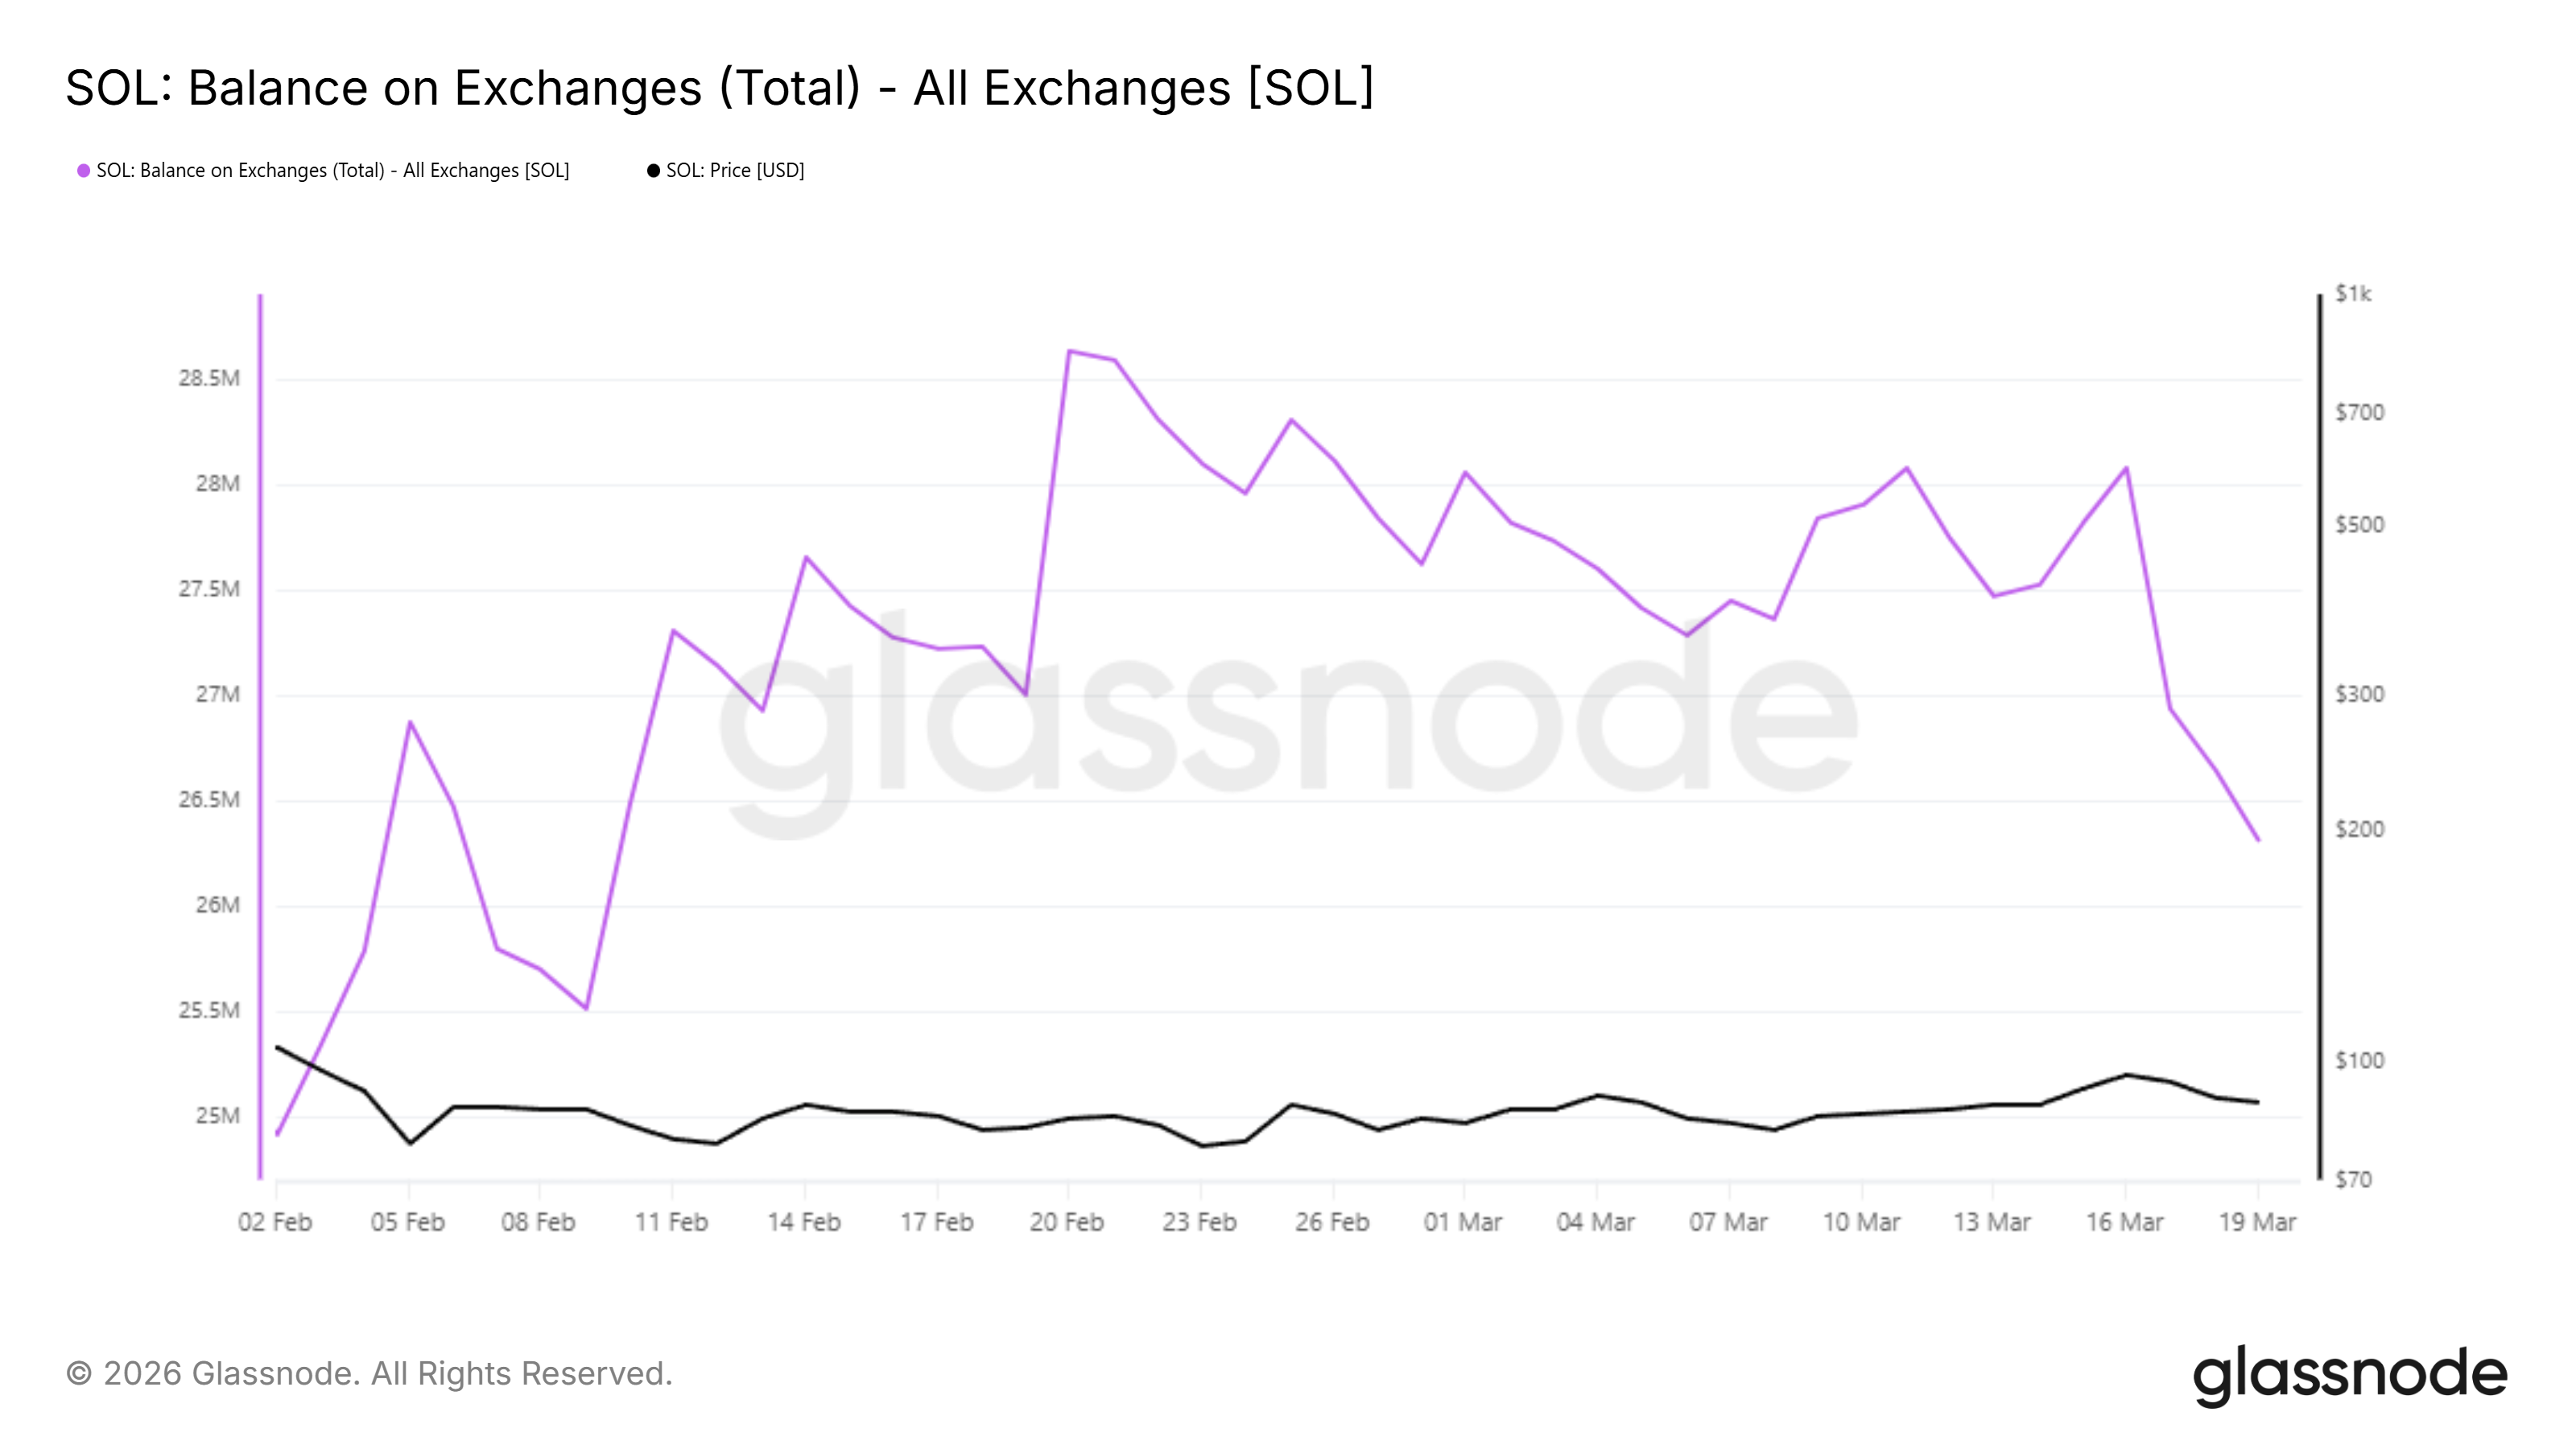 Solana Balance on Exchanges. Source: Glassnode
However, the Spent Output Profit Ratio (SOPR) (2-day moving average) tells a more cautious story. After briefly crossing above 1.0 on March 16 and reaching approximately 1.003 — a level last seen in early January — SOPR has sharply reversed to around 0.978 by March 19–20.
SOPR reading below 1.0 means the average coin being moved on-chain is being sold at a loss. The last time SOPR dropped this low was the February 7 capitulation event, when it briefly touched 0.957. The contrast between rising exchange outflows and falling SOPR suggests two distinct cohorts at work — long-term holders pulling SOL off exchanges, while shorter-term traders exit positions at a loss.
For the setup to turn clearly bullish, SOPR would need to reclaim and hold above 1.0 on rising prices. That crossover has failed twice in the past six weeks.
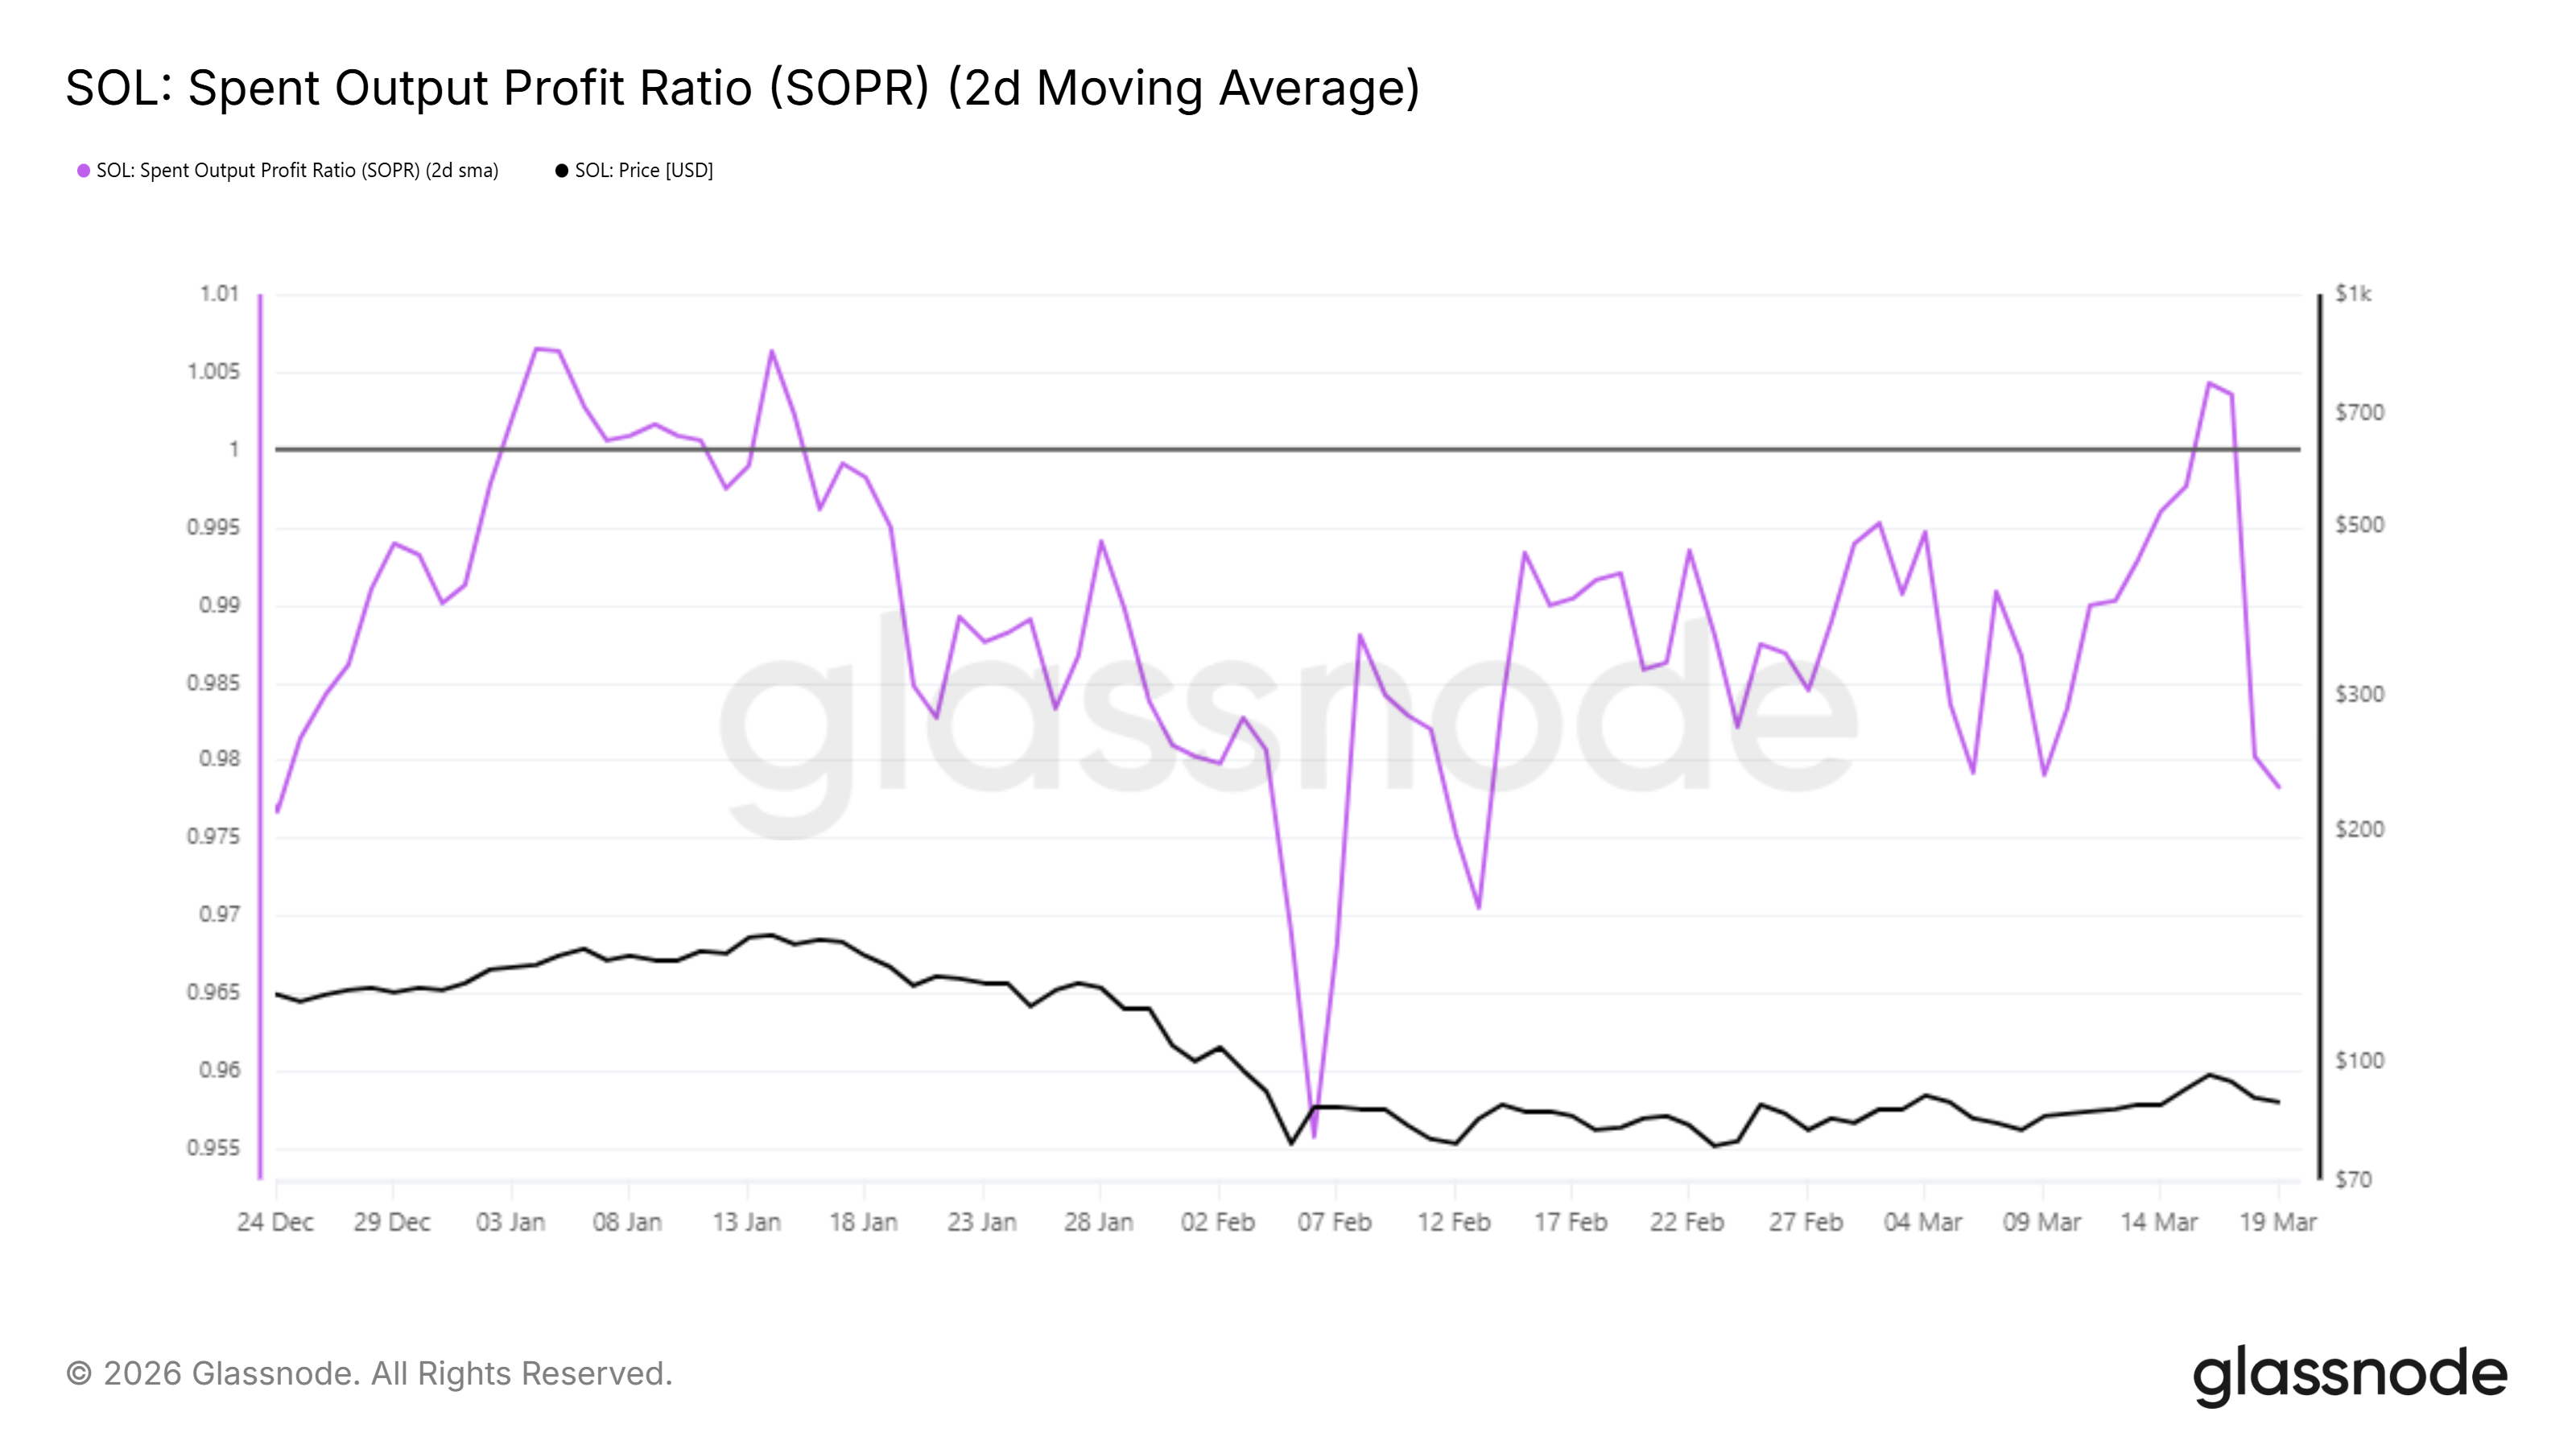 Solana SOPR. Source: Glassnode
What’s Holding SOL Back?
Despite the exchange outflows, the Cost Basis Distribution Heatmap reveals a significant structural obstacle. As of March 20, the densest supply cluster visible on the chart sits at a cost basis range of $117.19–$118.52, holding approximately 17.09 million SOL.
This cohort of holders is deeply underwater at current prices near $89. They represent a large pool of potential sellers who will look to exit near breakeven if SOL ever recovers toward $117–$118. That overhead pressure effectively caps any extended rally well before the $100 level comes into meaningful focus.
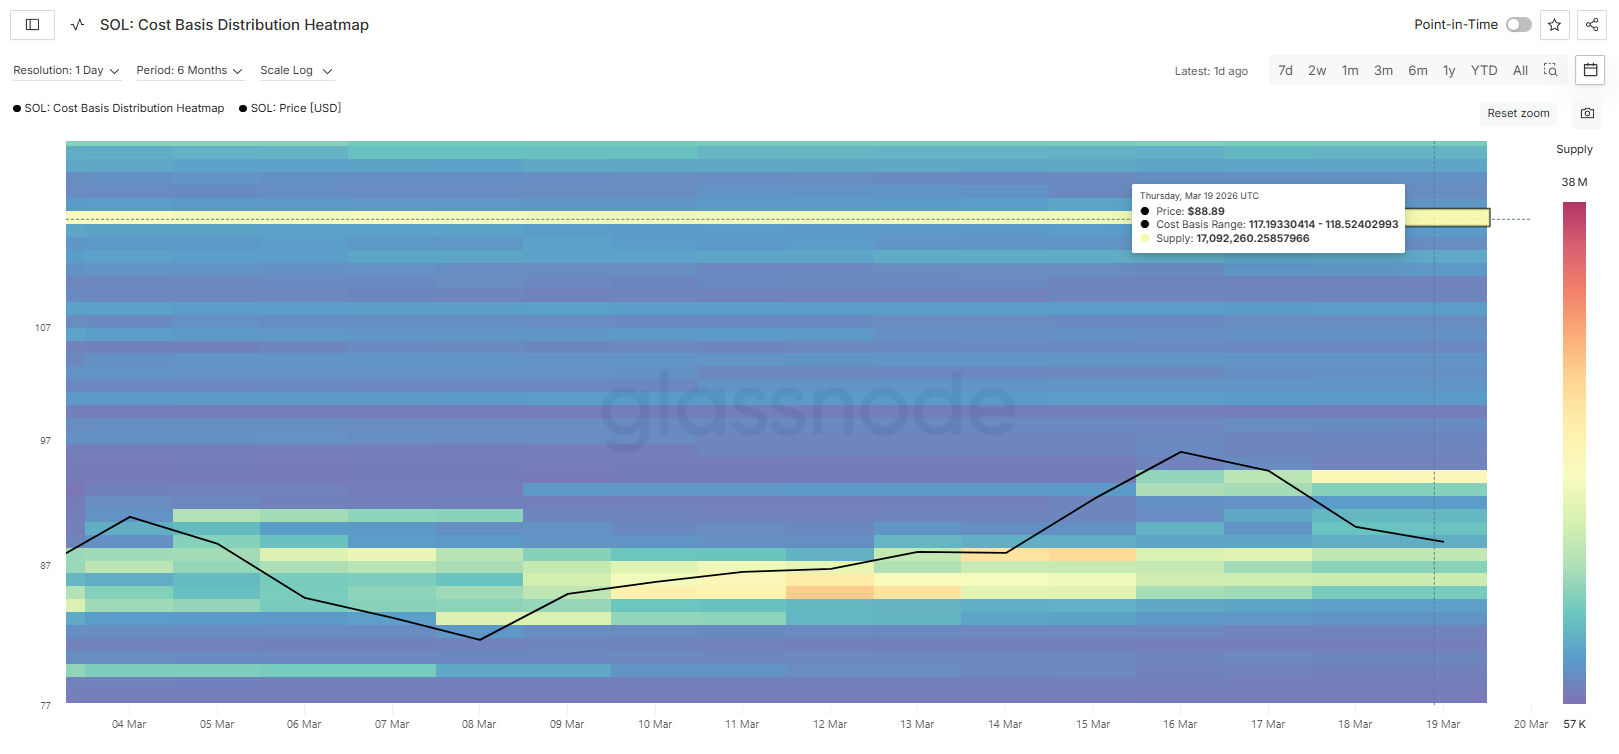 Solana CBD Heatmap. Source: Glassnode
In contrast, the supply concentration at current price levels ($87–$90) is relatively thin and scattered across multiple cost basis bands, showing mostly cooler blue tones on the heatmap. This means fewer holders are anchored directly at current prices, which reduces the risk of sudden forced selling in the near term.
The gap between the current price and the major overhead cluster gives SOL room to recover in the short term. However, any rally that approaches $100 will likely face intensifying resistance. This will be more evident when the market moves closer to the $117–$118 cost basis zone.
SOL Price Might Give $100 a Shot Again
Solana price can be seen sitting between the Bollinger Bands (BB) midline at $88.02 and the upper band at $95.08. An ascending trendline, drawn from the February lows, currently provides support in the $87–$88 zone. This line has held through multiple tests.
At $89.01, SOL is essentially resting on the BB midline. A daily close below $88.02 would shift the Bollinger Band structure bearish and open a move toward $81.60. This would make $77.19 and $73.50 as deeper support levels below that.
The $92.19 resistance level is the first hurdle that bulls must reclaim. A clean break and hold above $92.19 would put the upper BB at $95.08 back in play, followed by the psychological $100 level. This is where the Solana price shows no defined resistance until the $100 horizontal.
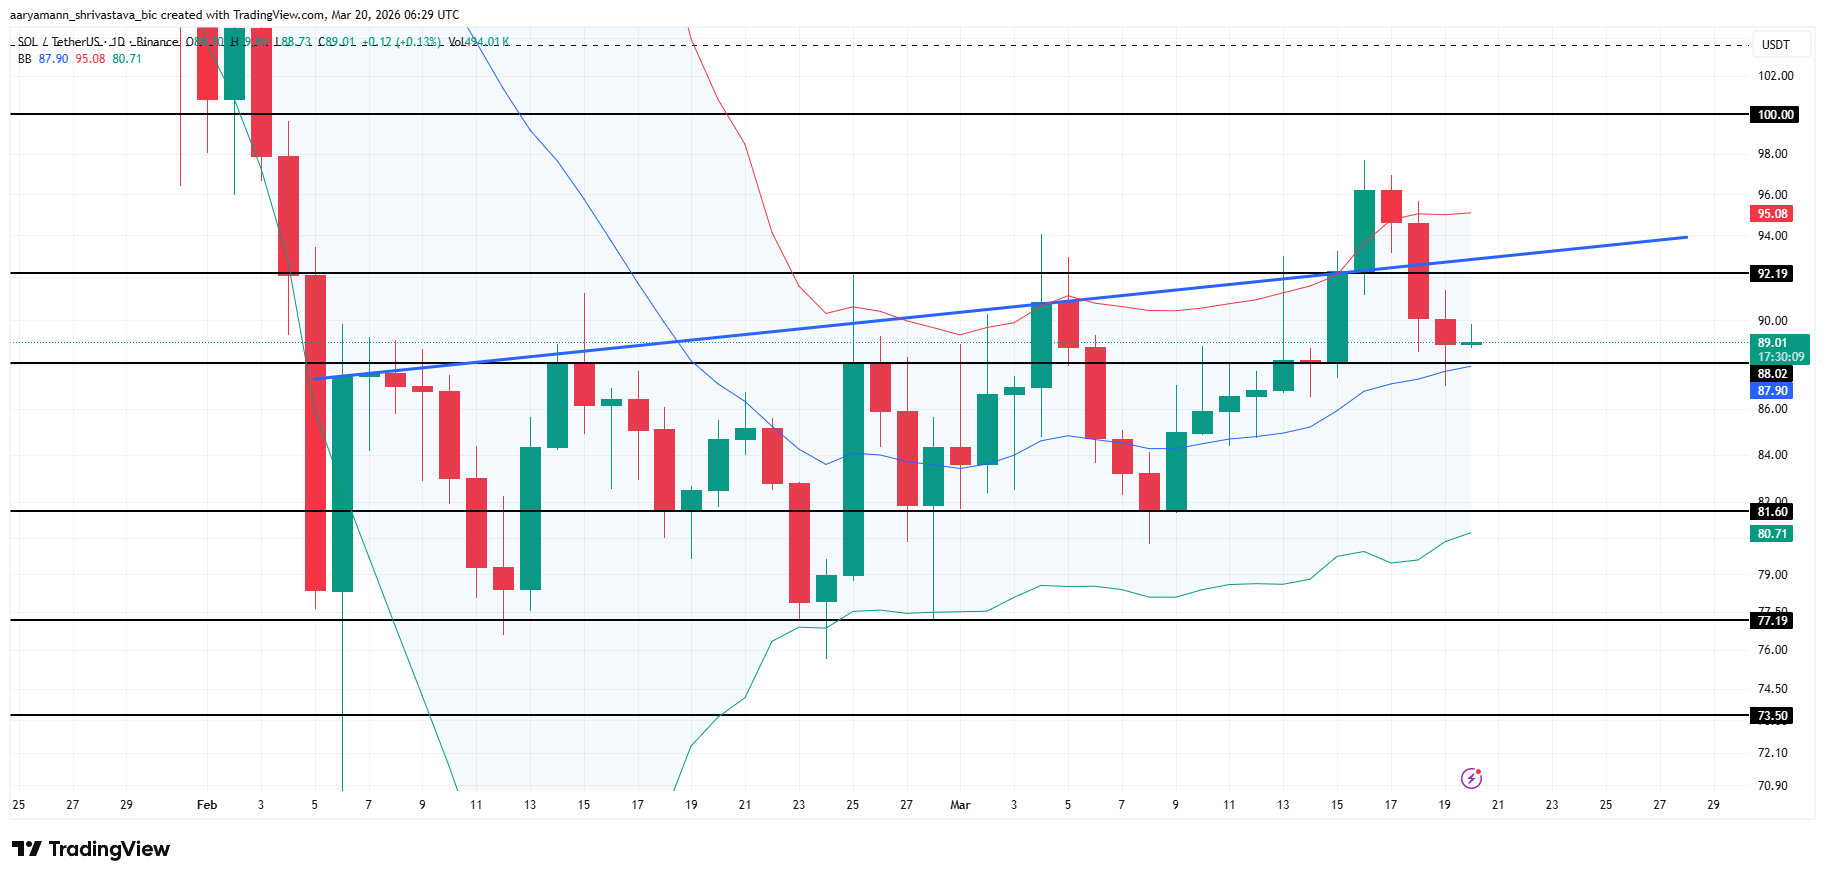 Solana Price Analysis. Source: TradingView
The 1.7 million SOL exchange outflow in 48 hours provides a near-term demand argument, and the ascending trendline from February has not yet been broken. However, with SOPR still below 1.0 and a 17 million SOL supply overhang at $117–$118, the path to $100 requires more. SOL needs sustained buying volume to push through $92.19 first, and that confirmation has not appeared yet.
Recommended Articles


