


Ethereum Builds a Spot Base 3x Stronger Than Its Last 25% Rally: What’s Next?
Ethereum (ETH) price printed a standard bullish divergence, repeating a setup that triggered about a 25% rally earlier this month.
The token trades near $2,140 after a 48% decline from its January high of $3,400. However, conflicting signals from derivatives and spot markets suggest the path forward may not mirror the previous bounce.
Leverage Signals a Shaky Foundation
On March 8, when the previous relative strength index (RSI), a momentum indicator, showed divergence, ETH’s total open interest (OI) stood at $9.42 billion. The aggregated funding rate was deeply negative at -0.017%.
That combination indicated heavy short positioning. Short liquidations then fueled the rally that followed.
The current setup looks different. Between January 25 and March 19, ETH’s price made a lower low on the daily chart. During the same window, the RSI formed a higher low near 38, highlighted earlier. This standard bullish divergence mirrors the January 25 to March 8 setup, which preceded the roughly 25% rally.
Want more token insights like this? Sign up for Editor Harsh Notariya’s Daily Crypto Newsletter here.
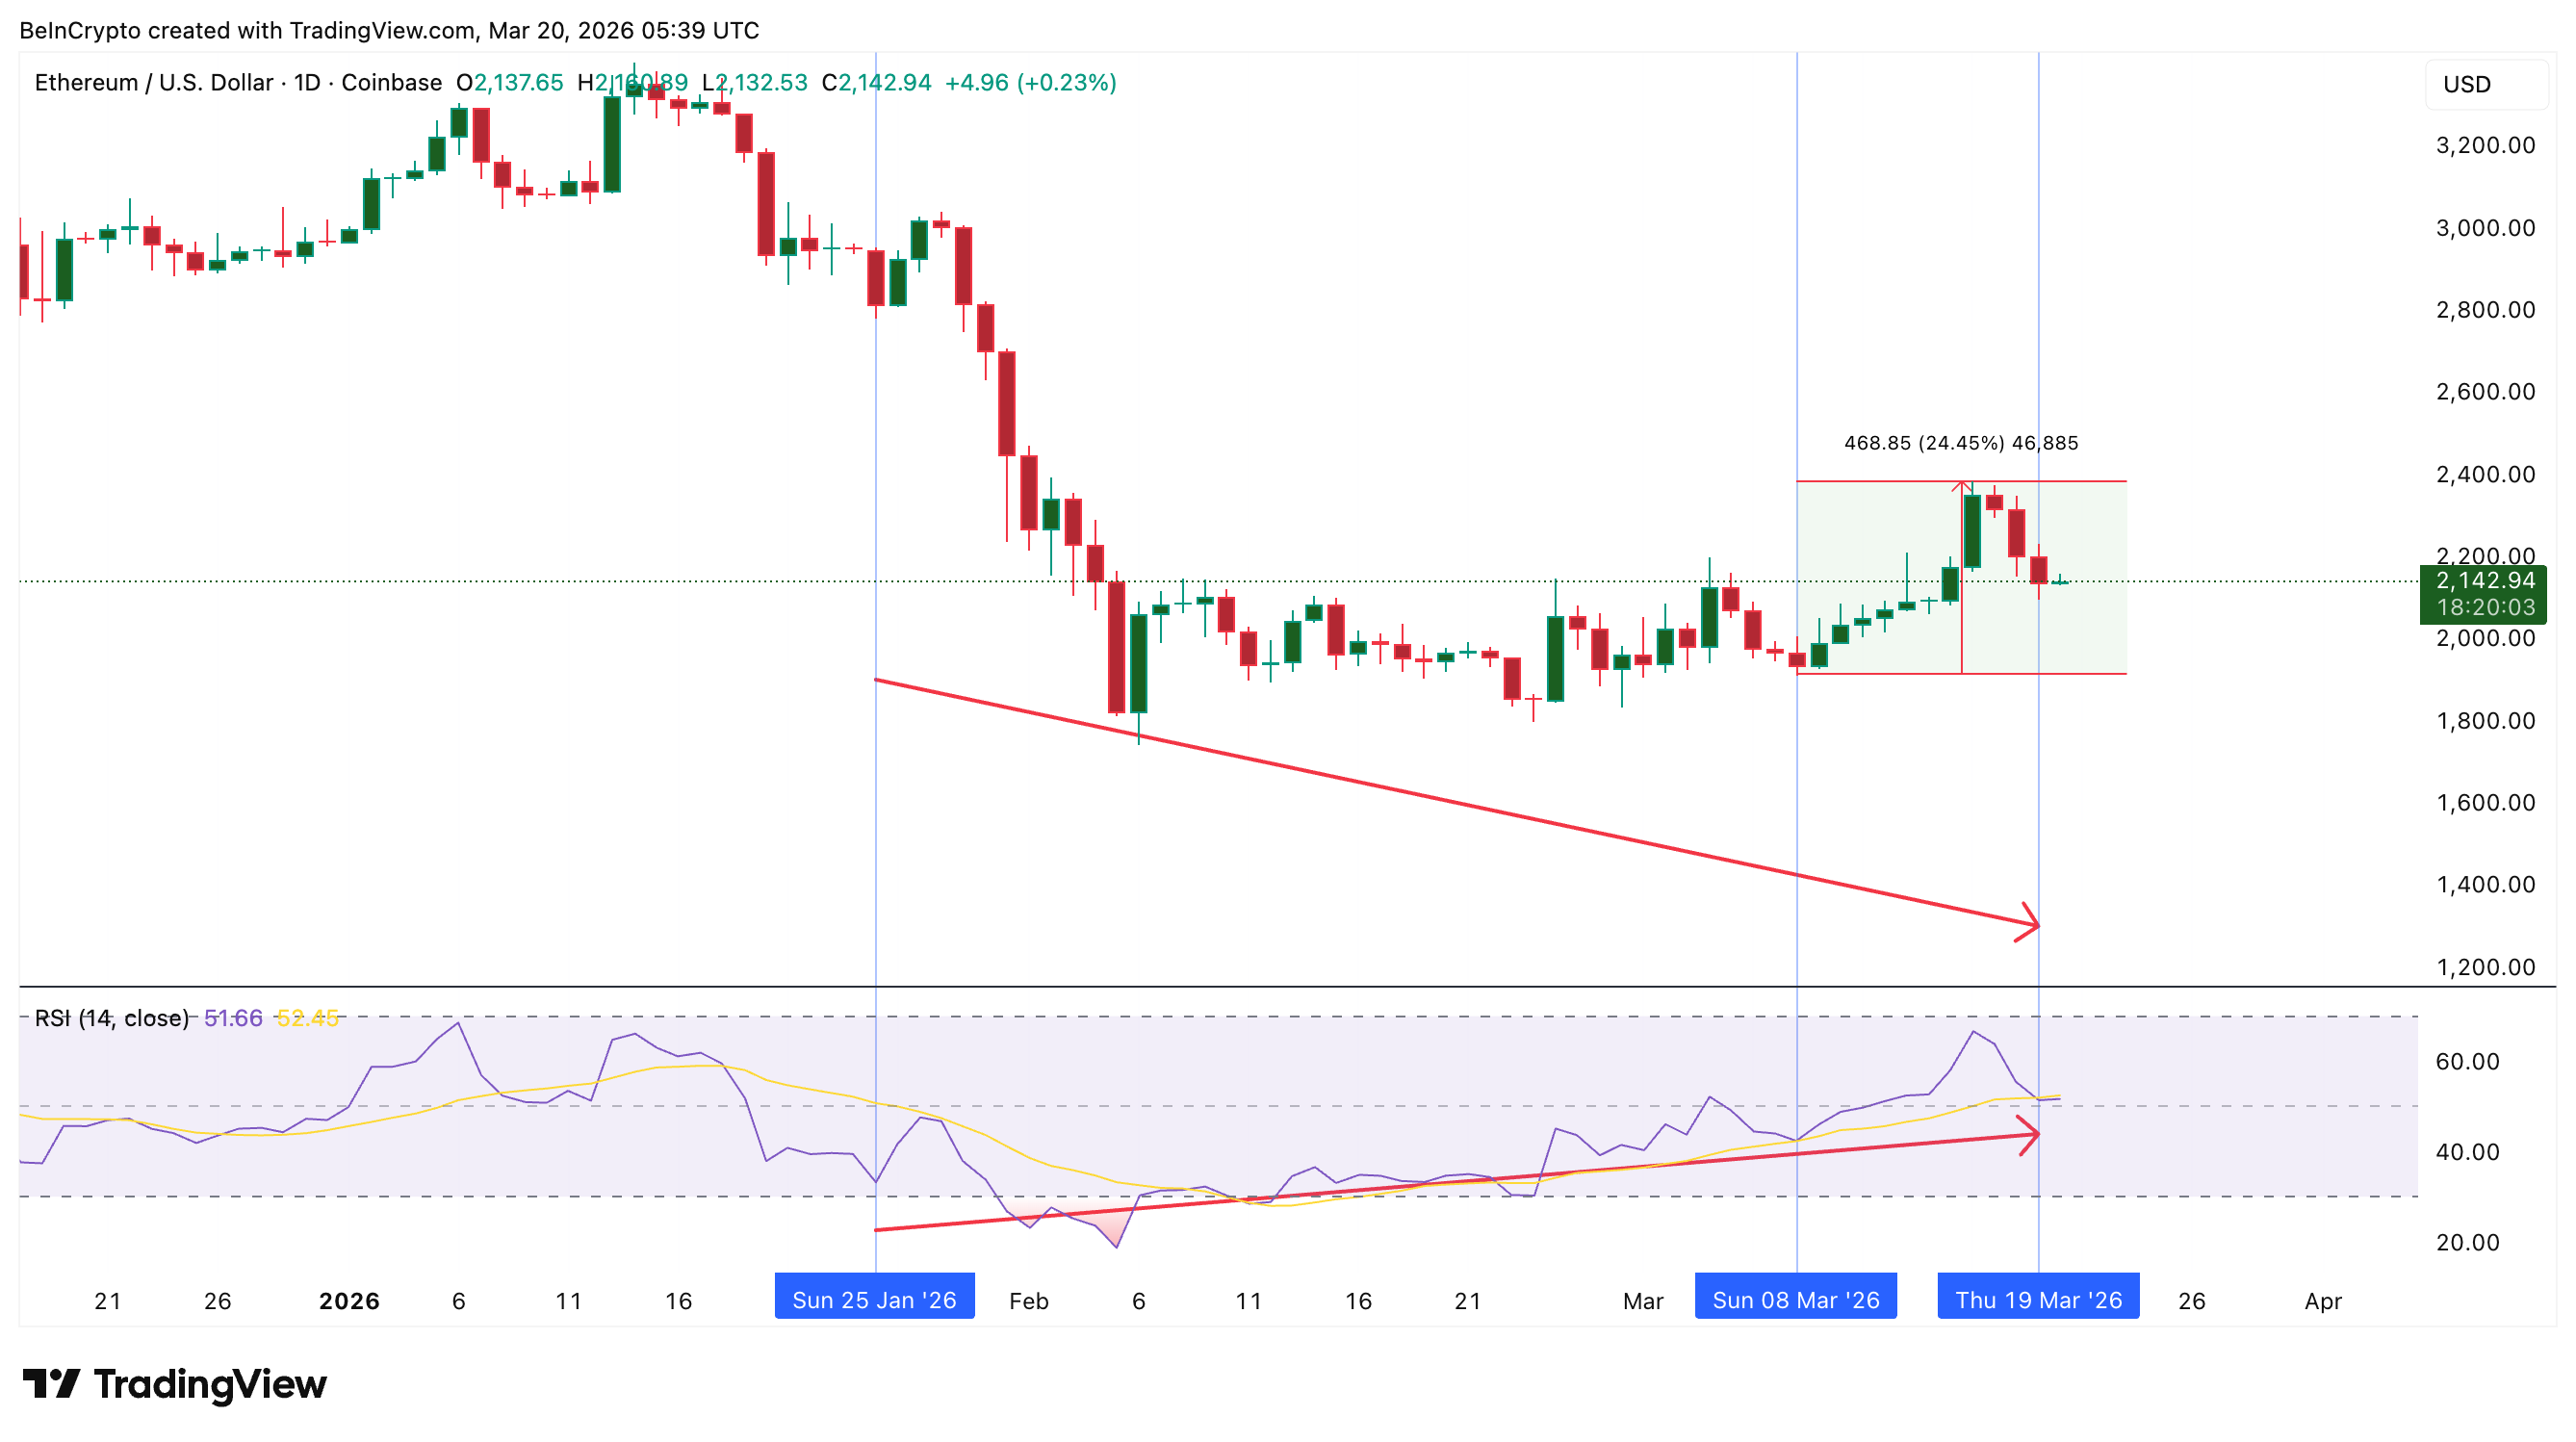 ETH RSI Divergence: TradingView
OI has climbed 17% to $11.04 billion, yet the funding rate sits at just -0.005%. Fewer short positions exist relative to the March 8 baseline.
Instead, the rising leverage now appears to reflect long-heavy positioning. If price drops, those long positions face liquidation pressure rather than creating a short squeeze tailwind.
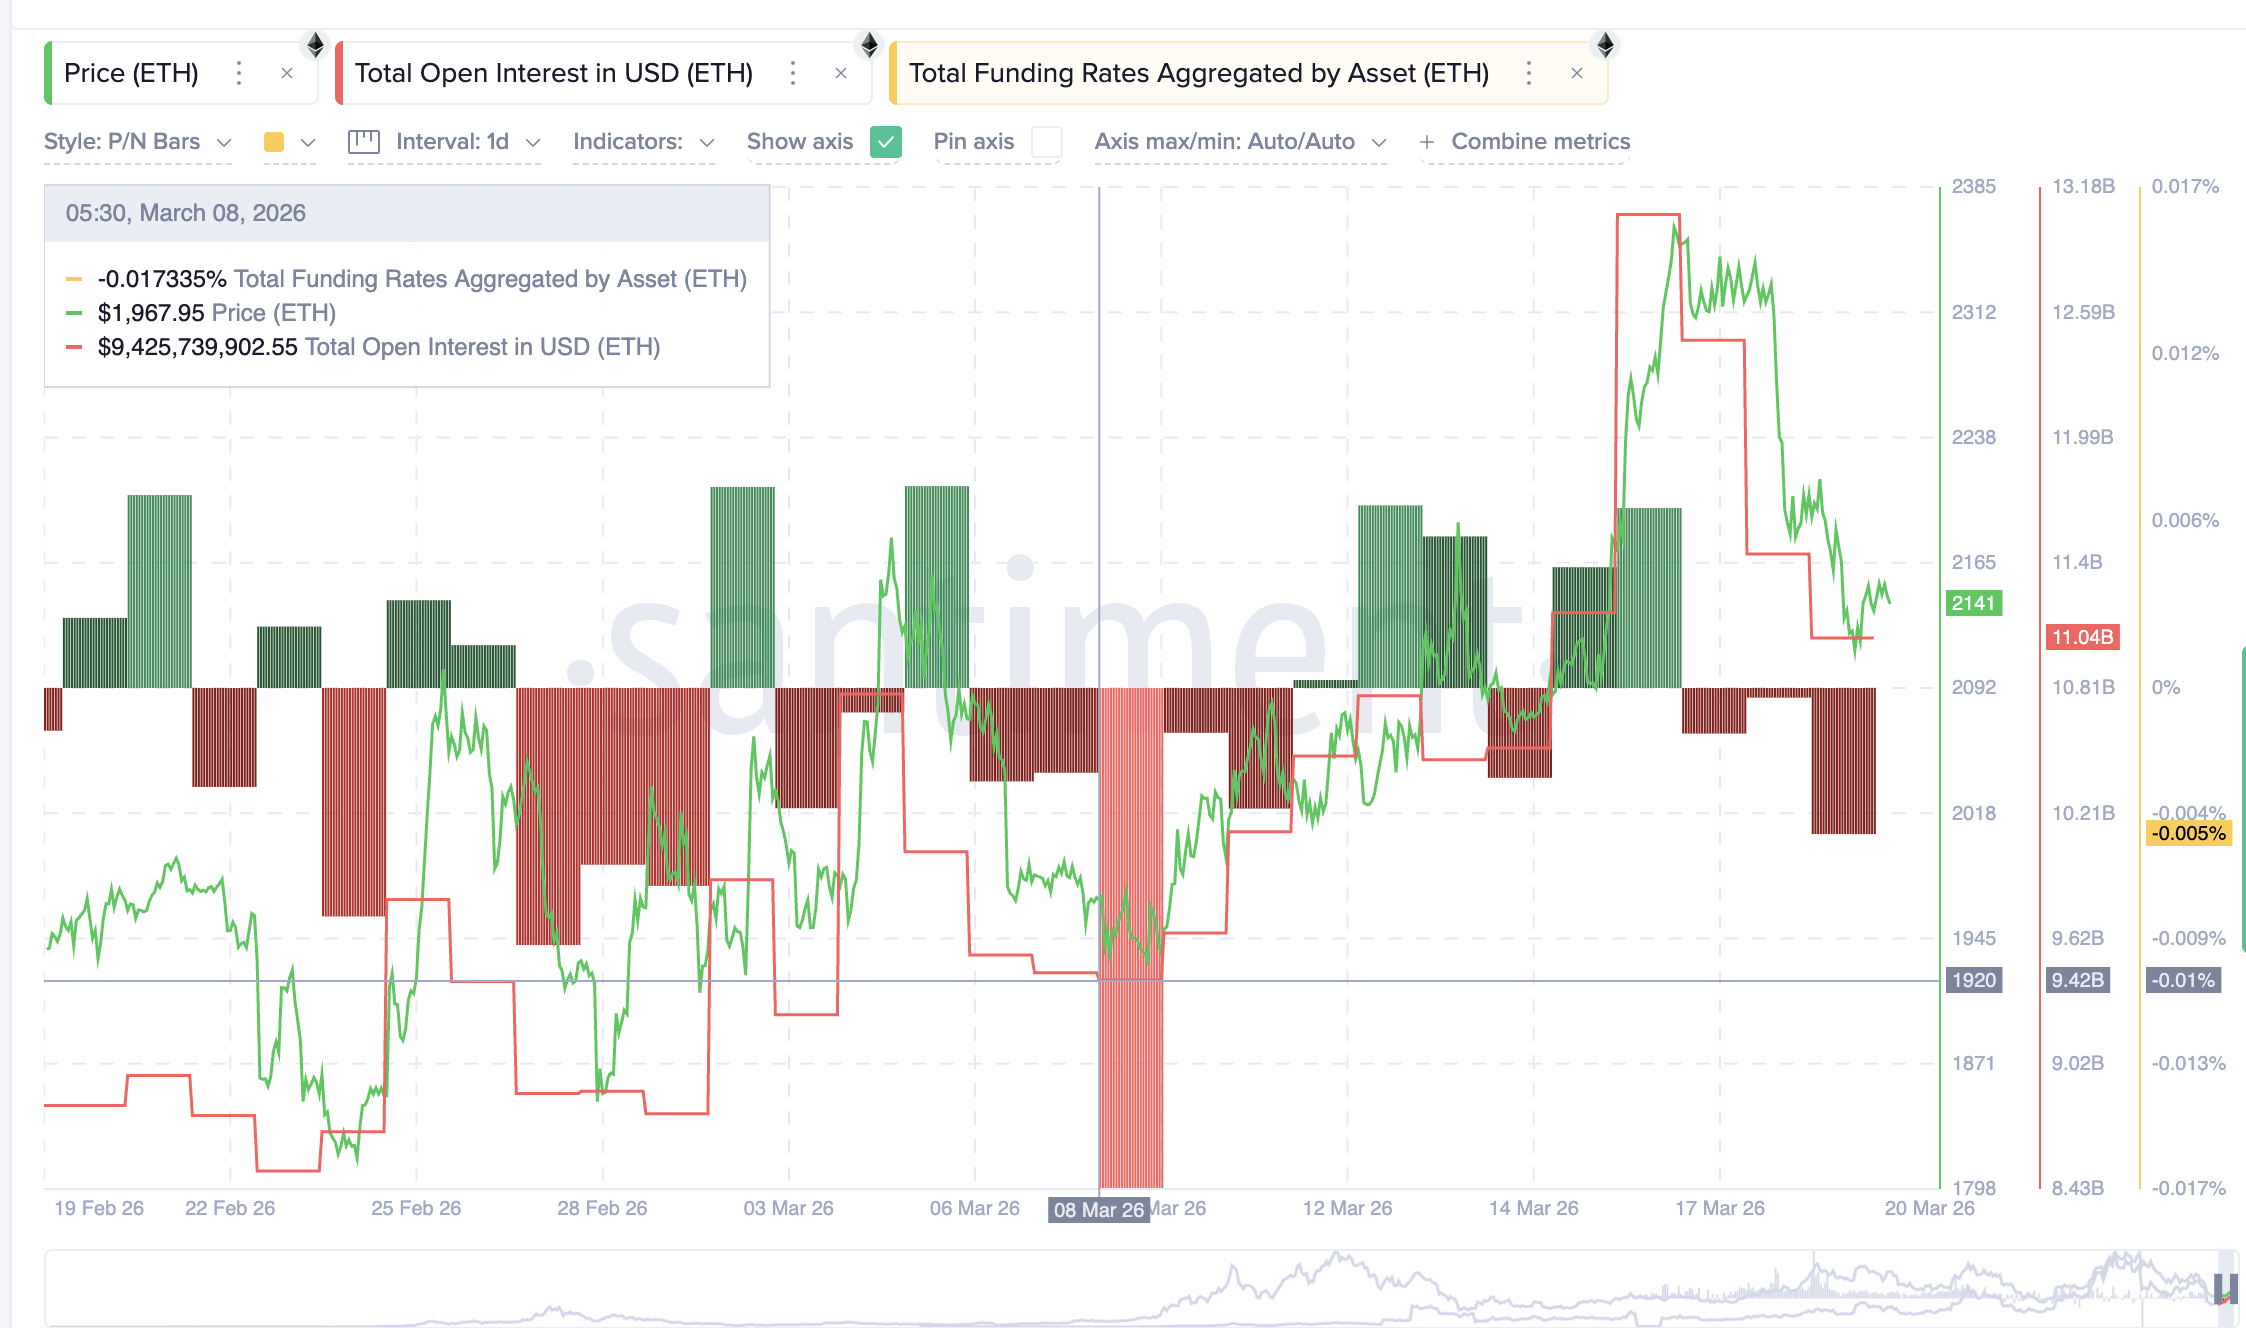 ETH Open Interest and Funding Rates: Santiment
However, derivatives data alone does not capture the full picture. The spot market offers a contrasting signal worth examining.
Spot Buyers Paint a Different Picture
Despite the weak derivatives setup, on-chain exchange flow data tells a more encouraging story.
On March 19, the exchange net position change for ETH reached -533,218 across all exchanges, according to Glassnode. That figure represents the largest single-day outflow in over two weeks.
Negative values mean more ETH is leaving exchanges than entering them. This typically reflects spot accumulation, as investors move tokens to private wallets for long-term holding.
For comparison, on March 8, when the previous divergence flashed, the net position change was -191,554 ETH. The current outflow is nearly three times larger.
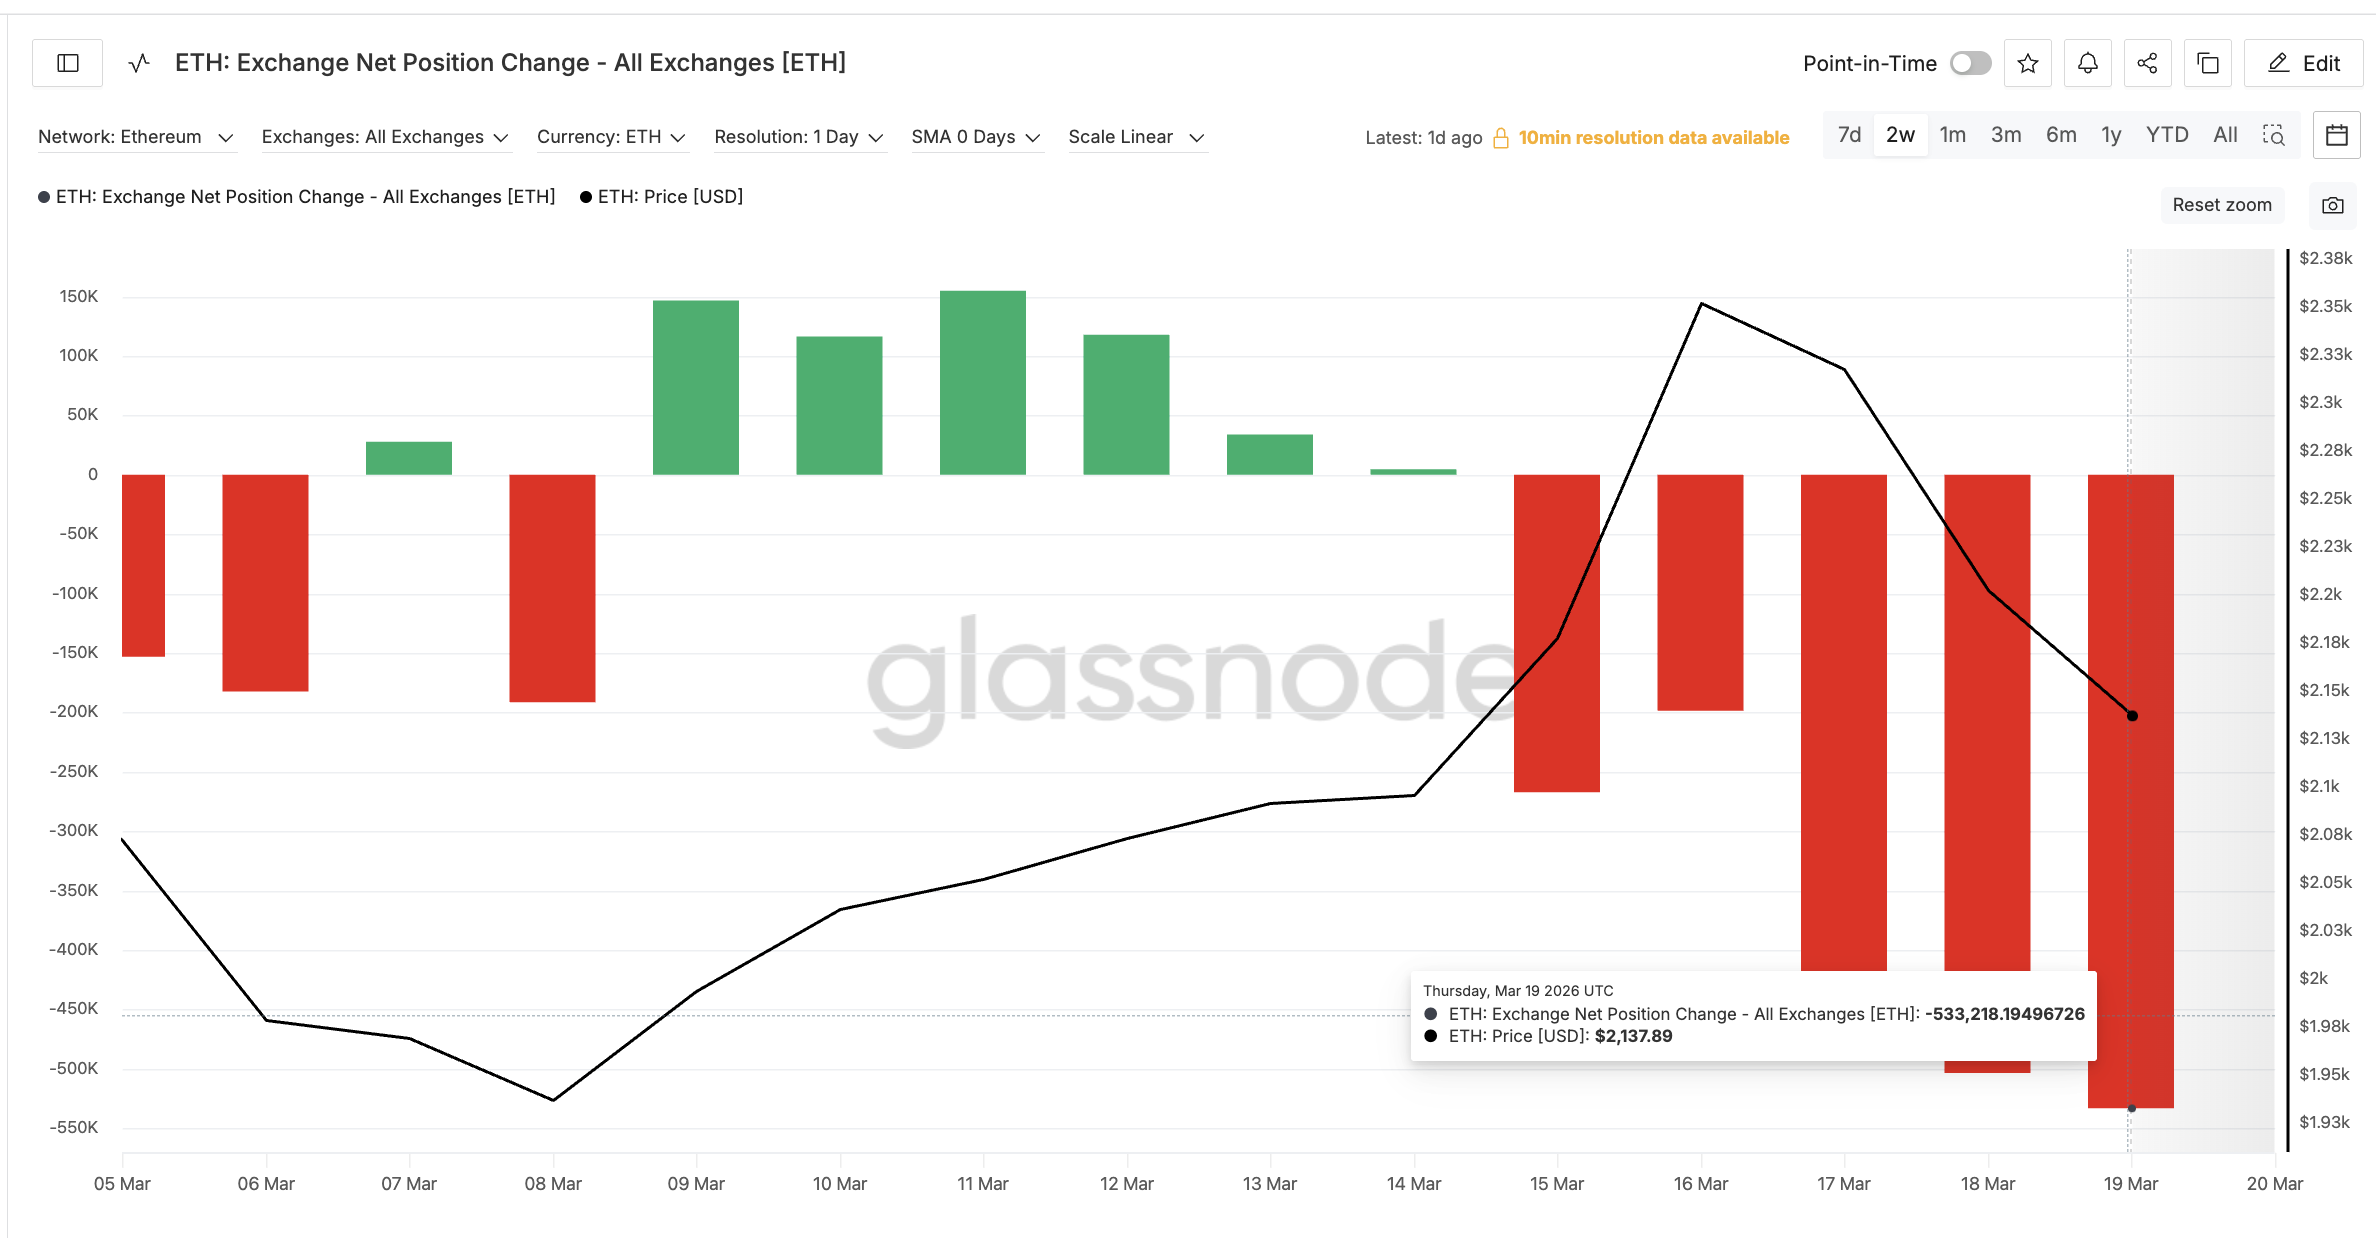 ETH Exchange Net Position Change: Glassnode
If this buyer-friendly trend holds, it provides a strong spot demand base. That accumulation could offset the fragility visible in the derivatives market.
With spot support in place but leverage risks still active, the price chart becomes the final decider. The key Fibonacci levels will determine which force wins.
Ethereum Price Prediction and The $2,380 Line in the Sand
However, the daily ETH price chart reveals an ascending channel that formed after the 48% drop from $3,400 to the February 6 low near $1,740. ETH attempted to break the channel’s upper trendline on March 16 but failed. That rejection pushed the price back toward the middle of the range.
Note – Ascending channels that post sizable dips aren’t automatically bullish and carry continuation risks.
Using technical levels, the key resistance now sits at $2,380. Any sustained Ethereum price bounce must reclaim this level to confirm a breakout above the channel and turn bullish.
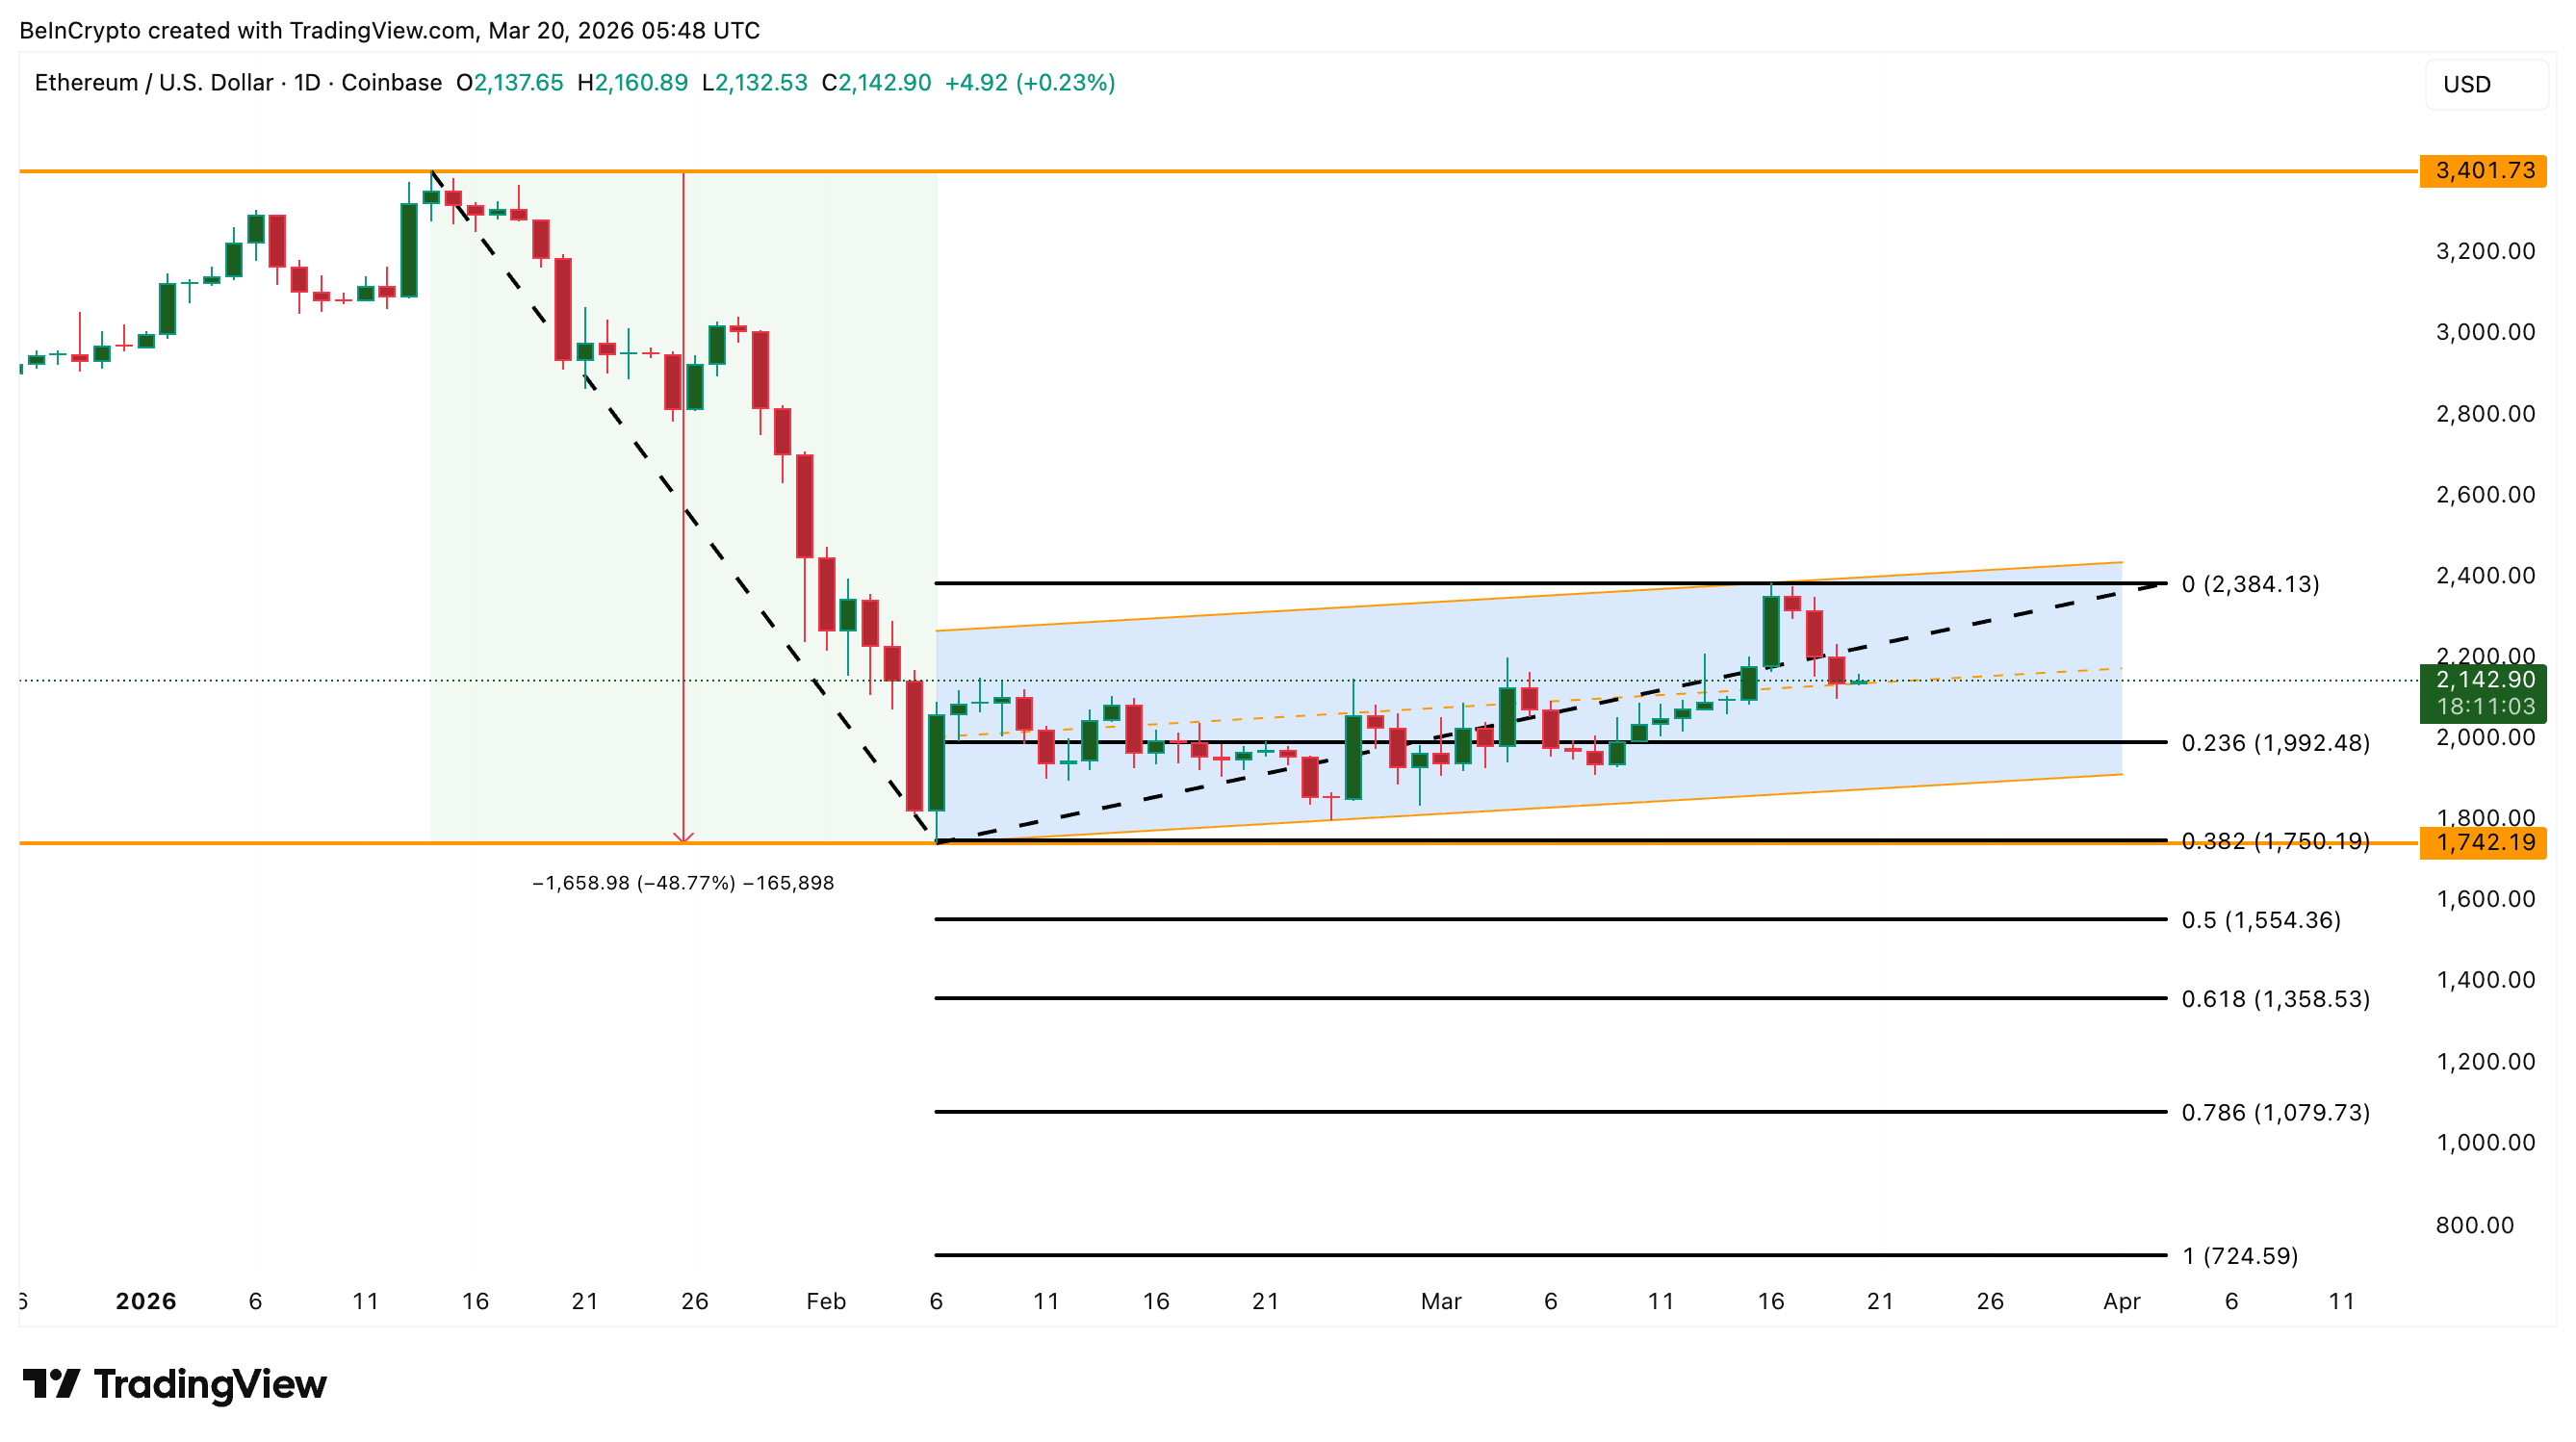 ETH Price Analysis: TradingView
If $2,380 is not reclaimed, $1,990 becomes the next support zone. A break below $1,990 opens the path to $1,750, which aligns with the 0.382 Fibonacci level and the February low. For now, the $2,380 reclaim separates a channel breakout from another slide toward February lows.
Recommended Articles


