


Ethereum Long-Term Price Outlook: Will Tokenization Boost Price?
Ethereum’s on-chain fundamentals are improving at a pace not seen in any previous cycle. Institutional capital is building on the network, whale wallets are growing, and exchange reserves are falling. Yet the price tells a different story. ETH is down over 50% from its 2025 highs, and the weekly chart structure remains bearish.
The question is whether institutional blockchain activity can eventually pull the price higher or whether it remains a story without a market payoff.
Traditional Finance (TradFi) Is Choosing Ethereum
Large financial institutions are entering blockchain at an accelerating rate. That involvement spans custody, settlement, and payments.
But the most measurable form of this shift is tokenization, in which financial products such as treasury bills, bonds, and money market funds are represented as digital tokens on a public blockchain.
Within tokenization, the highest-traction category is real-world asset tokenization, commonly known as RWA.
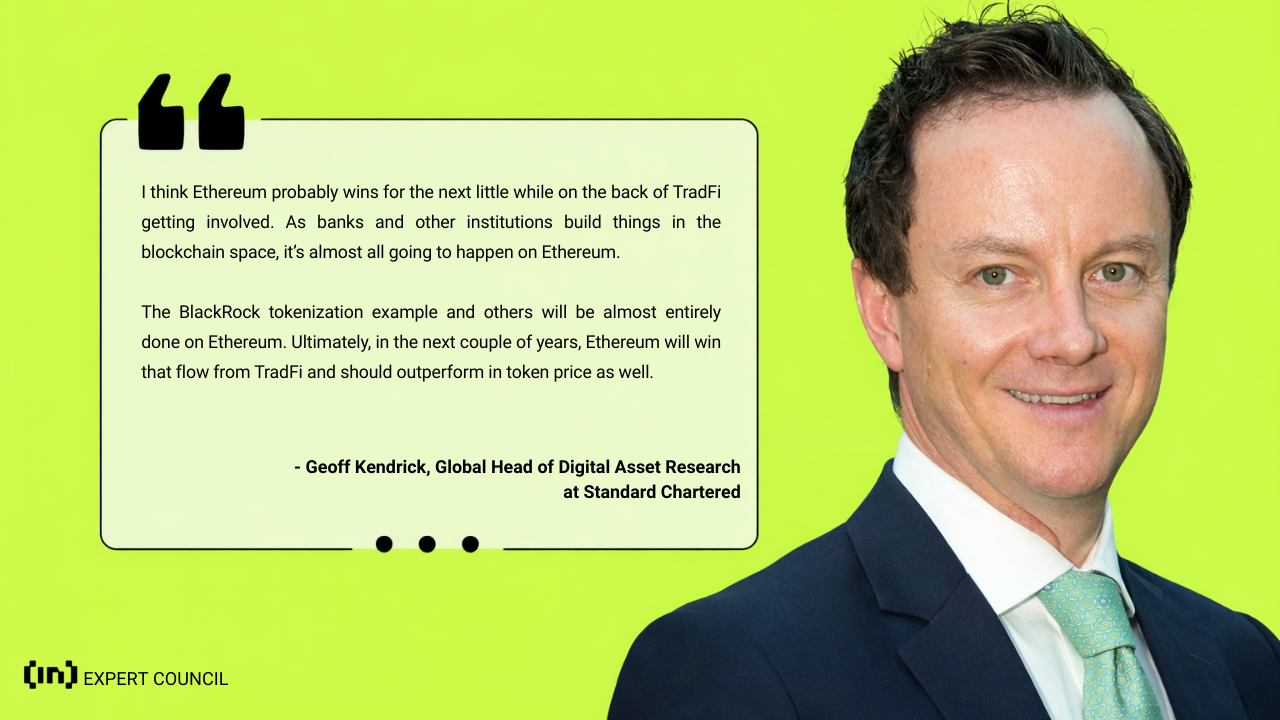
Geoff Kendrick, Global Head of Digital Asset Research at Standard Chartered, framed it directly in BeInCrypto’s Expert Council meeting:
“I think Ethereum probably wins for the next little while on the back of TradFi getting involved. As banks and others build stuff on blockchain space, it’s almost all going to happen on Ethereum for the next couple of years,” he said.
The data backs that up. According to RWA.xyz, Ethereum’s distributed tokenized asset value grew from $1.22 billion in March 2024 to $15.26 billion by March 2026, a 1,150% increase.
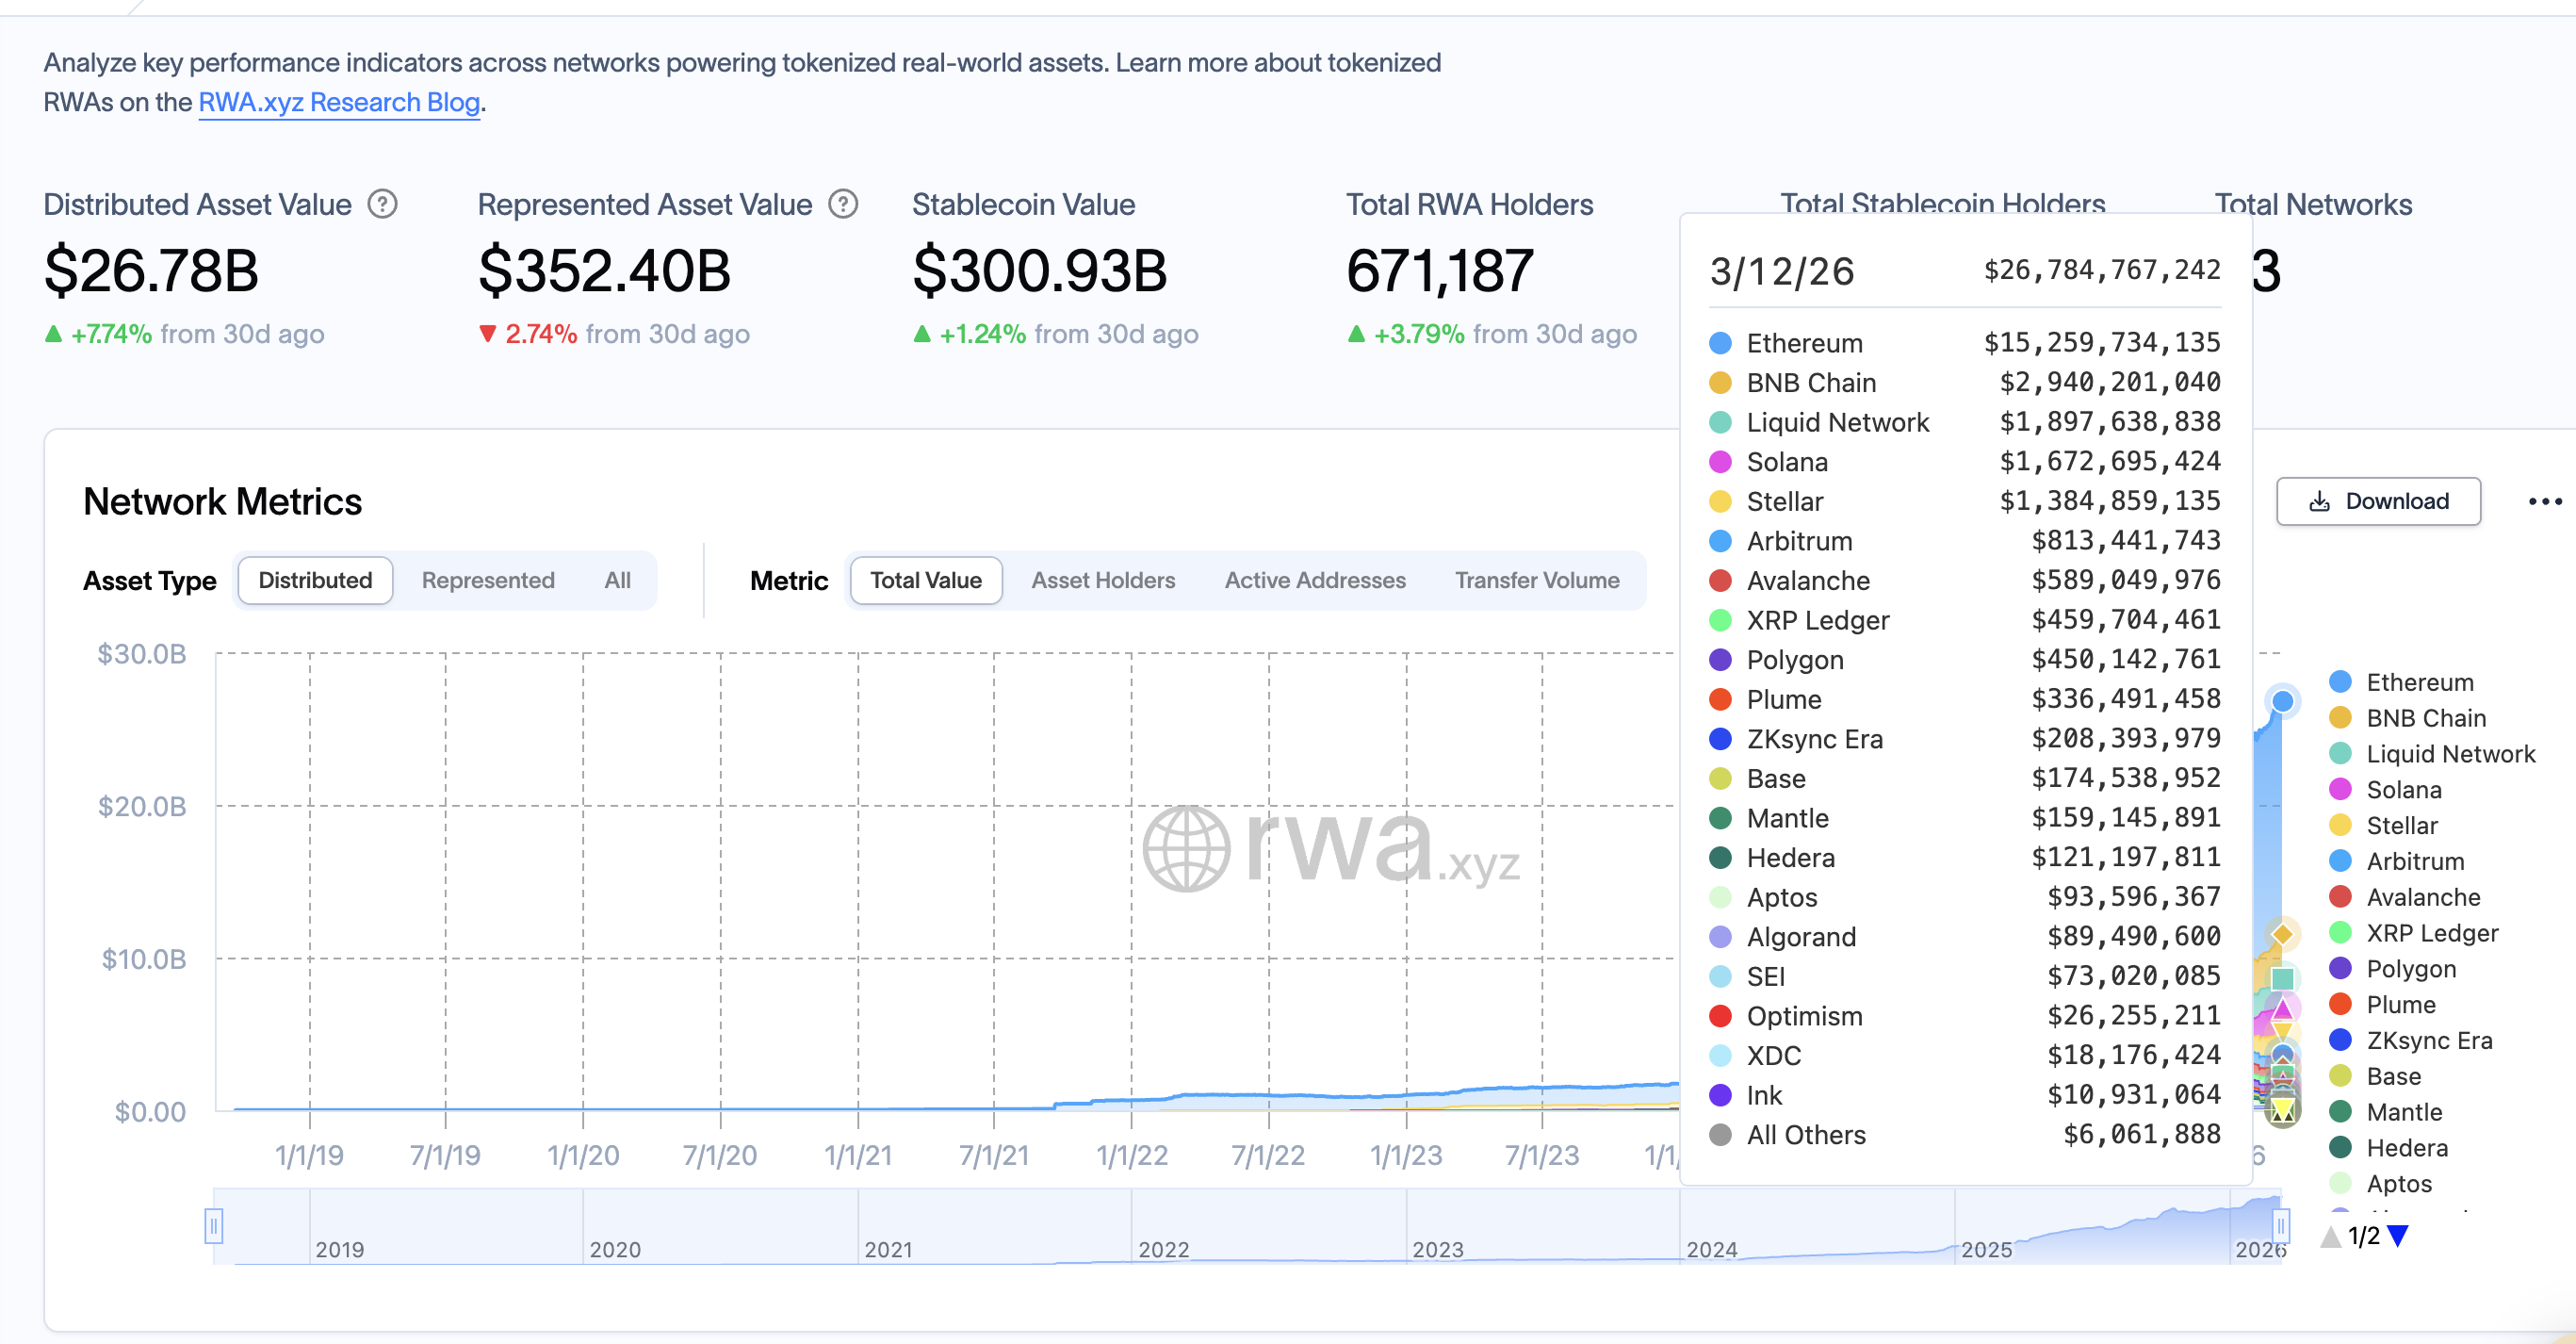 RWA Growth: RWA.XYZ
The network holds 57% of all tokenized assets across blockchains and attracted $10.3 billion in net capital inflows over the past year. By contrast, Solana saw $41 billion in overall net outflows during the same period.
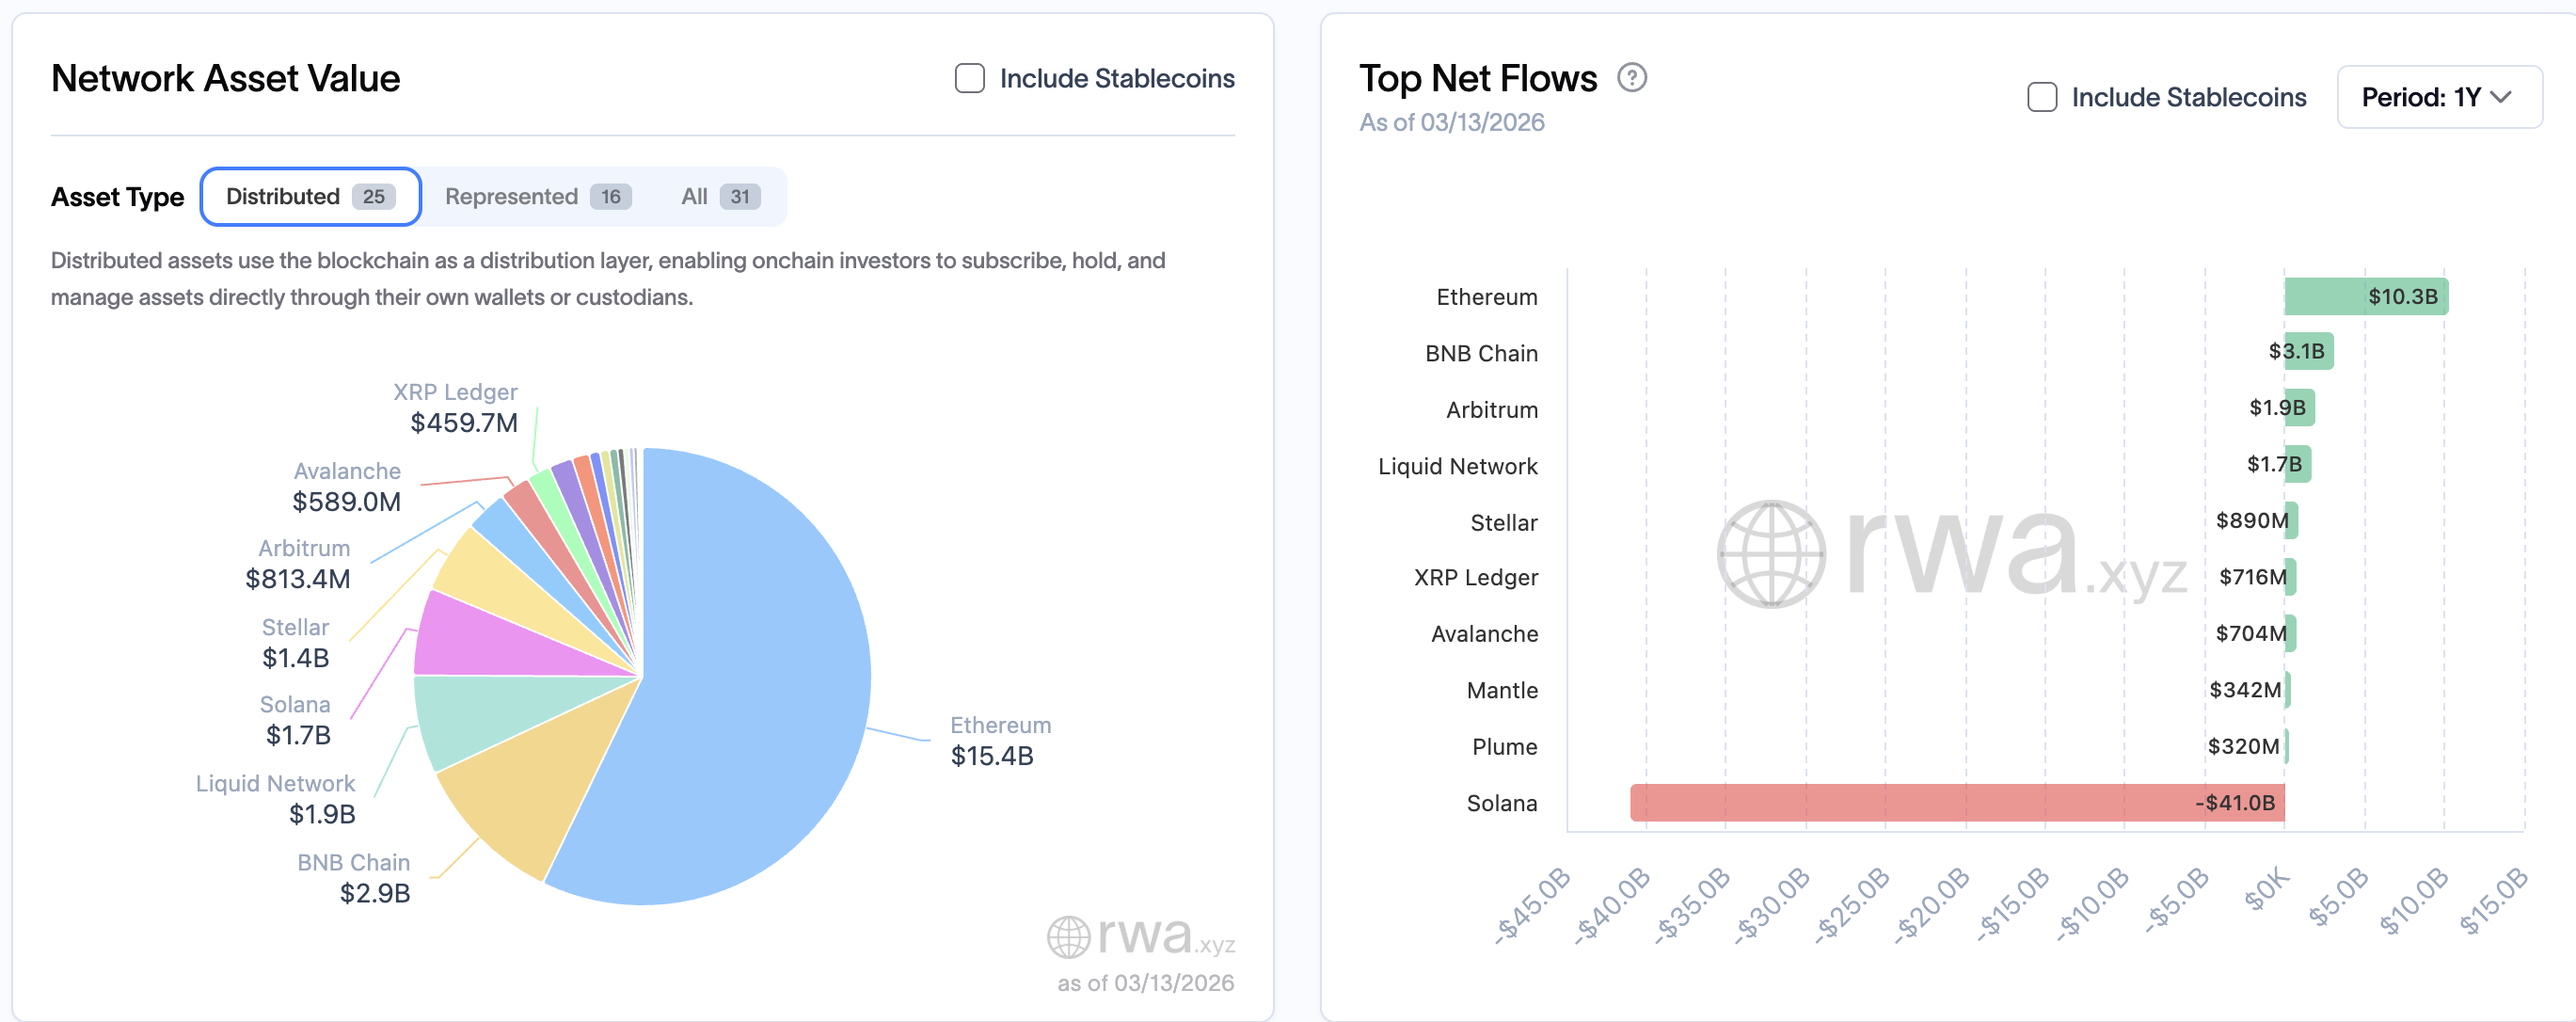 Ethereum Network Asset Value: RWA.XYZ
The clearest proof of institutional commitment came when BlackRock launched BUIDL, a tokenized US Treasury money market fund.
Built on Ethereum through Securitize, a digital asset securities platform, it grew from $100.5 million at launch in March 2024 to $2 billion in March 2026. On Ethereum alone, BUIDL’s AUM is over $780 million.
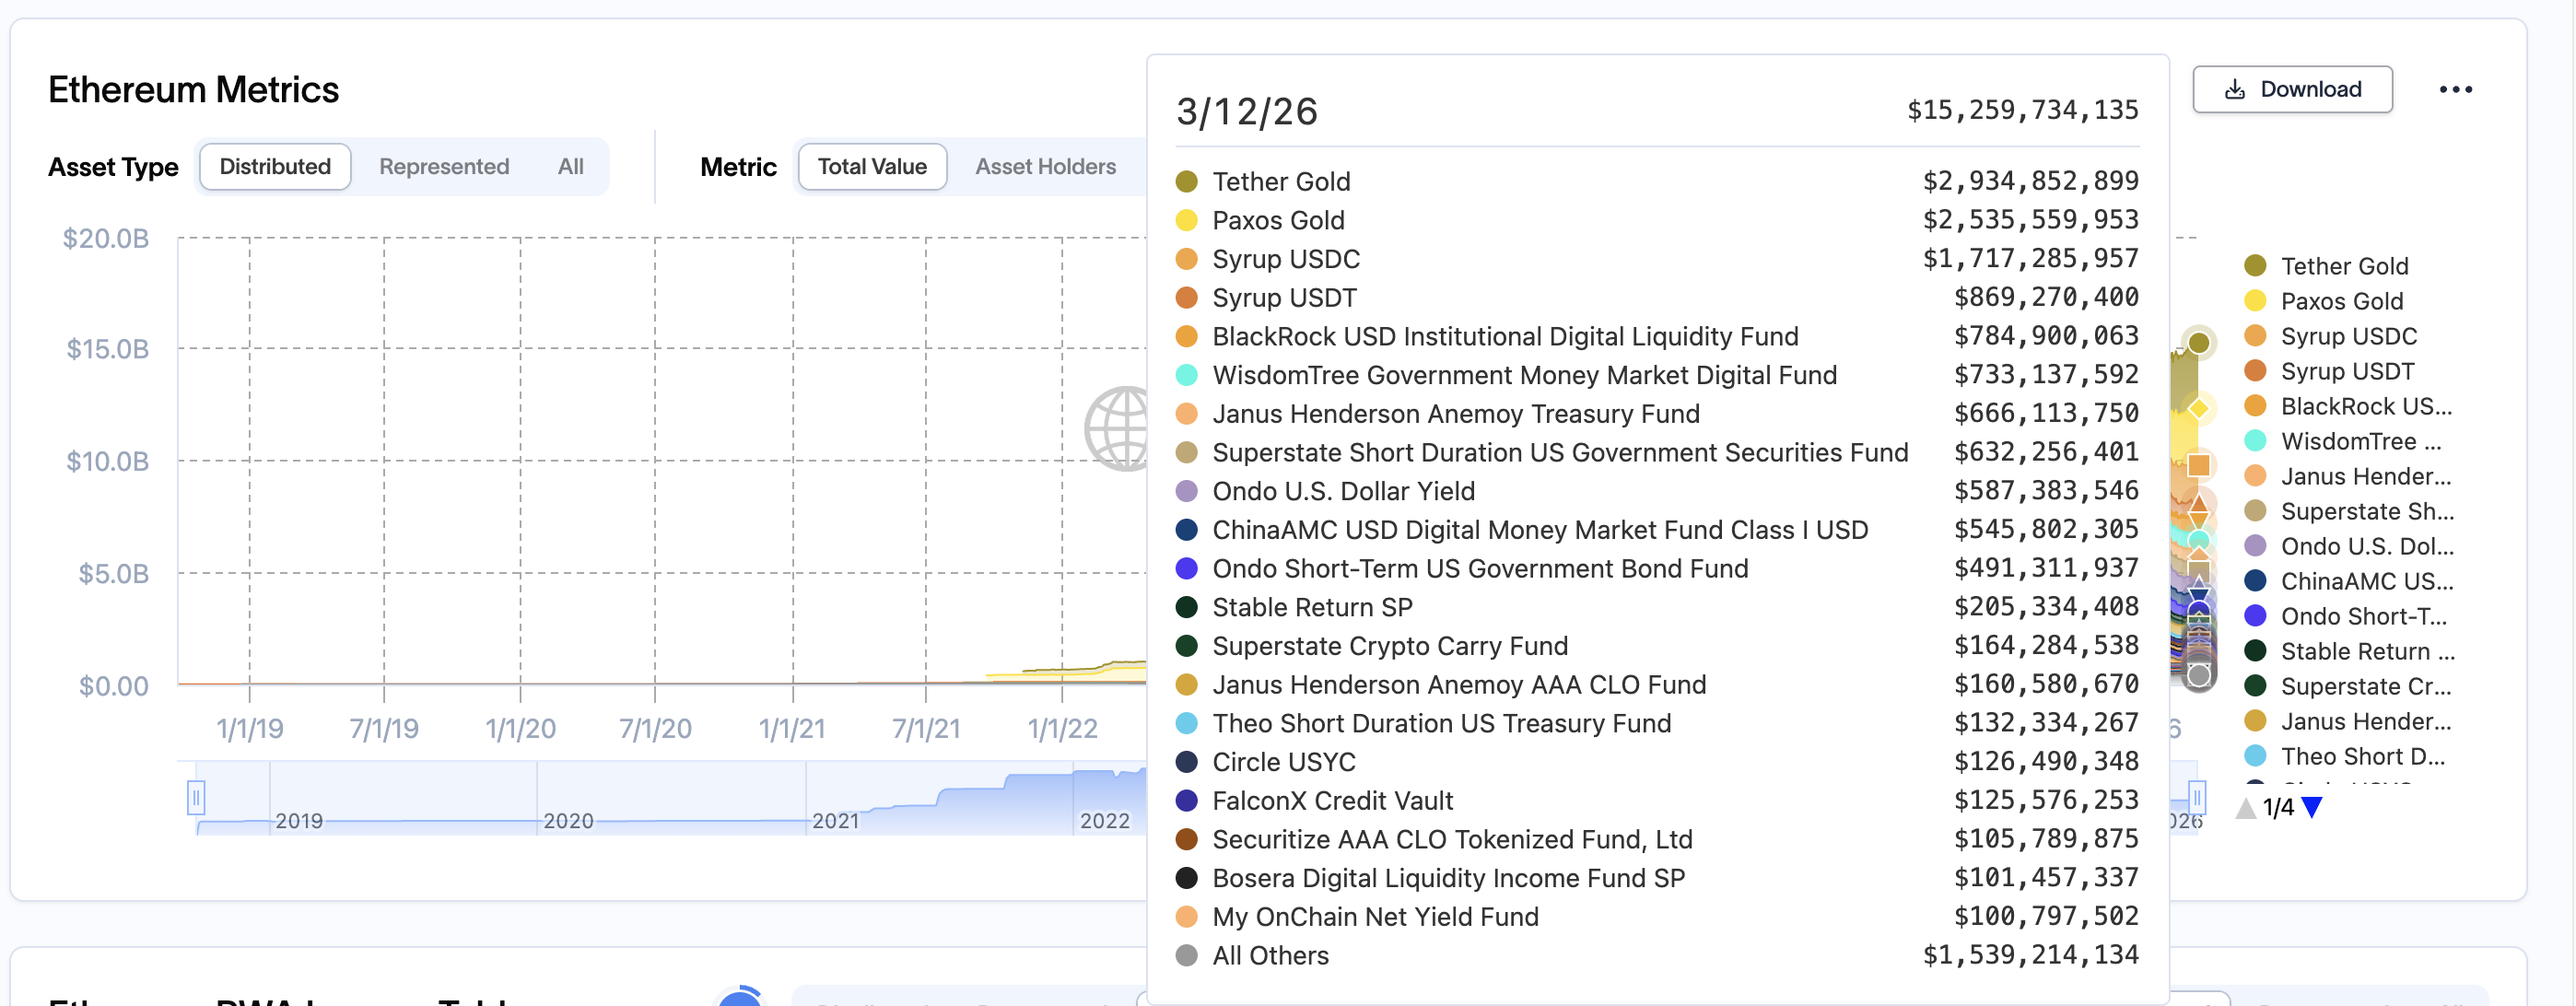 Projects On Ethereum: RWA.XYZ
In February 2026, it became tradable on Uniswap.
Ondo USDY, a tokenized yield product, grew from $36 million to $587 million over the same period.
Traditional asset managers, including WisdomTree, Janus Henderson, and ChinaAMC, have also launched tokenized funds on Ethereum, each now holding between $500 million and $730 million. None of these products existed on the network two years ago.
The institutional infrastructure is clearly expanding. The next question is whether that activity shows up in network-level demand.
On-Chain Signals Point to Quiet Accumulation
Despite price weakness, on-chain data reveals aggressive positioning by large holders, post the tokenization boom.
Since March 2024 (BUIDL’s foray), whale wallets (supply held by whales, excluding exchange holdings) grew from 93.24 million ETH to 120.42 million ETH, a 29% increase.
The accumulation turned aggressive from November 2025 onward, with whales adding roughly 20 million ETH over the next 4 months.
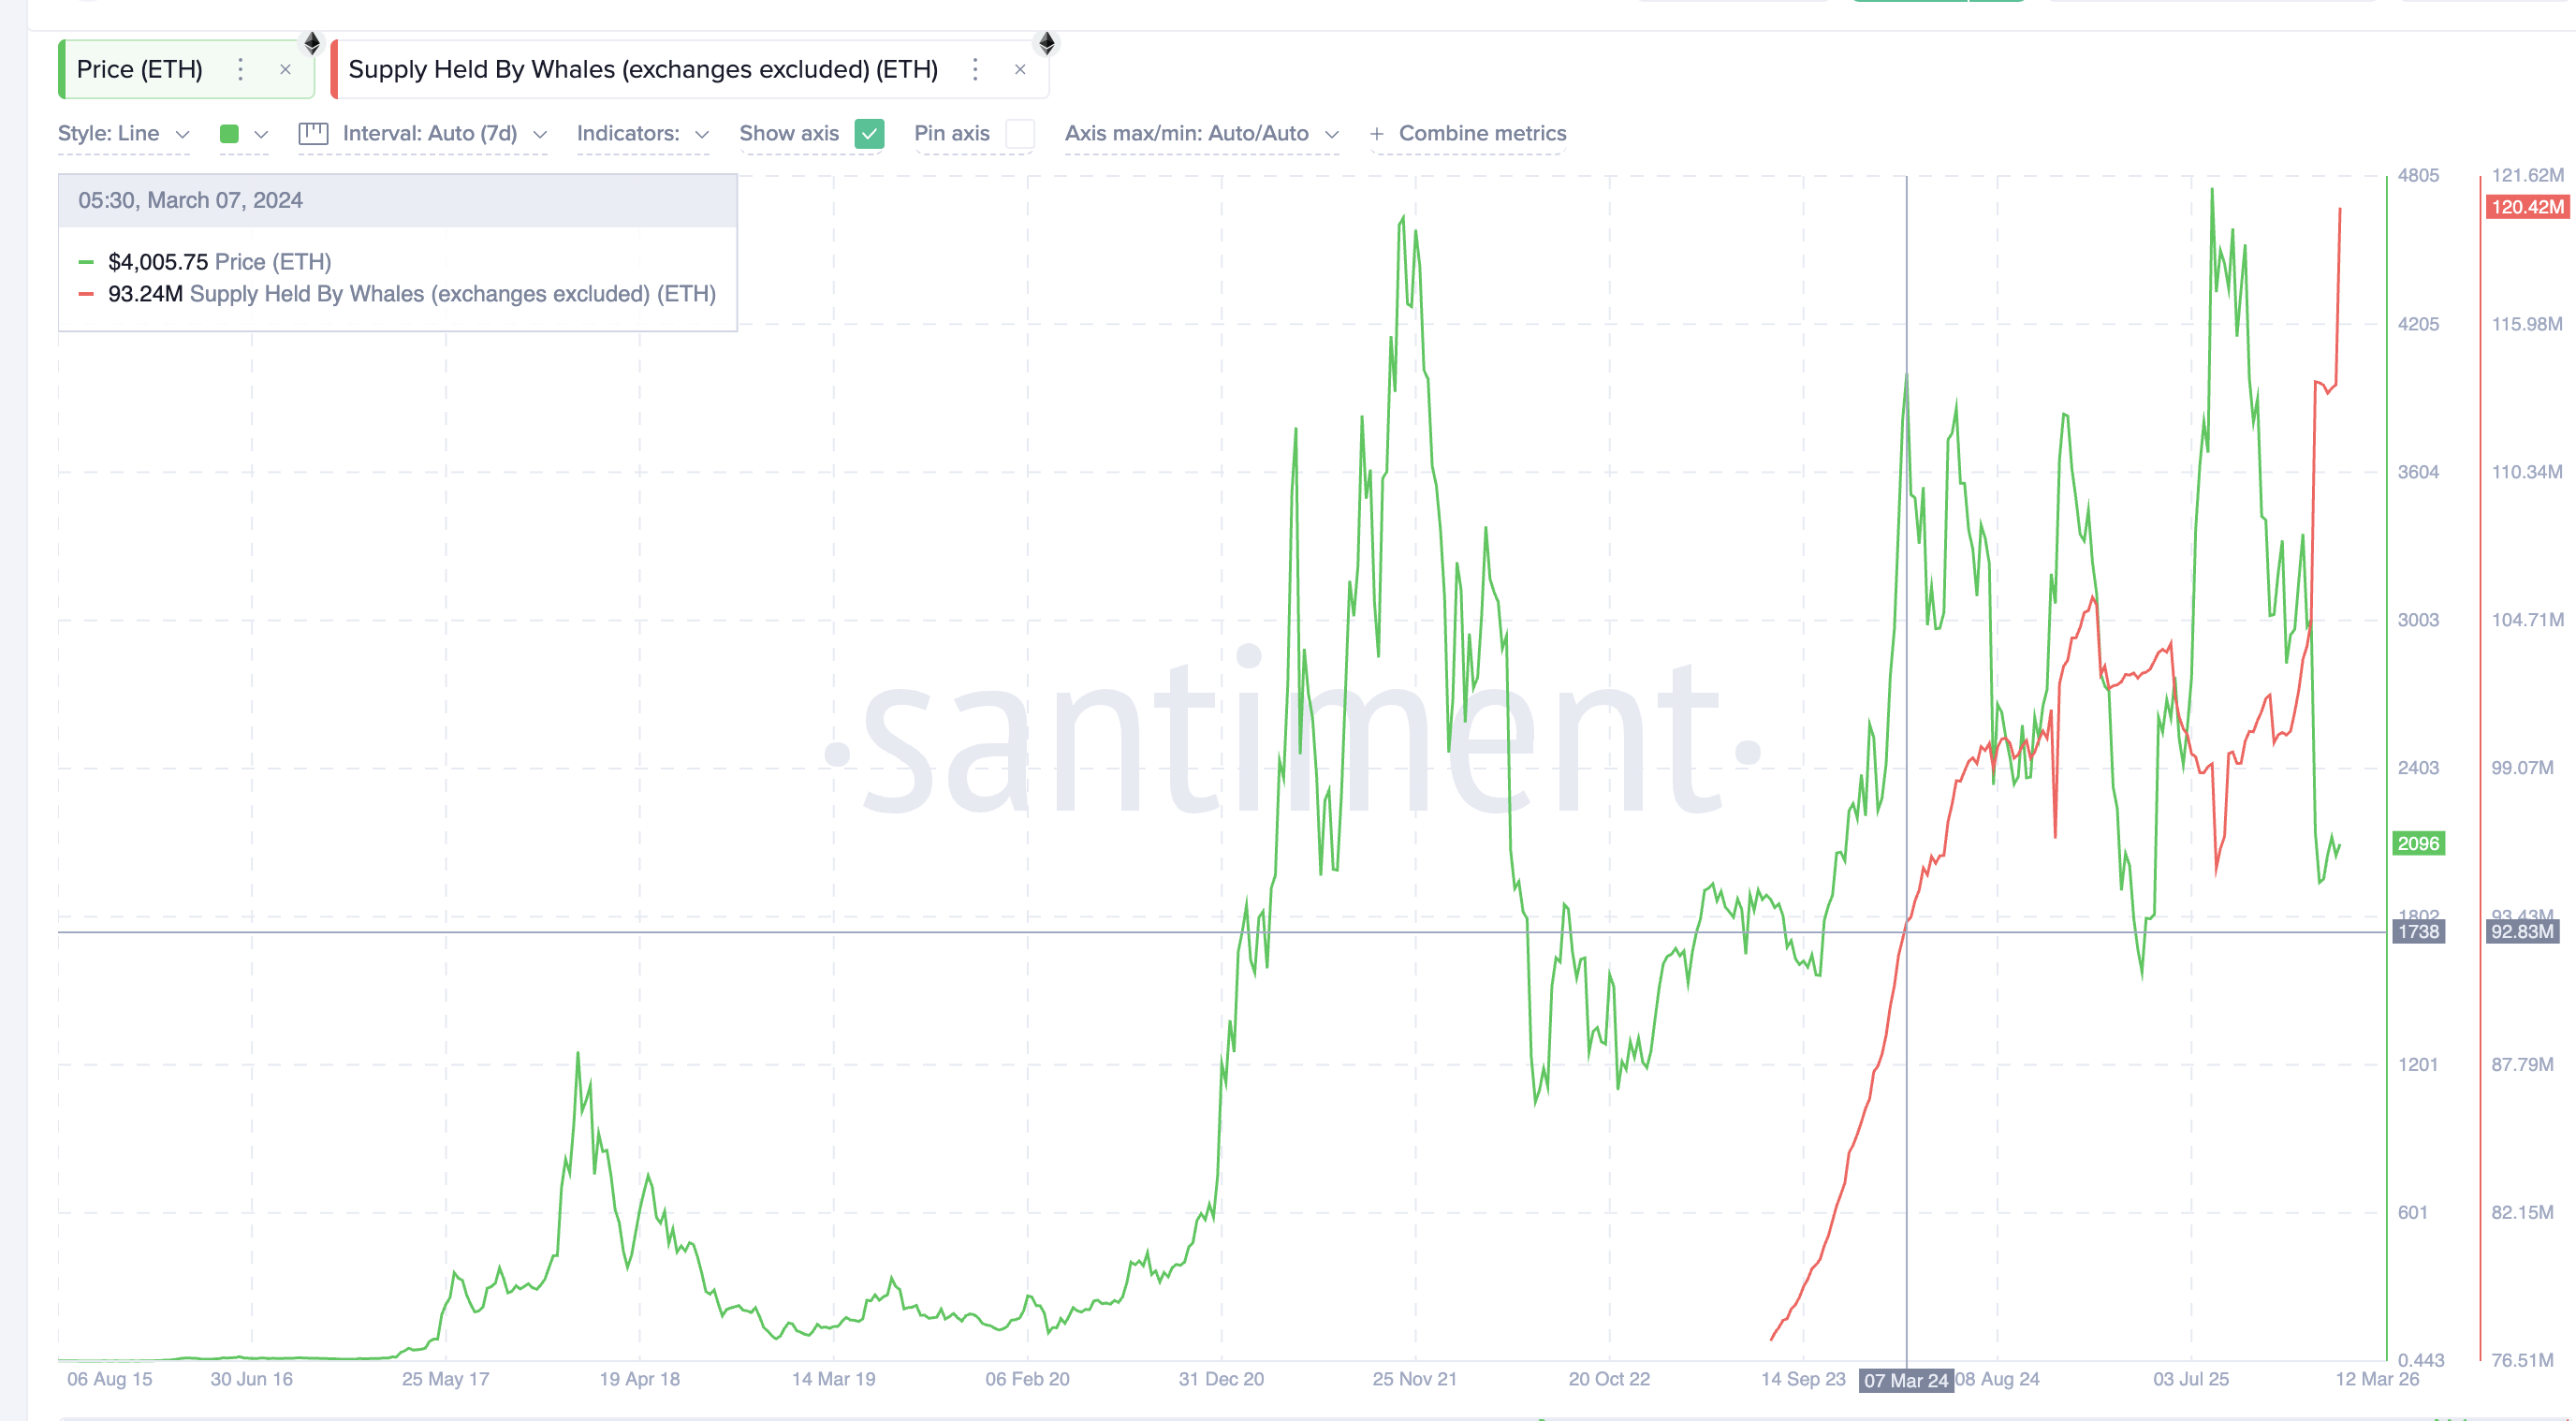 Ethereum Price And Whales: Santiment
During the same window, ETH on exchanges dropped from 18.76 million to 14.39 million, a 23% decline, according to Glassnode.
A sustained decline signals holders are moving ETH into cold storage or staking rather than preparing to sell.
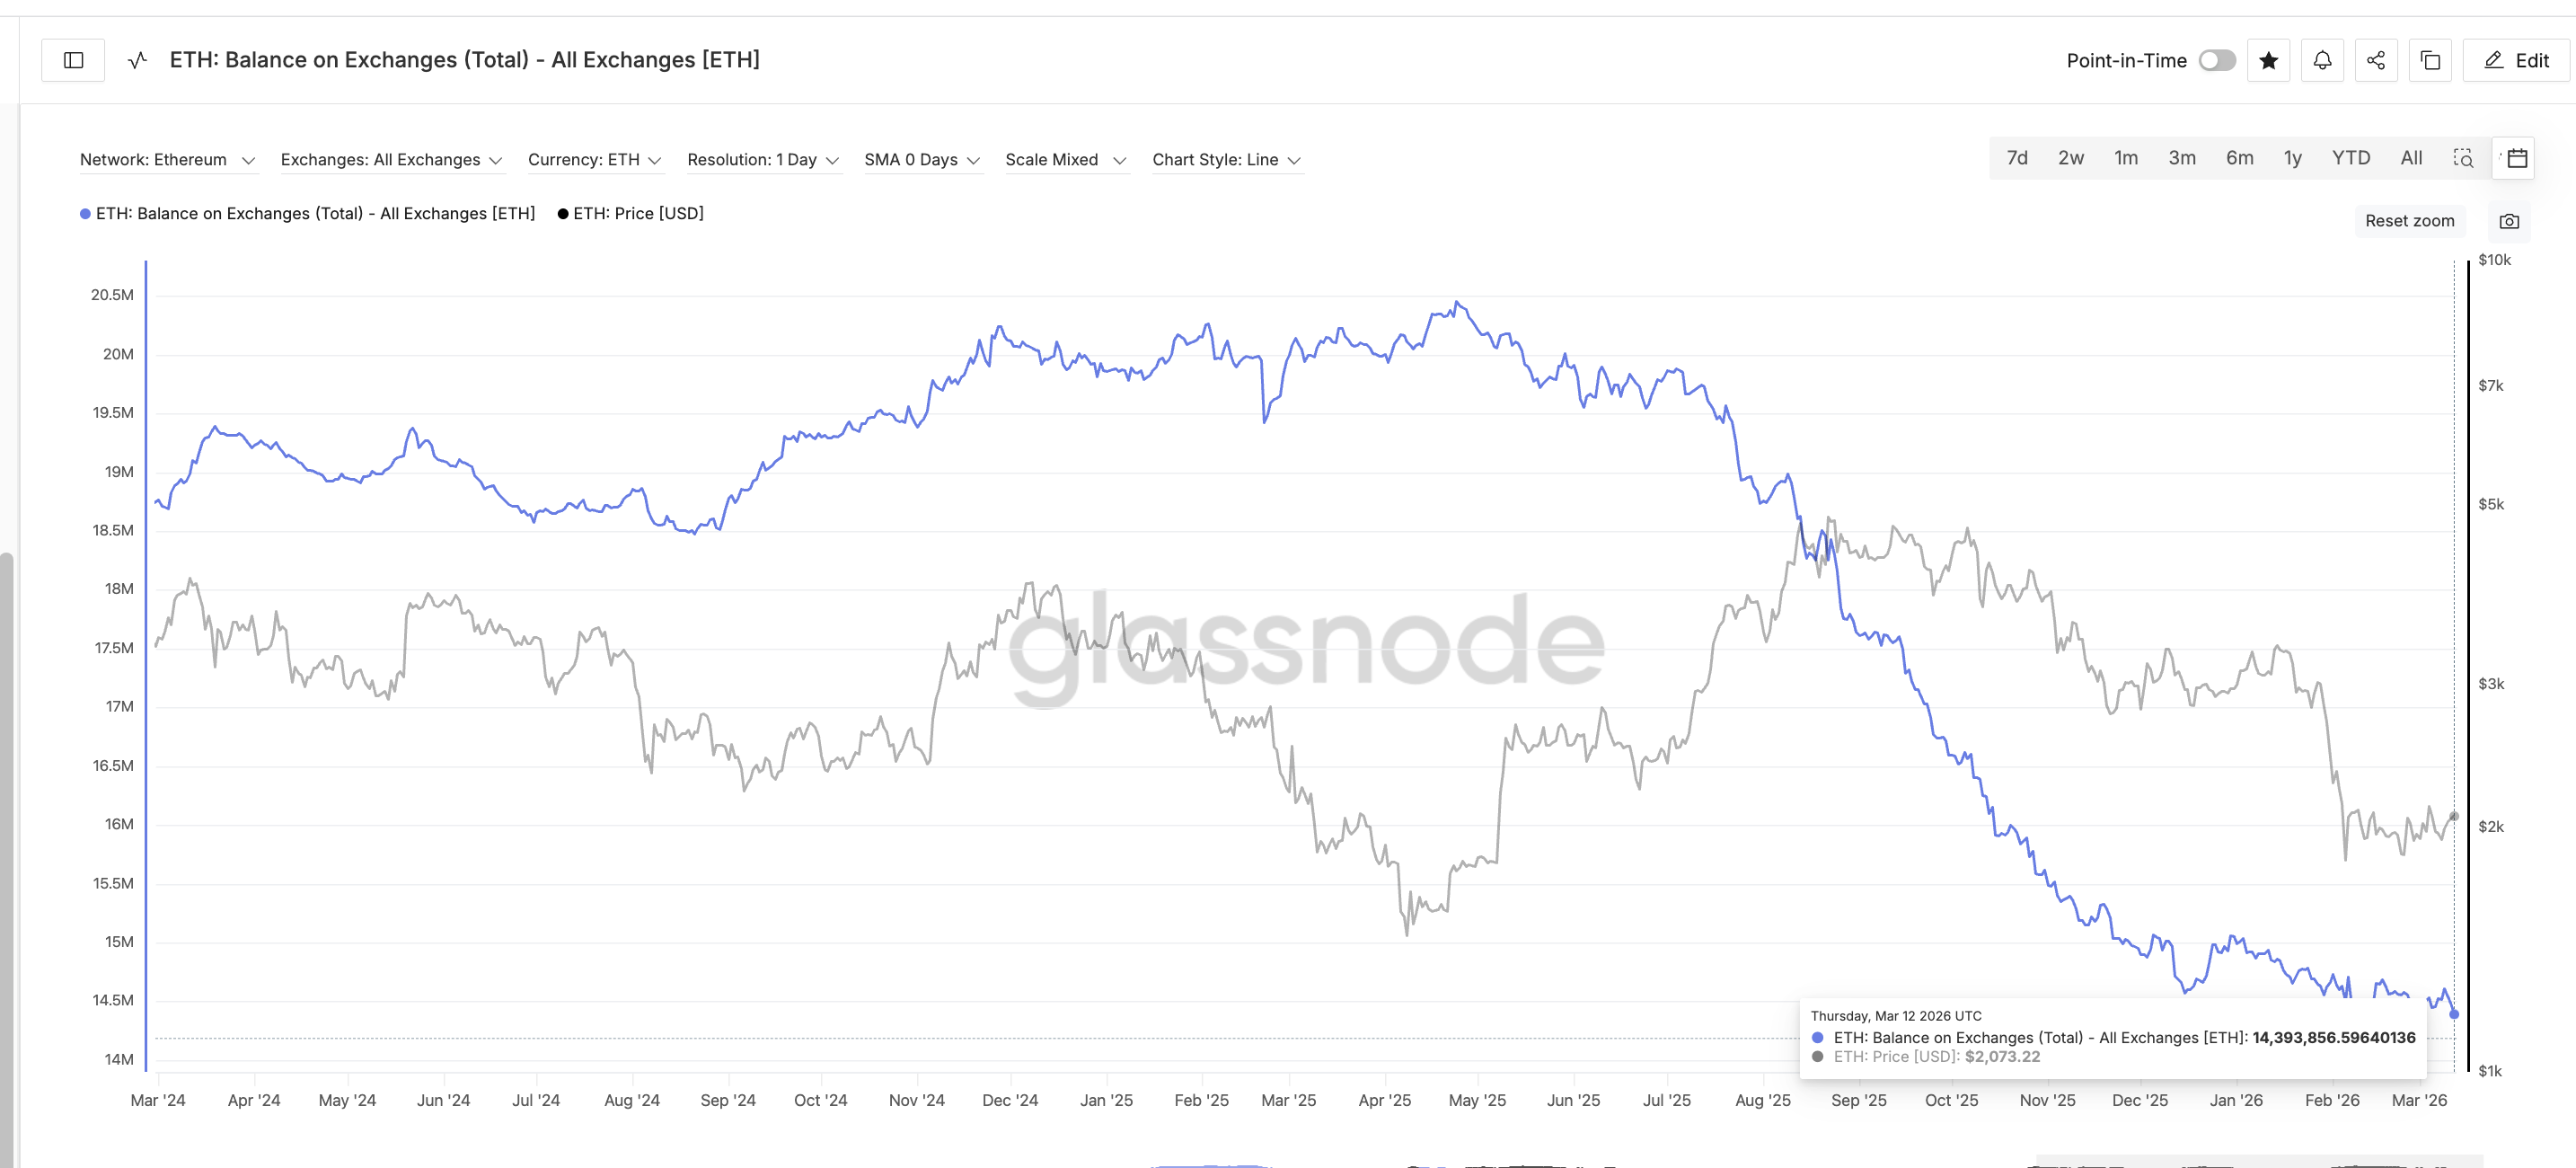 Exchange Balance: Glassnode
The gap between the two numbers reveals a redistribution. Whales absorbed approximately 27 million ETH while only 4.4 million were left on exchanges.
The majority of accumulation came from smaller holders selling to larger buyers, a supply transfer pattern that typically appears before major price moves.
Matt Hougan, Chief Investment Officer at Bitwise Asset Management, offered a structural reason why this accumulation may continue:
“My ultimate view is that permissionless, open architecture of blockchains will win”, said Matt Hougan from Bitwise.
Ethereum’s permissionless design is exactly what sets it apart from private blockchain alternatives and continues to draw institutional builders and capital to the network.
That institutional activity on Ethereum’s mainnet also feeds directly into Ethereum’s supply mechanics.
Ethereum’s EIP-1559 upgrade destroys a portion of every mainnet transaction fee, reducing circulating supply.
Since the Dencun upgrade, most activity shifted to Layer 2 networks, keeping ETH’s inflation rate around 0.75% per Glassnode.
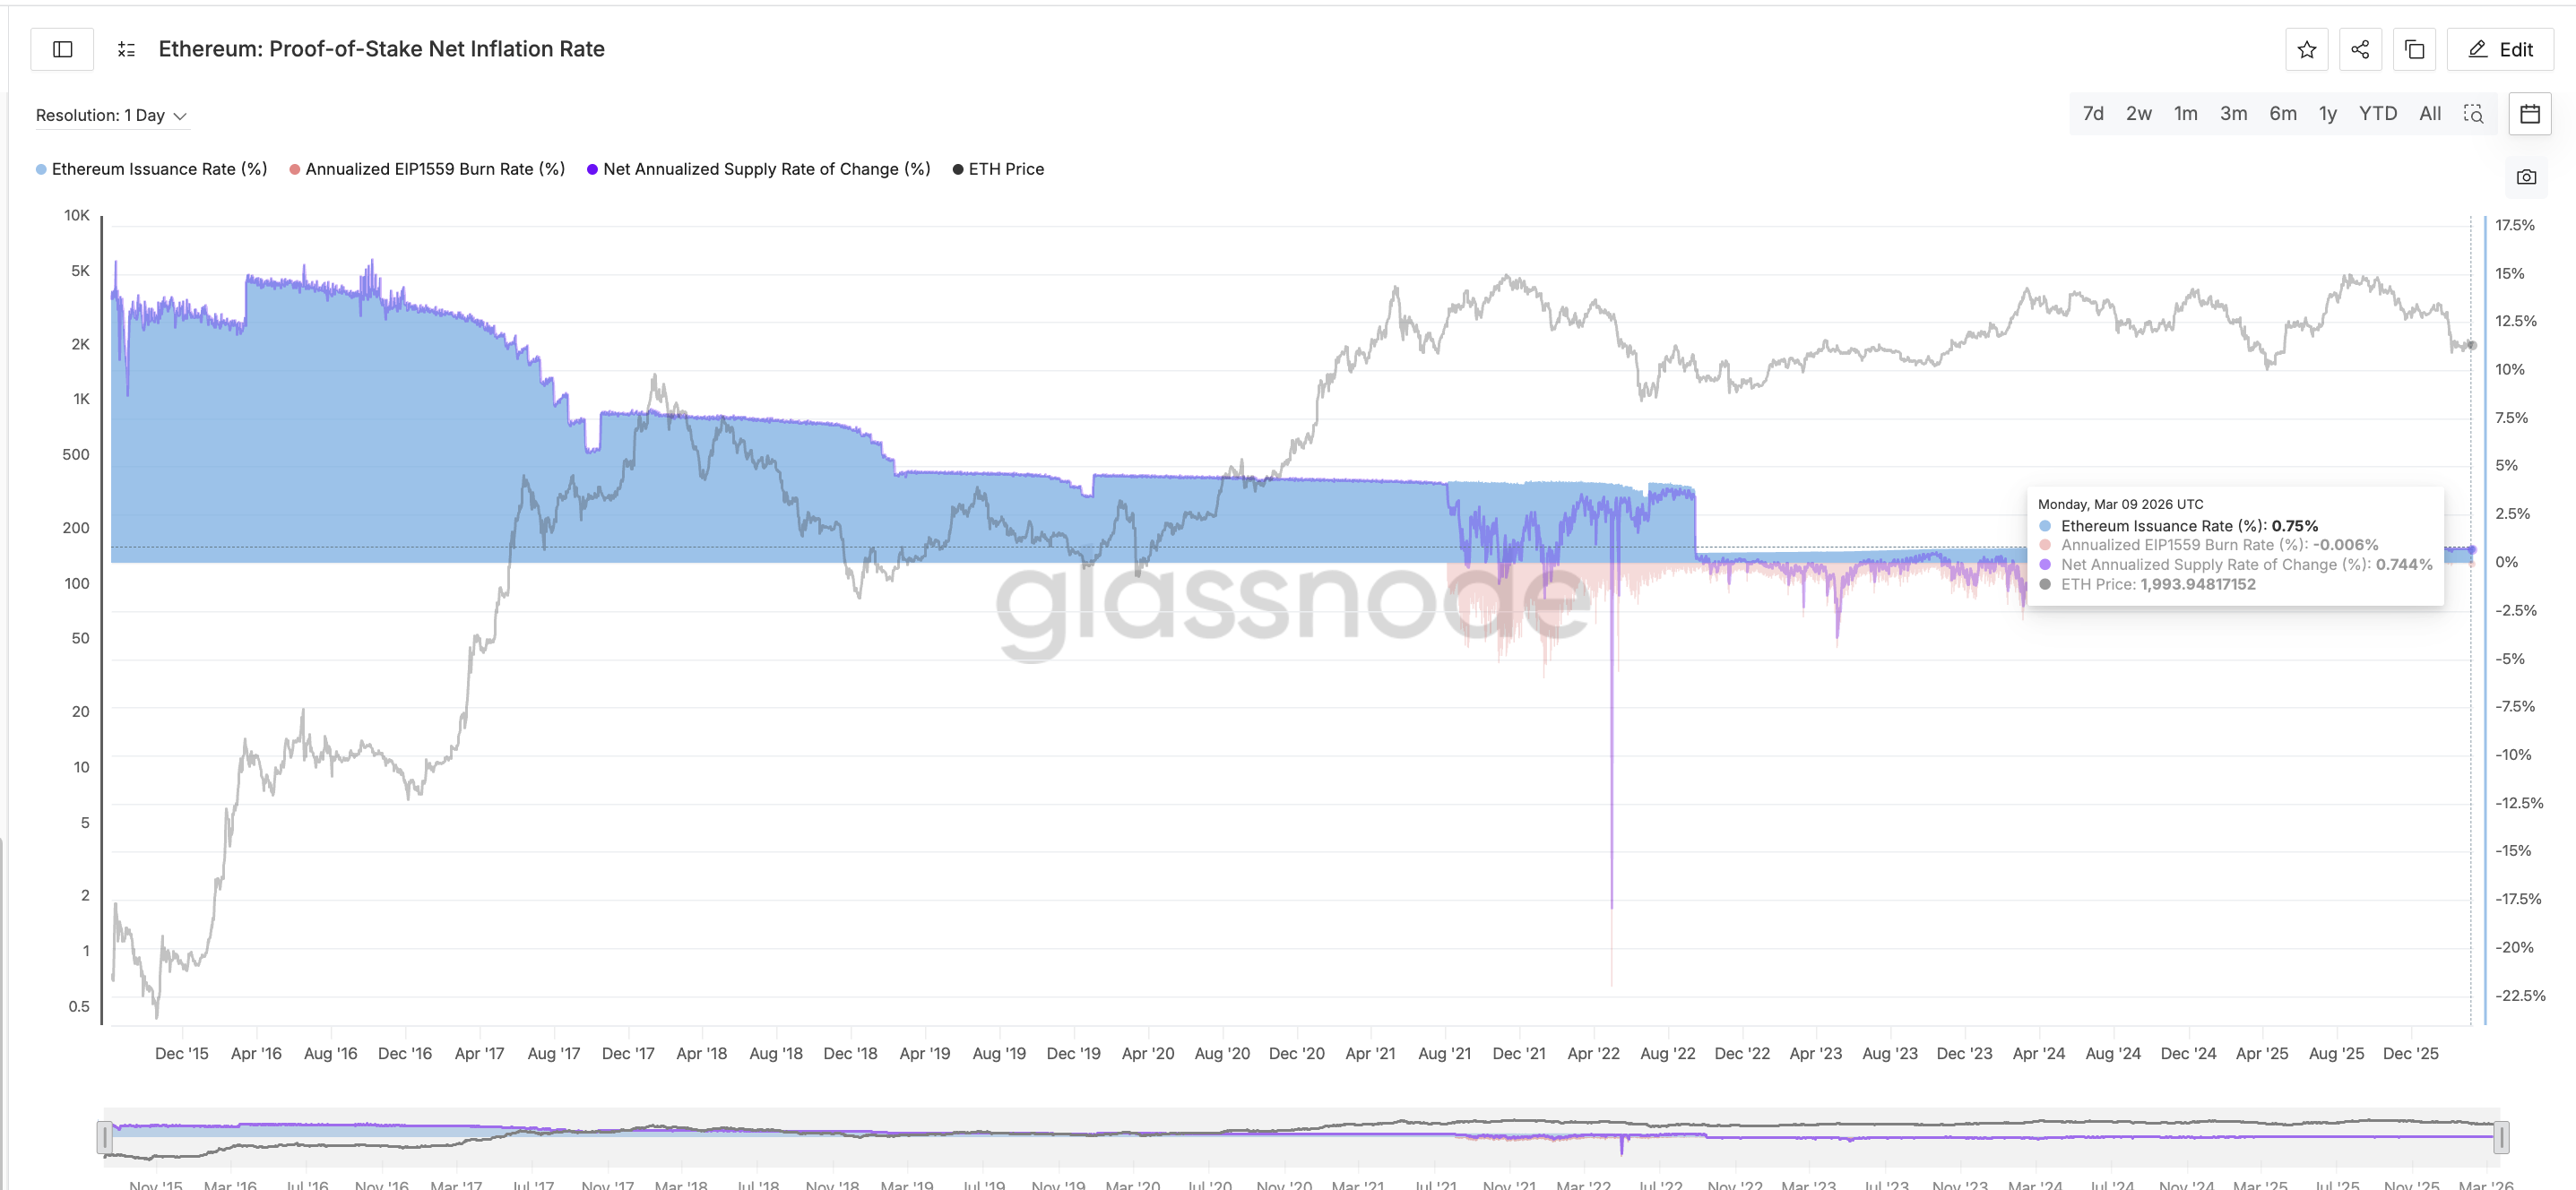 ETH Issuance Rate: Glassnode
Tokenization products like BUIDL settle directly on Ethereum’s mainnet (verifiable on Etherscan), generating the kind of high-value transaction activity that could push burn rates higher and tighten supply.
When supply tightens against steady or rising demand, the price follows.
The fundamentals are building. But the weekly price chart reveals why none of it has mattered to the price yet.
Weekly Ethereum Price Chart Structure Remains Bearish
On the weekly timeframe, ETH formed an inverted cup-and-handle pattern between April and November 2025. The cup’s rim and the handle’s descending trendline share an upsloping neckline, making the breakdown all the more impactful.
The breakdown came on January 19, 2026. Based on the cup’s vertical distance of approximately 56%, the measured move projects a downside target near $1,290.
ETH currently trades around $2,100, below both the 50-week and 200-week exponential moving averages (EMAs).
An exponential moving average is a trend-following indicator that places greater weight on recent price data. Trading below both weekly EMAs confirms medium-term momentum has turned negative.
Want more token insights like this? Sign up for Editor Harsh Notariya’s Daily Crypto Newsletter here.
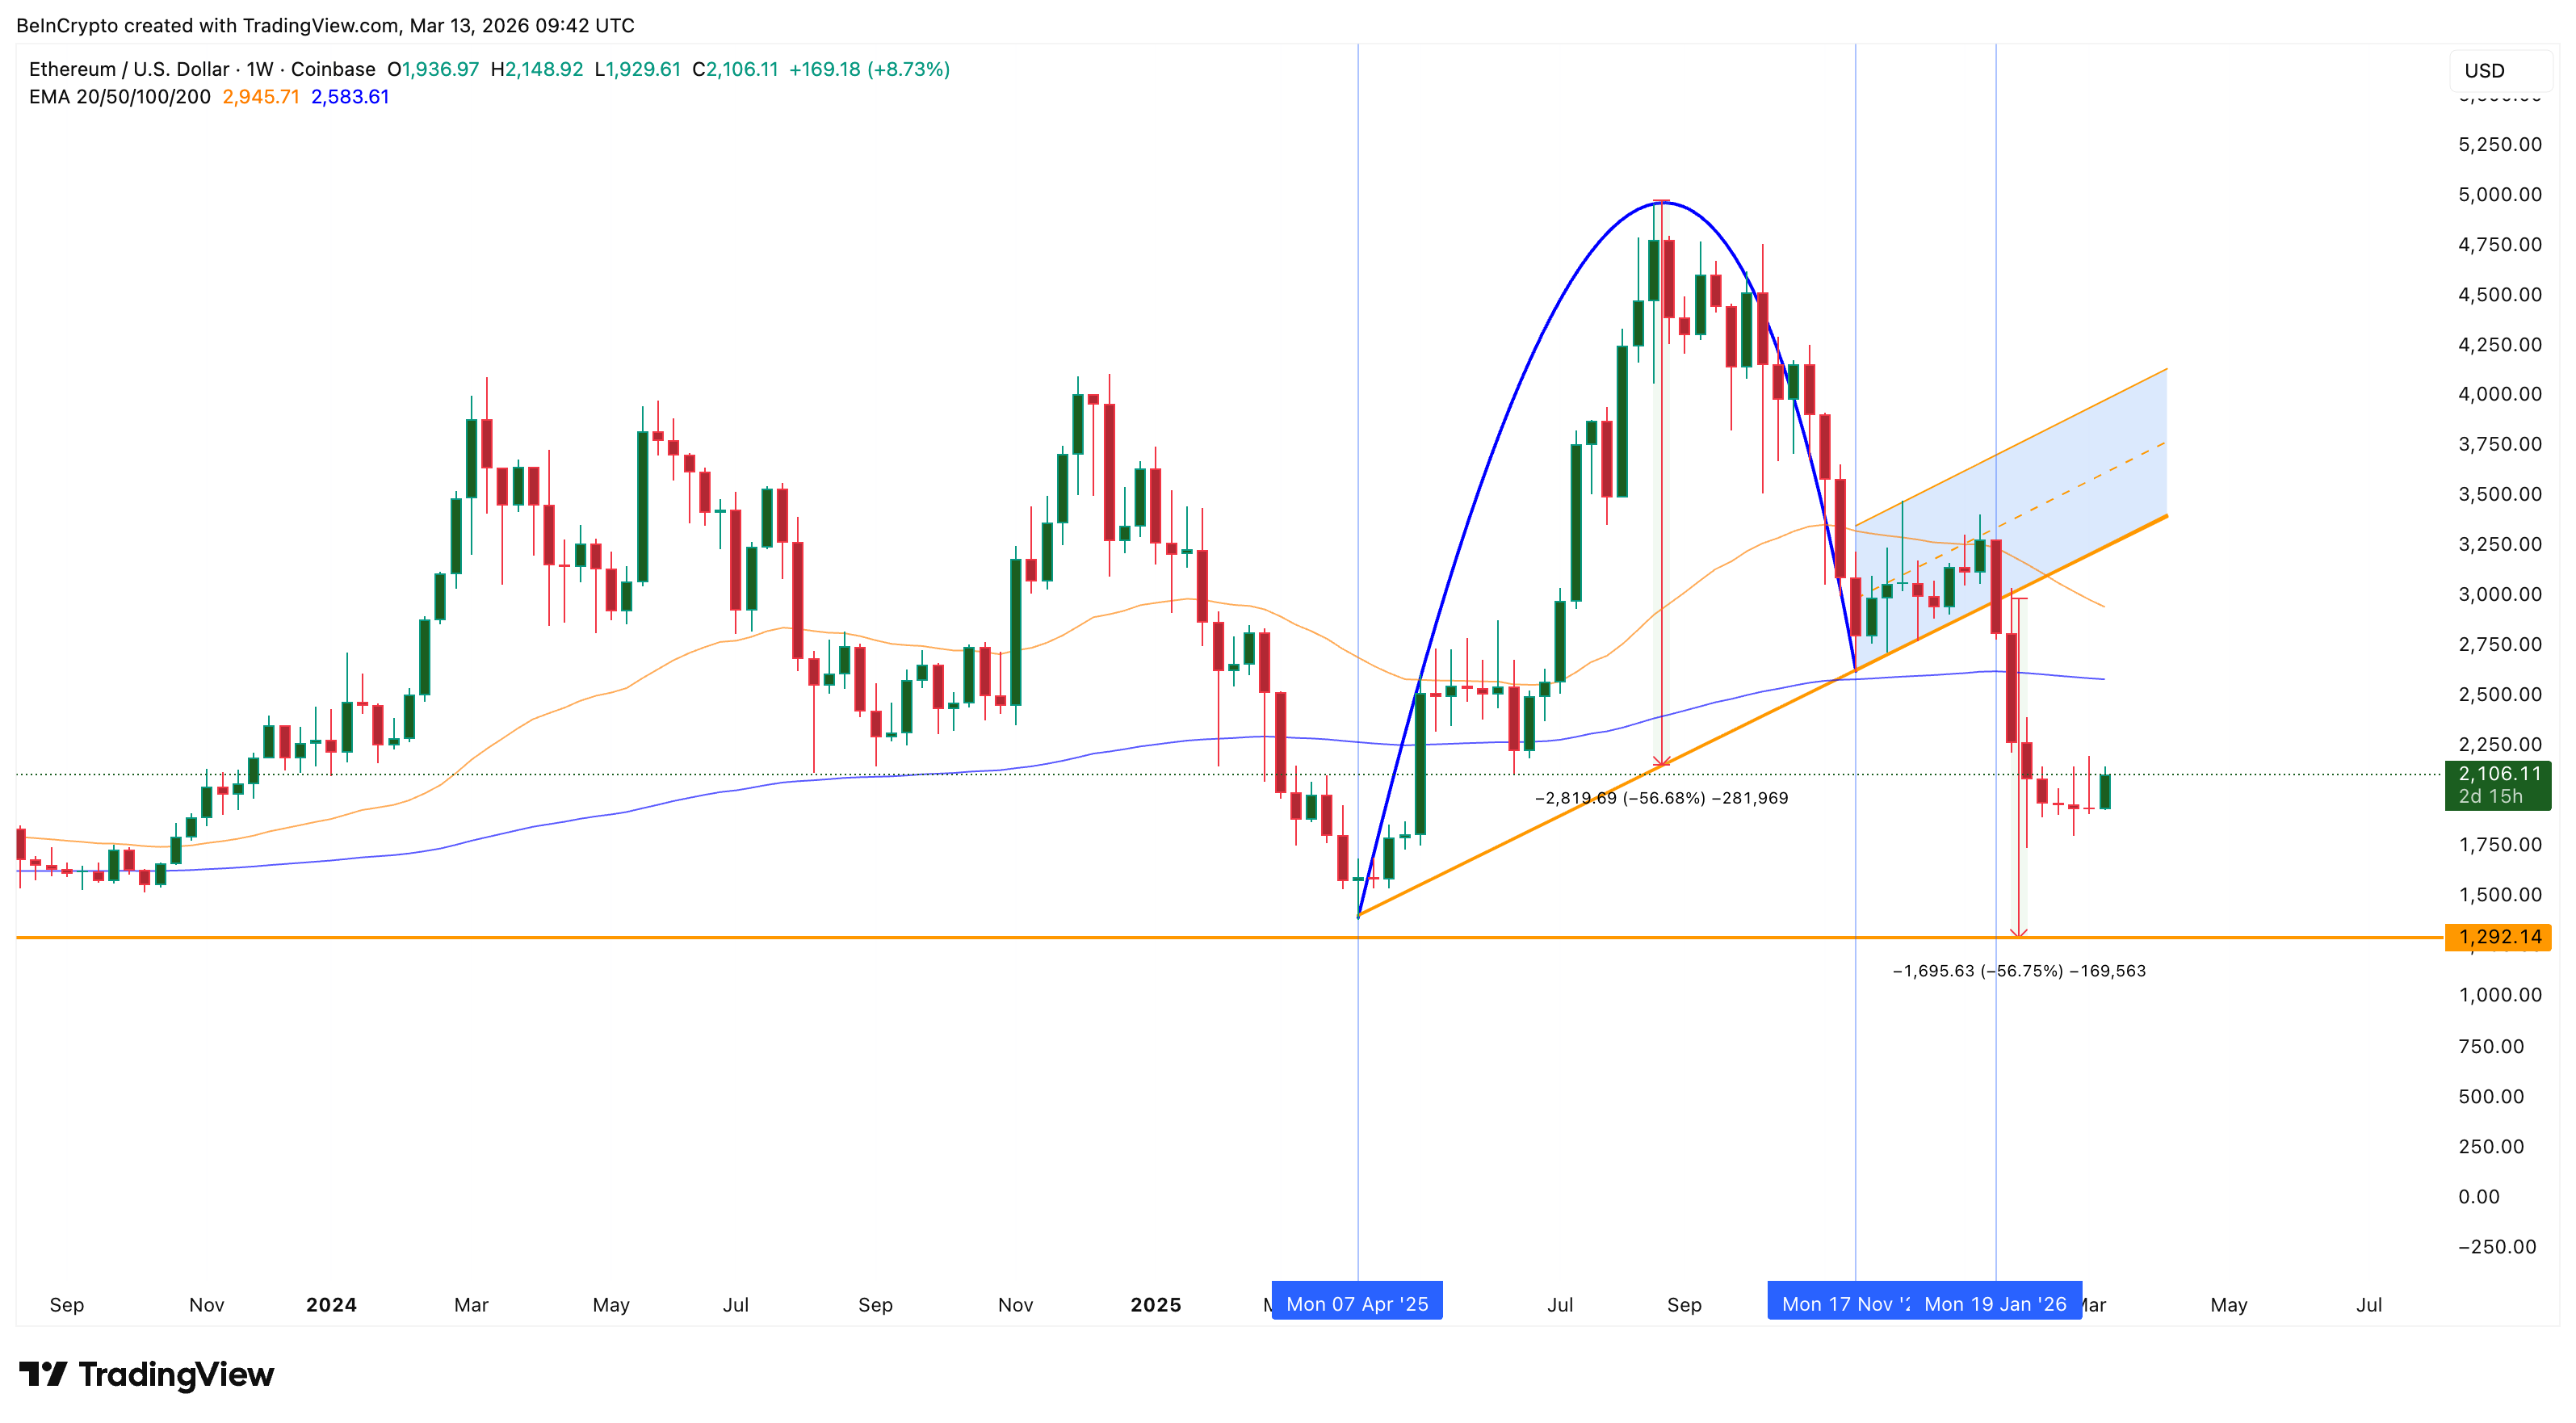 Ethereum Price Structure: TradingView
The monthly timeframe offers a counterpoint, though. Since early 2024, ETH has traded inside an ascending channel. Price recently bounced off the lower trendline, holding the broader structure.
That suggests the projected drop in the weekly timeframe is not a structural breakdown but a retest of long-term support, or rather something like ‘bottom-huntin’.
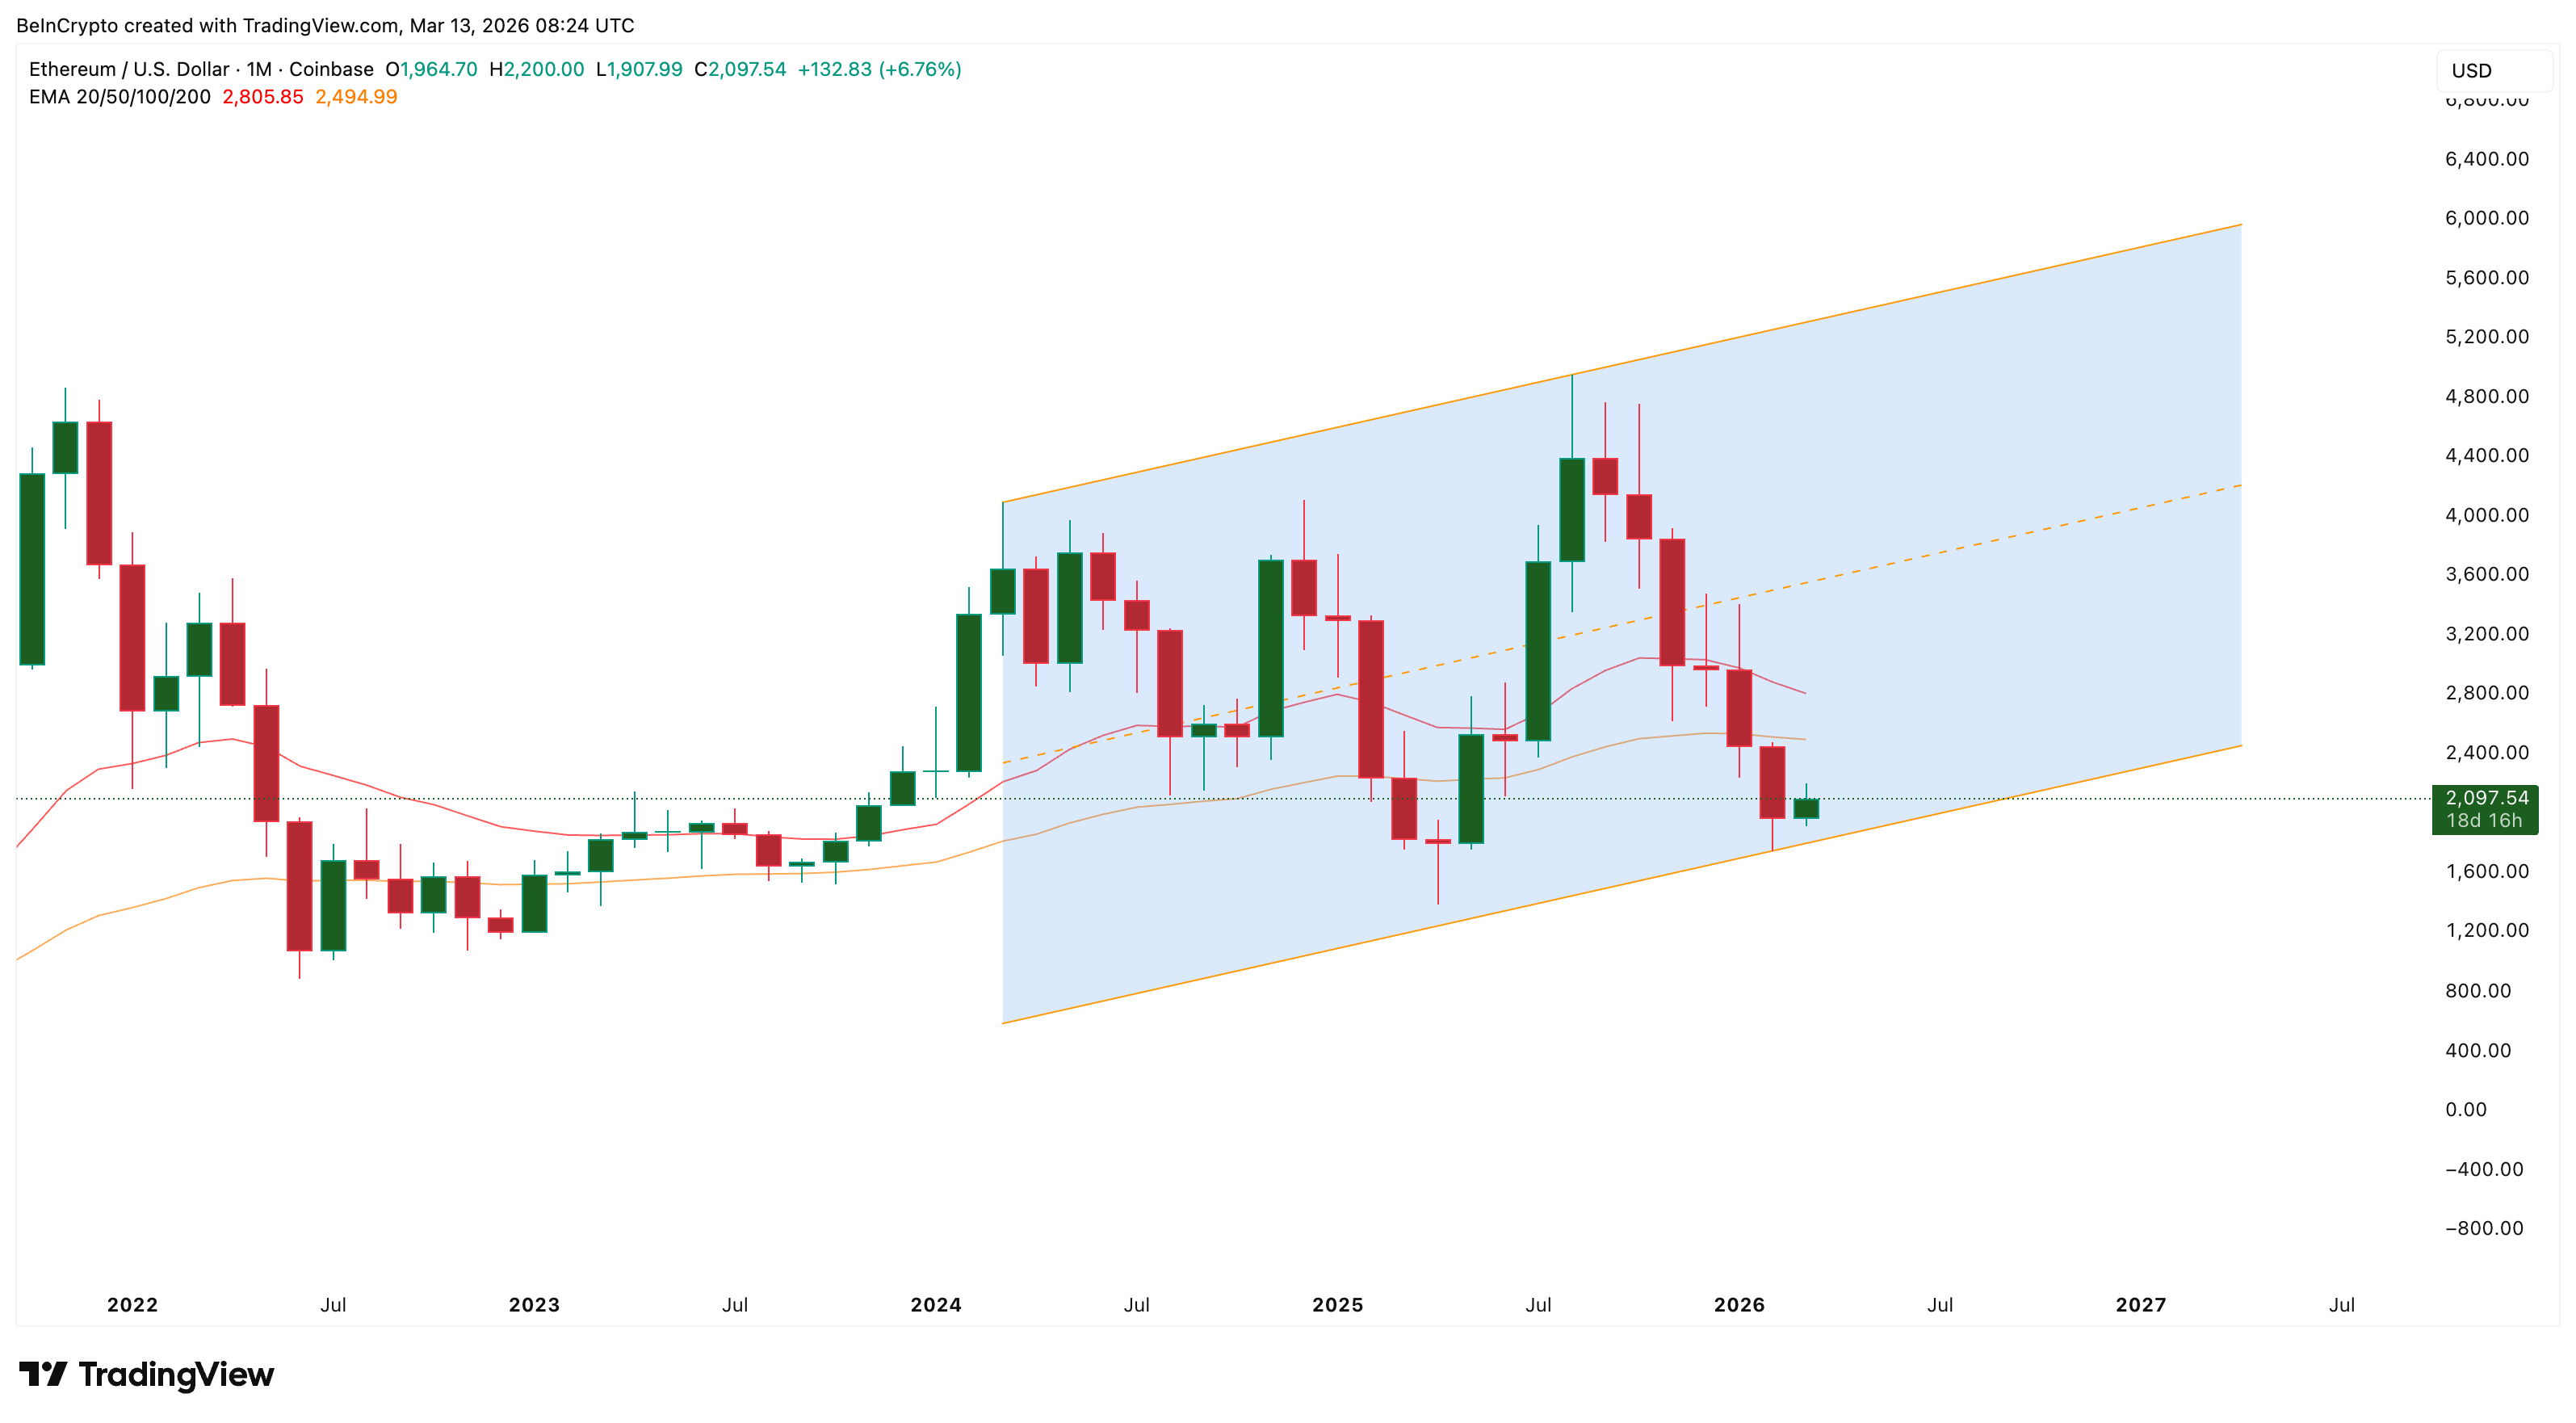 ETH Price And Monthly Chart: TradingView
The weekly warns of further downside. The monthly chart says the floor has a foundation. The next step is identifying where these levels cluster.
Where Could the ETH Price Bottom Form?
Using a trend-based Fibonacci extension, which projects price targets by measuring proportional distances between prior swing points, the downside levels are clearly defined. The extension runs from the August 2025 high to the November low, and then to the December bounce.
ETH recently broke below $2,020, the 0.618 Fibonacci level, and one of the strongest weekly supports below.
Next support sits at $1,630. Below that, $1,380 marks the April 2025 cycle low, and $1,290 aligns with the inverted cup-and-handle target. If selling extends further, $1,120, the full 1.0 extension, represents the worst-case floor.
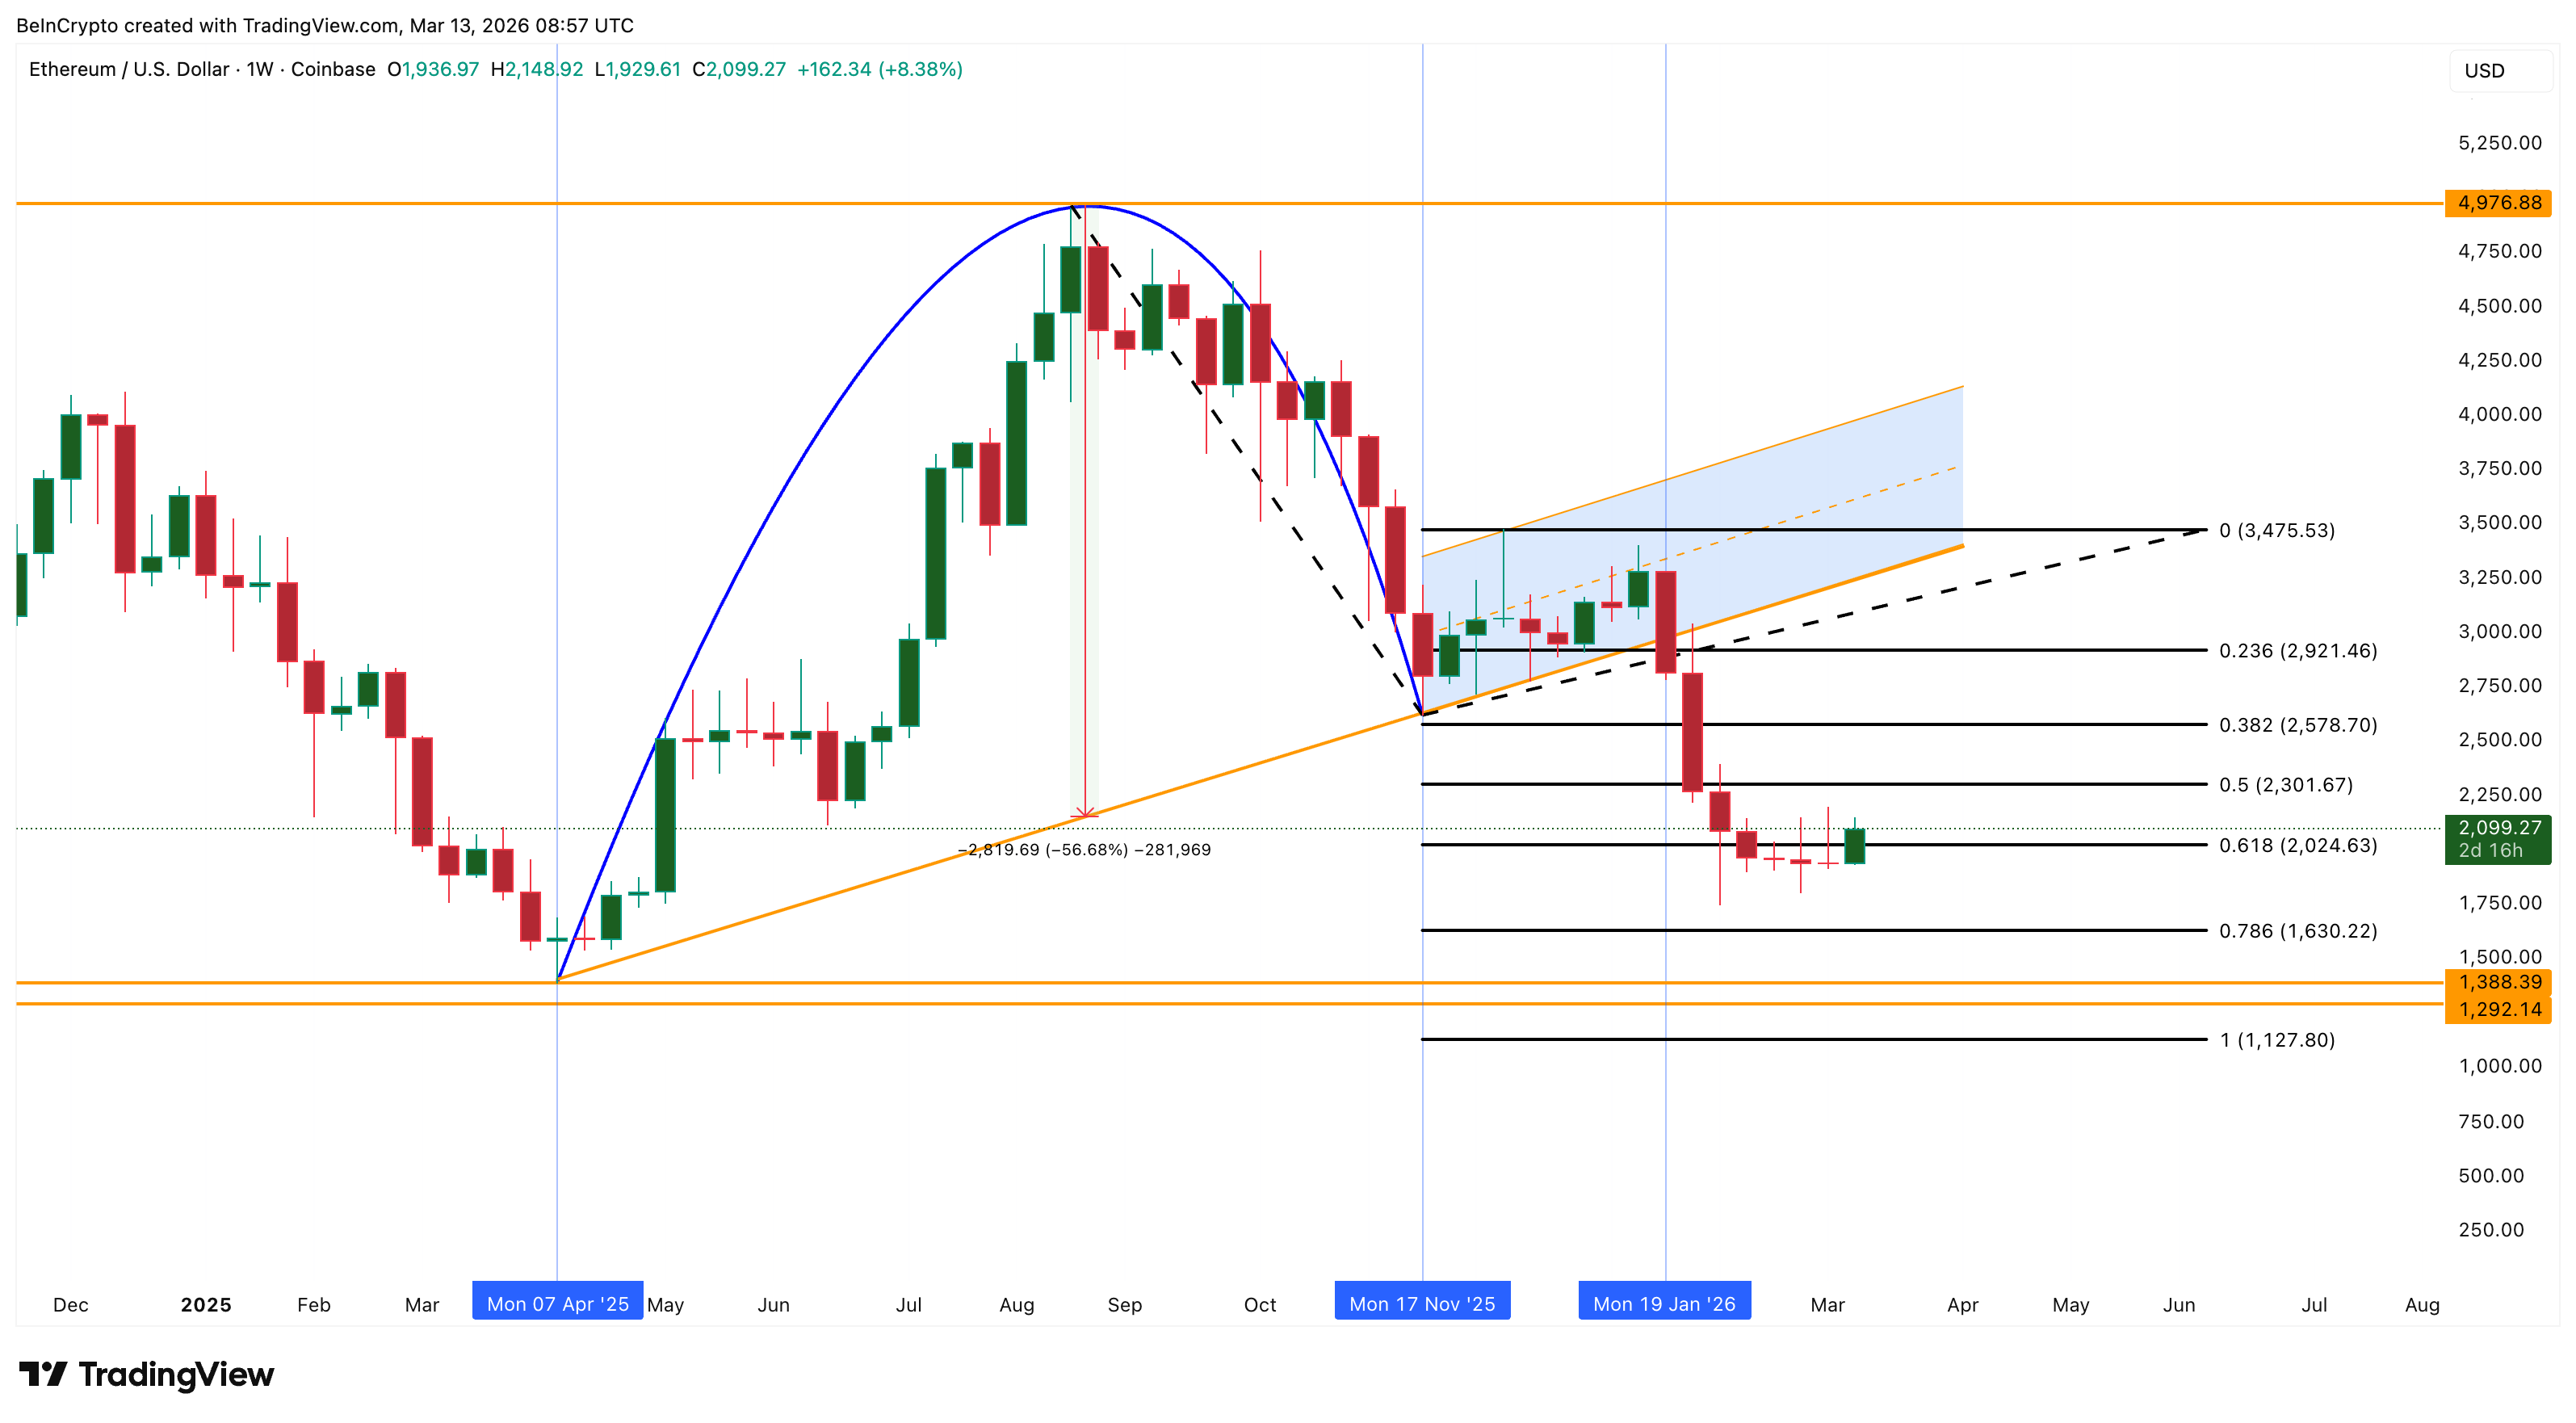 Ethereum Price Analysis: TradingView
For recovery, the Ethereum price needs to reclaim $2,570, then $2,920, and ultimately $3,470. Only above $3,470 does the weekly structure shift from bearish to neutral.
A close above $4,970 would signal a full-cycle breakout.
The bottom formation is where tokenization could finally begin translating into price.
Standard Chartered’s Kendrick put it plainly:
“Ultimately, in the next couple of years, Ethereum will win that flow from TradFi and should outperform in token price as well,” he mentioned.
The on-chain trajectory supports that view. The price needs to find its floor first.
Ethereum holds $15 billion in tokenized assets, whale accumulation sits at multi-year highs, and exchange supply is at two-year lows. The infrastructure is ready. What is missing is a macro catalyst.
The Federal Reserve holds rates at 3.5% to 3.75%, with cuts only projected later in 2026. ETH staking, the process of locking ETH to secure the network in exchange for yield, currently returns at over 3%. US Treasury yields sit near 4.2%.
As cuts arrive and that gap narrows (treasury yields going down), institutions already on Ethereum for tokenization gain a second incentive to hold ETH: competitive yield alongside infrastructure access.
And rising tokenization volumes could also push the burn rate higher, gradually reversing ETH’s mild inflation and restoring deflationary dynamics that have historically supported price.
Recommended Articles


