


Top Crypto Losers: Zcash, Pump.fun, and LayerZero extended losses as Bitcoin loses $65,000
- Zcash is down 5% on Monday, extending the 18% loss from last week.
- Pump.fun drops below a key support with nearly 7% loss on Monday after Sunday’s 5% fall.
- LayerZero slips over 5% so far on Monday, stretching Sunday’s 5% downside reversal from the 200-day EMA.
The cryptocurrency market starts the week in panic mode, with altcoins Zcash (ZEC), Pump.fun (PUMP), and LayerZero (ZR). Bitcoin falls below $65,000 as the US President Donald Trump regroups amid renewed trade policy risks. The technical outlook for ZEC, PUMP, and ZRO points to downside risk amid increased bearish momentum.
Zcash extends pullback after a bearish week
Zcash trades below $250, down 5% at the time of writing on Monday, extending the 18% loss from the previous week and bringing the total to roughly 30%. However, the 38.2% Fibonacci retracement level at $231, measured from the August 20 low at $34.45 to the November 7 high at $750 on the daily logarithmic chart, serves as immediate support.
A decisive daily close below this level could extend the pullback toward the $187 support level, which previously triggered a bounce on February 6.
Still, the declining trend in the 50-day Exponential Moving Average (EMA) at $317, approaching the 200-day EMA at $295, flags the risk of a bearish death cross, which would trigger a sell signal. Meanwhile, the Zcash price is trading below the declining EMAs, reaffirming a short-term bearish bias.
The technical indicators on the daily chart suggest a renewed bearish momentum as buying pressure fades. The Relative Strength Index (RSI) at 37 falls toward the oversold zone as selling pressure increases. At the same time, the Moving Average Convergence Divergence (MACD) declines toward its signal line as positive histograms contract, risking a bearish crossover.
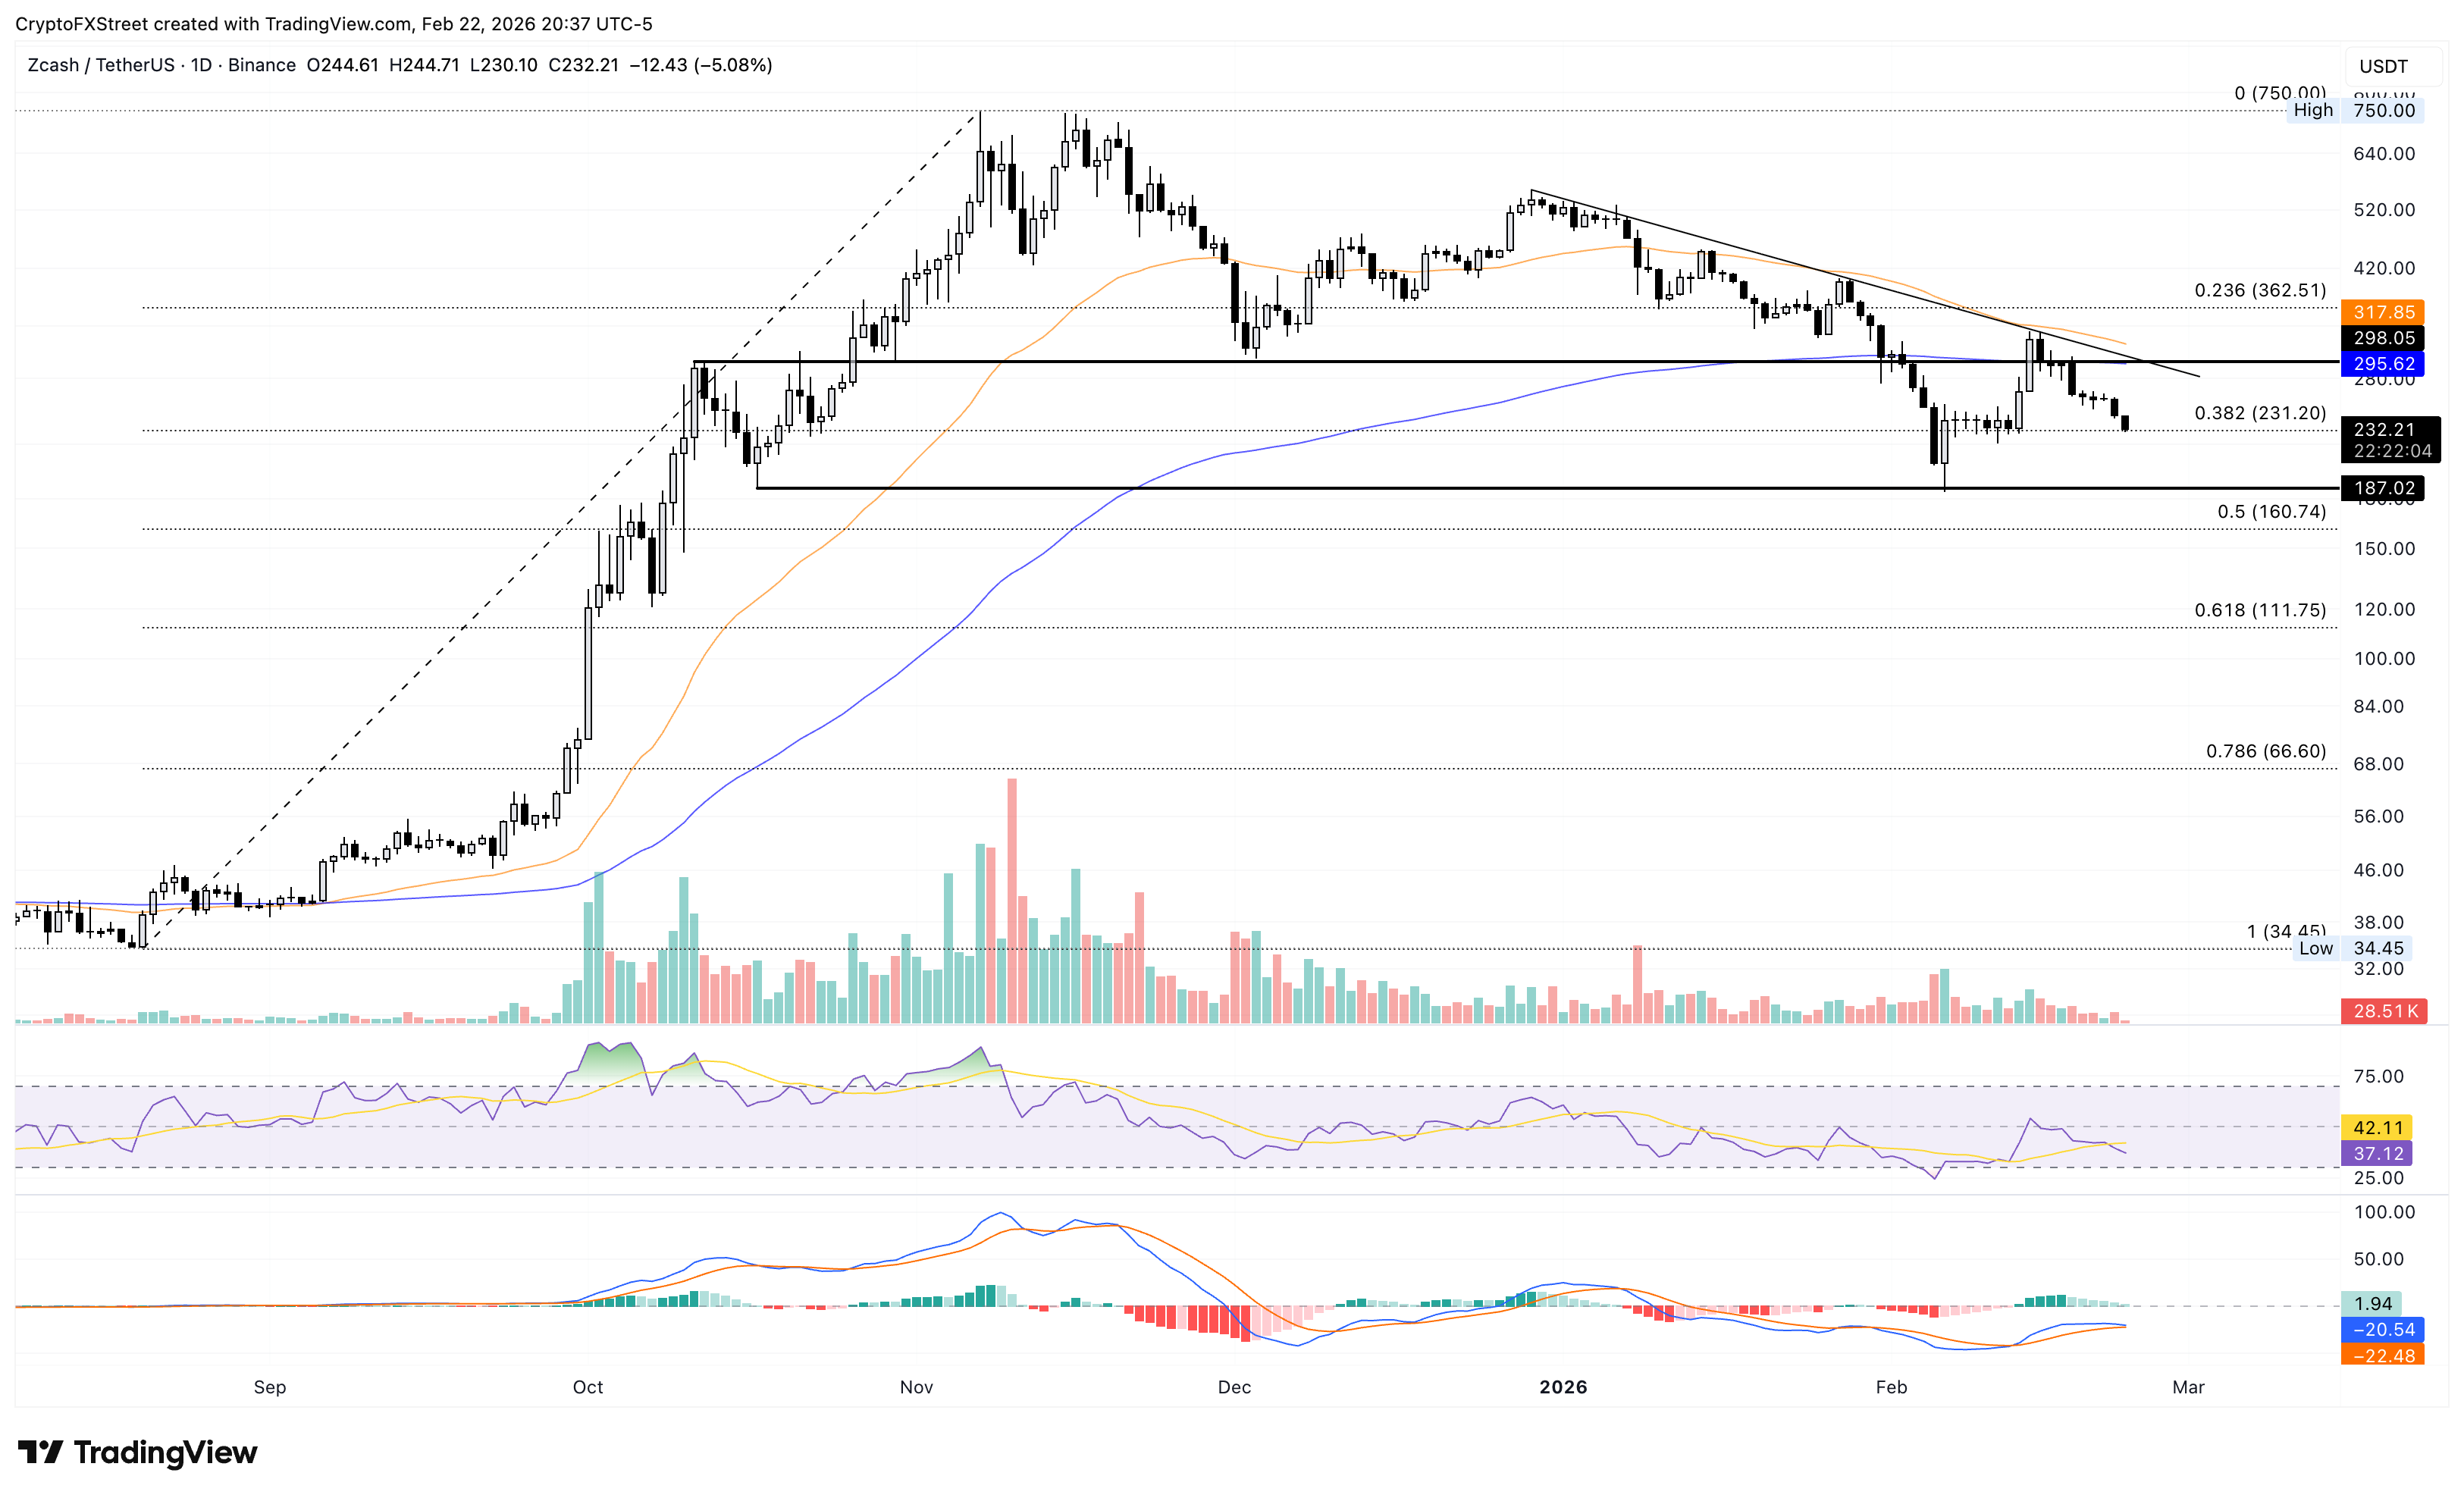
On the upside, a potential rebound from $231 could retest the 200-day EMA at $295.
Pump.fun slides further amid persistent selling pressure
Pump.fun extends a largely declining trend, with nearly a 7% loss at press time on Monday, below the crucial psychological support level of $0.002000. The path of least resistance targets the $0.001678 support level, marked by the December 24 low, which previously helped in a rebound on February 6.
A decisive close below $0.001678 could extend the decline toward the S2 pivot point at $0.001199.
The technical indicators on the daily chart suggest a bearish bias amid increasing selling pressure. The RSI at 39 edges lower from the halfway line with further room on the downside before reaching the oversold zone. At the same time, MACD crosses below its signal line, marking a bearish crossover.
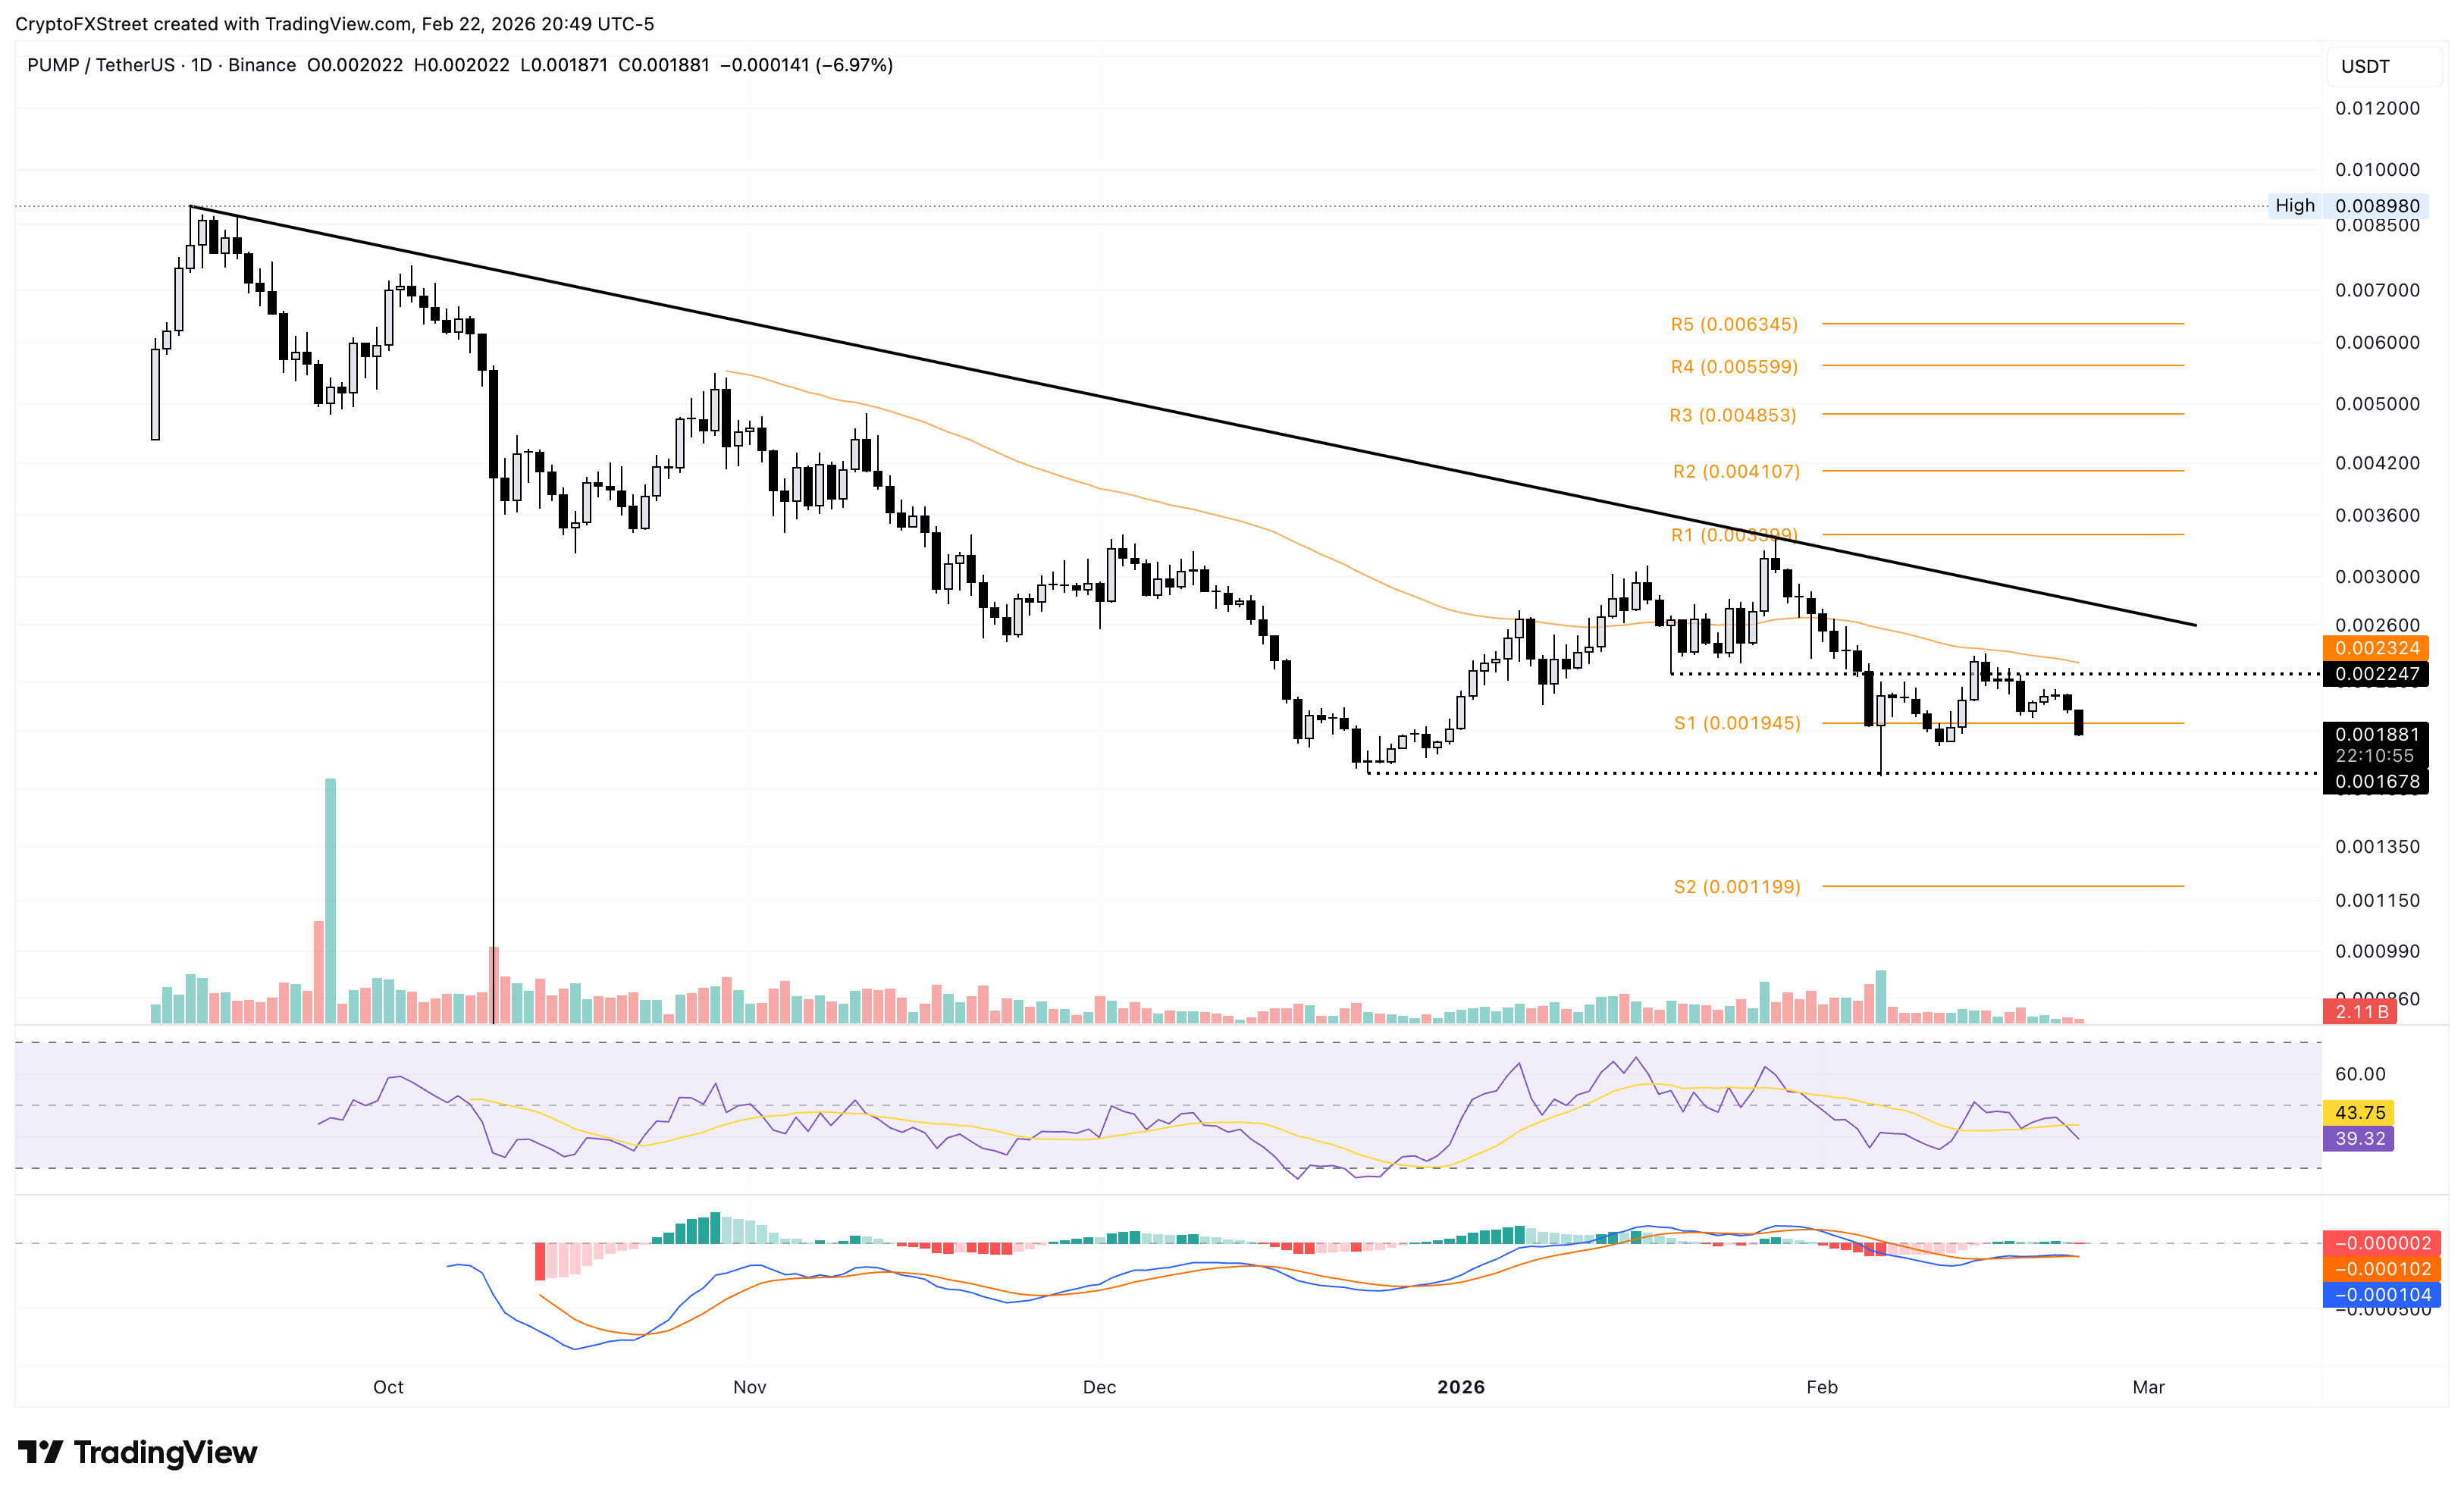
However, on the upside, the 50-day EMA at $0.002325 could serve as the immediate resistance.
LayerZero lowers under pressure as moving averages cap recovery
LayerZero is down more than 5% at the time of writing on Monday, approaching the $1.500 psychological support level. The ZRO token trades below the 50-day and 200-day EMAs, which are in a bearish alignment, reflecting downside pressure.
The 200-day EMA capped last week’s recovery on Sunday, prompting a 5% pullback below the 50-day EMA. The immediate support for the DeFi token lies at the February 6 low of $1.356, followed by a deeper support at the S1 pivot point at $1.177.
The RSI at 42 reverses from the halfway line as selling pressure grows, with further downside room before reaching the oversold zone. The MACD and signal line extend below the zero line, as bearish histograms widen, reaffirming the surge in selling pressure.
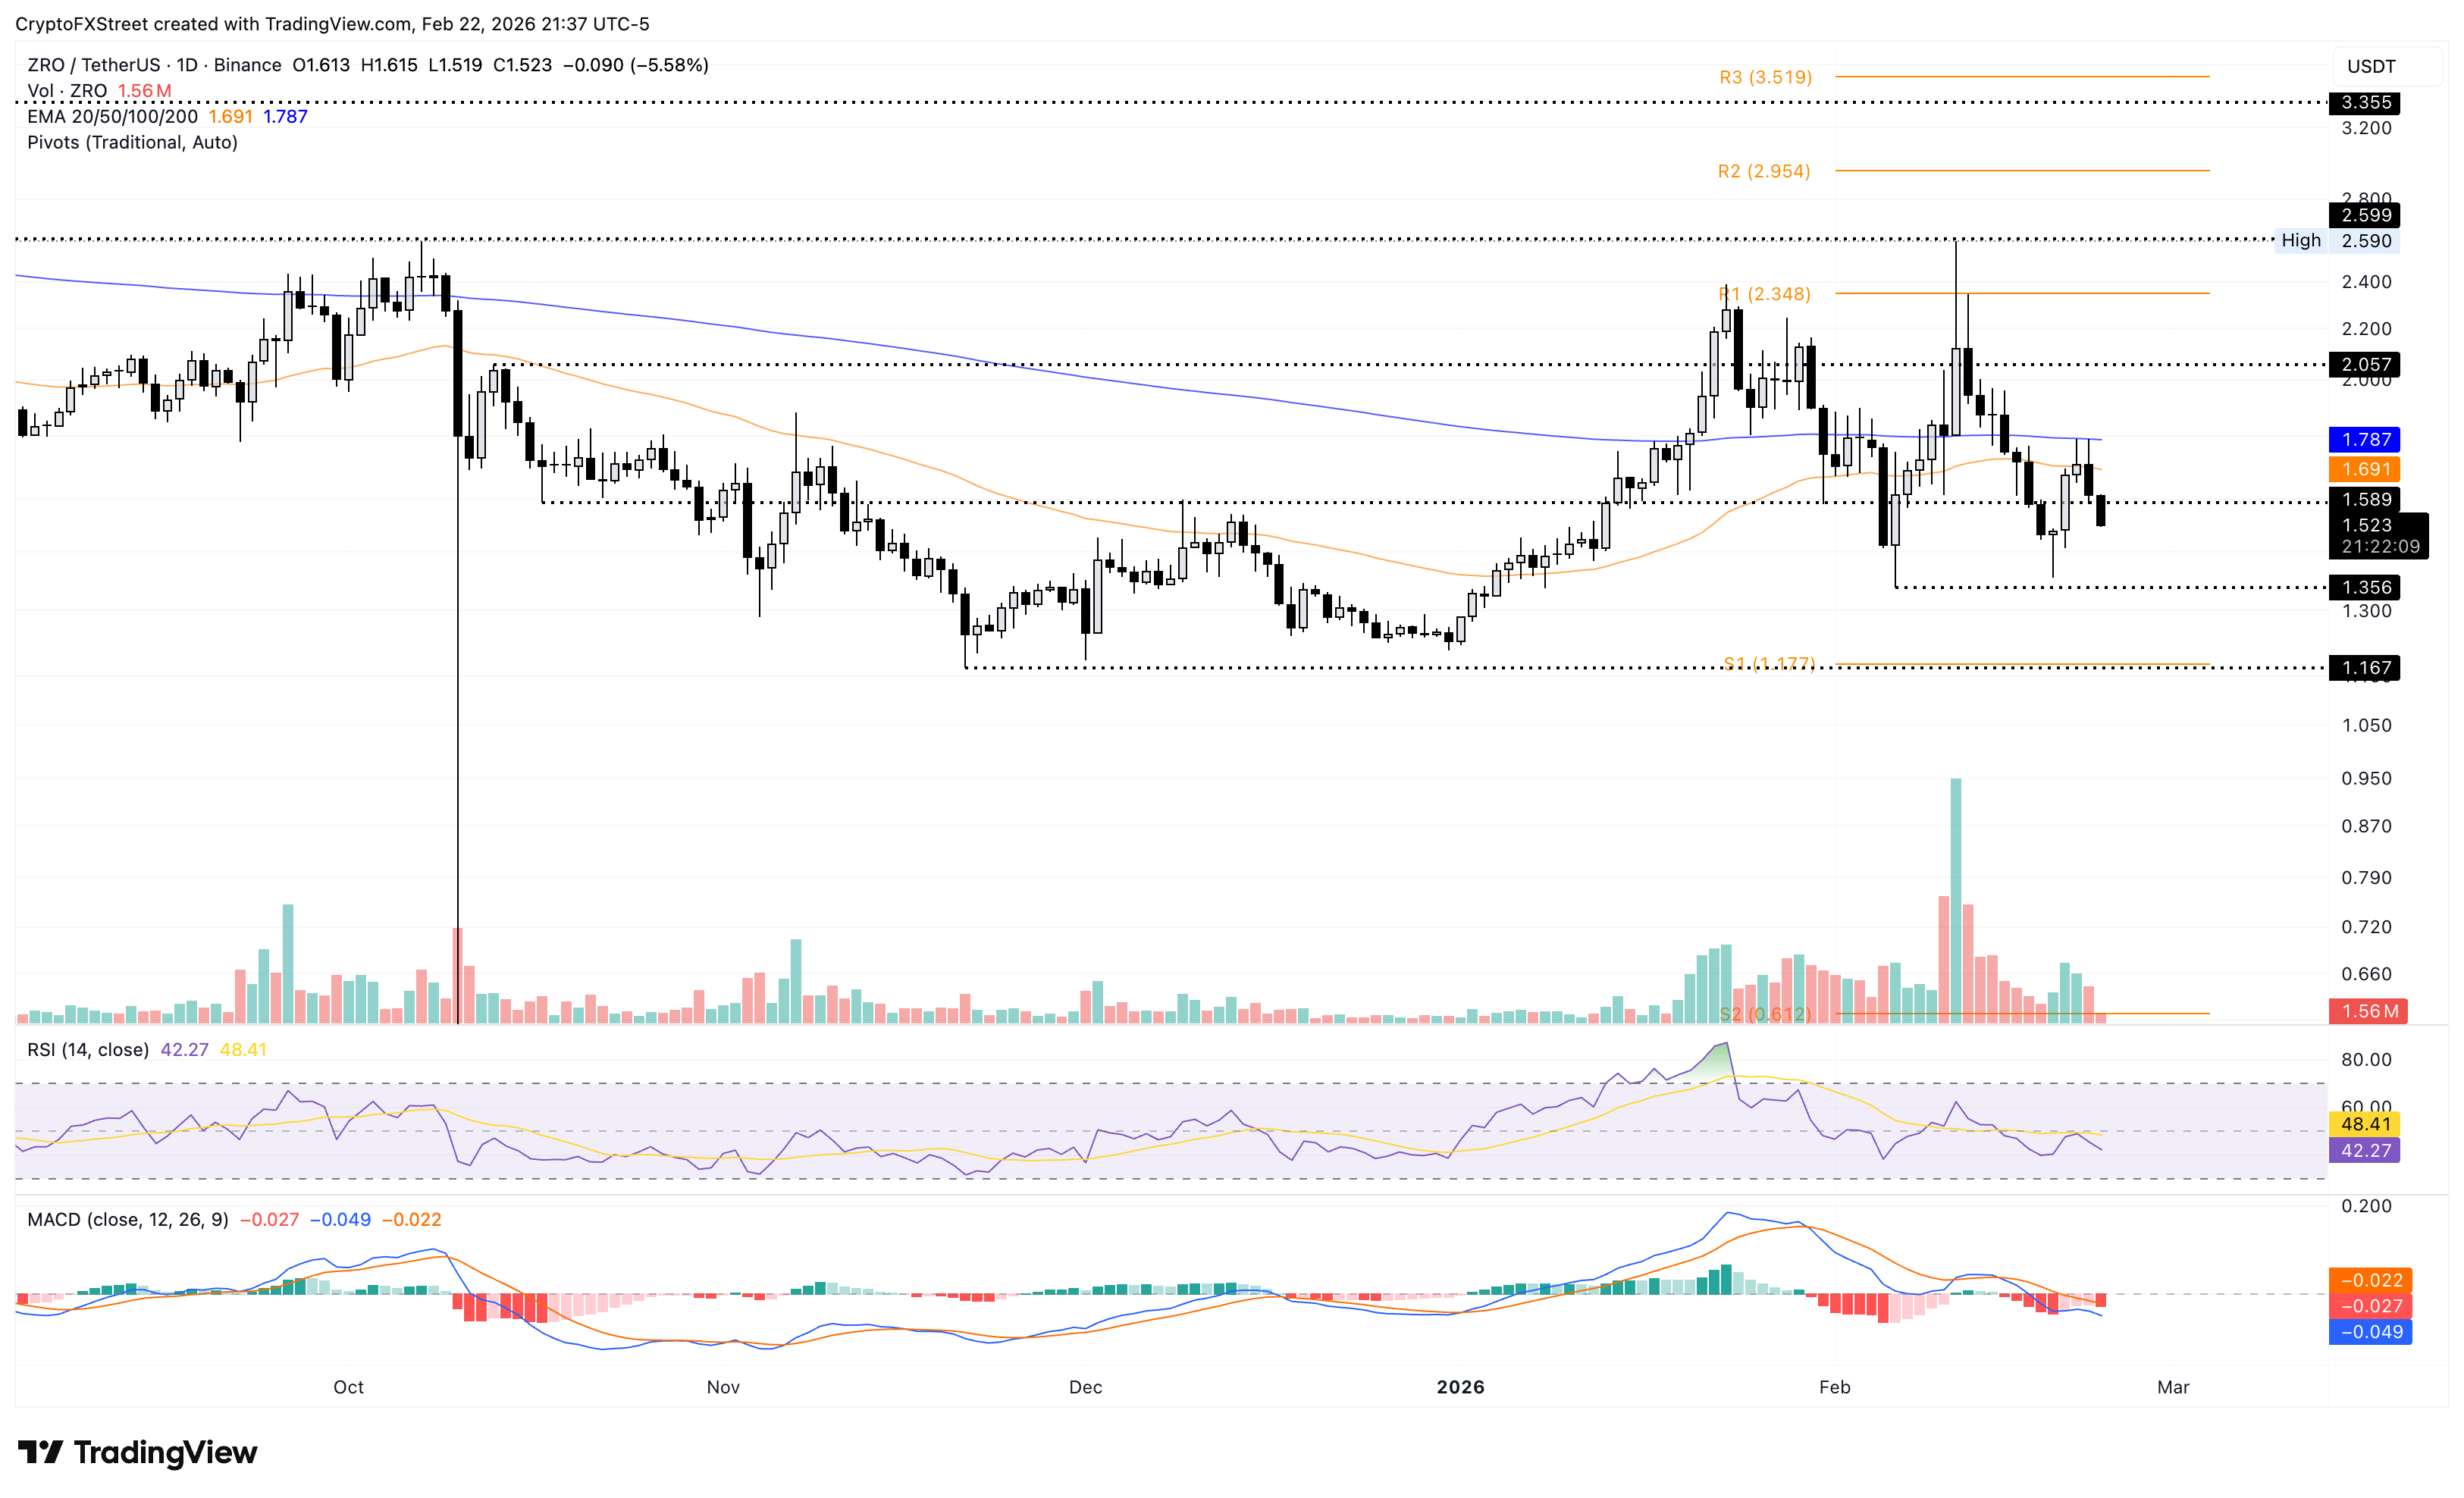
To reinstate an upward trend, the ZRO token should surpass the 50-day and 200-day EMAs at $1.691 and $1.787, respectively.
Recommended Articles


