


When Will Bitcoin Bottom? History Points To October 2026, Says Analyst
An analyst has explained when Bitcoin could possibly reach a bottom, based on the historical pattern followed by its price across cycles.
Bitcoin Has Tended To Take 364 Days From Major Tops To Bottoms
In a new thread on X, analyst Ali Martinez has discussed about what history could hint about when Bitcoin might reach a bottom in the current cycle. “Bitcoin $BTC major cycles have followed a surprisingly consistent rhythm, both in timing and depth,” noted Martinez.
Below is a chart shared by the analyst that highlights some of the similarities that the last few BTC cycles have shared.

As is visible in the graph, the quarterly price of Bitcoin has taken roughly 1,064 days to reach the top from the bottom of the previous bear market during the last three cycles. This is naturally assuming that the cryptocurrency’s high above $126,000 was the top for the current cycle.
The distance from the top to the next bottom was also similar in the 2017 and 2021 cycles on the cryptocurrency’s quarterly chart, coming at about 364 days. “If this pattern holds, Bitcoin $BTC is now inside that 364-day correction window, which points to a potential bottom around October 2026,” explained Martinez.
In the chart, the analyst has also highlighted a possible bottom target for Bitcoin, based on, once again, the pattern from the previous cycles. The 2018 bear market reached its low after a drawdown of 84.22% from the bull market top, while the 2022 bear involved a decline of 77.57%.
Martinez has drawn a drawdown of 70% for the current cycle, which would put the price target at the $37,500 level. It now remains to be seen whether this cycle will follow a trajectory anything like the last cycles or if the asset will go a different direction this time around.
The chart for the Bitcoin cycles is showcasing the long-term trend of the asset using its quarterly price, but what about the short-term direction? In another X post, the analyst has shared the 4-hour chart for BTC, highlighting a technical analysis (TA) pattern forming on a short scale.
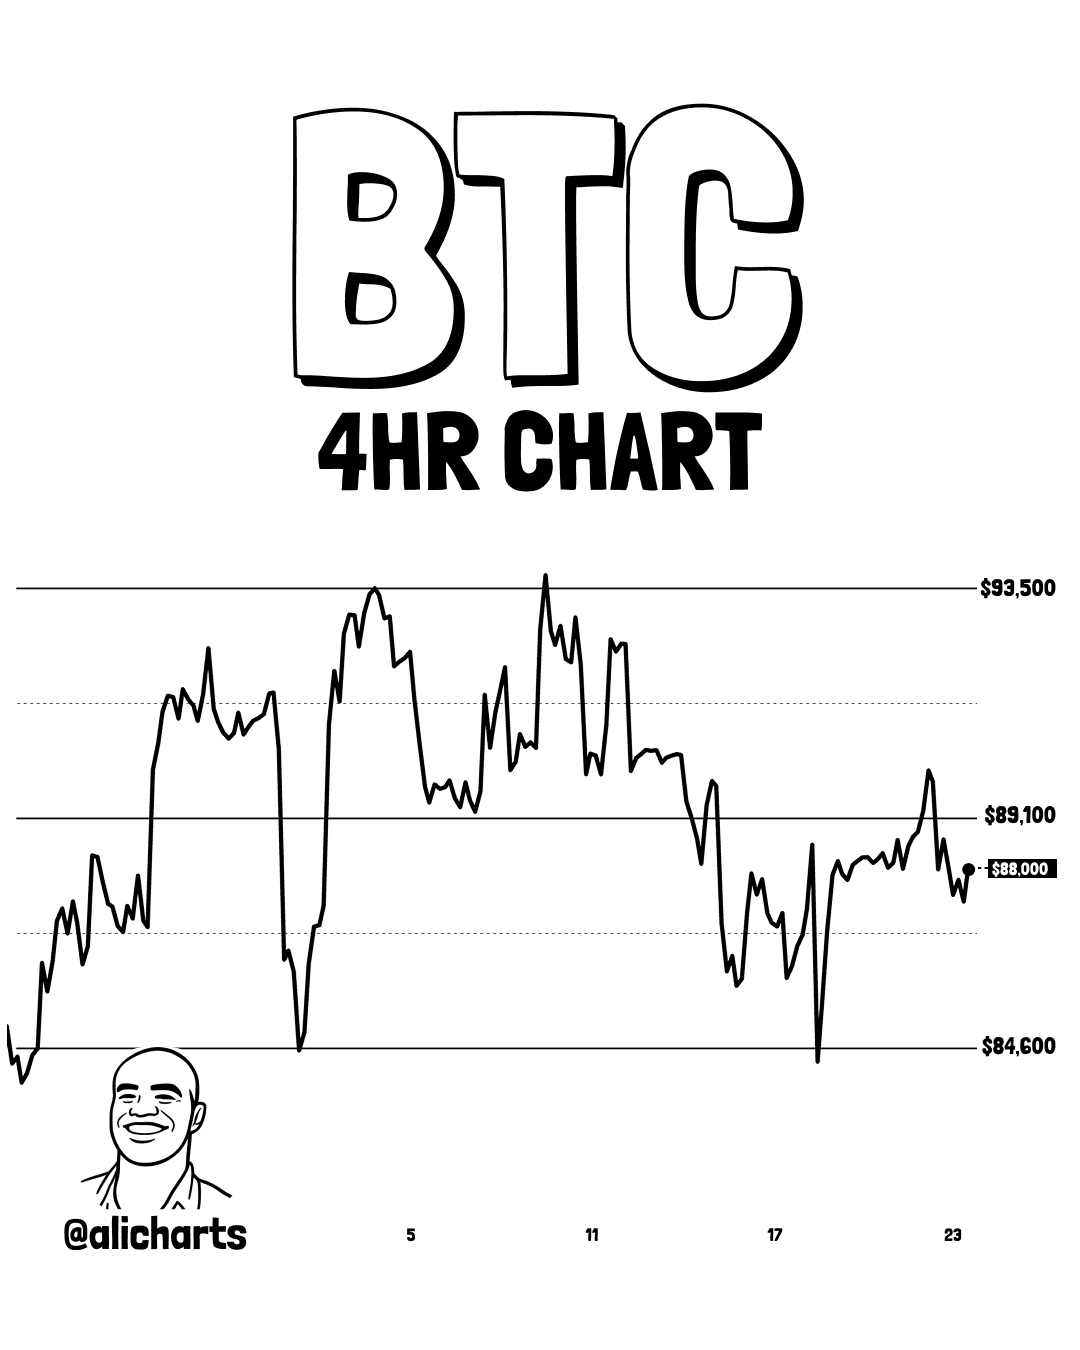
As displayed in the above chart, Bitcoin has potentially been following a Parallel Channel on its 4-hour price during the last few weeks. A Parallel Channel appears whenever an asset observes consolidation between two parallel trendlines, with the lower level acting as support and upper one as resistance.
The cryptocurrency retested the lower line of this Parallel Channel last week, which led to a rebound as support held up. The asset has since returned to the middle zone of the pattern, suggesting there isn’t any clear bias in either direction right now.
BTC Price
At the time of writing, Bitcoin is floating around $87,300, up 0.7% in the last seven days.
Recommended Articles


