Ethereum Price Chart Flashes a Bearish Warning — Could This Be a ‘Long-Term’ Risk?

Source Beincrypto

Ethereum price trades around $3,000, but the chart and on-chain data both indicate a pressure zone that traders cannot ignore. Momentum looks unstable, as one key holder group continues to sell.

The Ethereum price is stuck at a point where even slight shifts can alter the entire structure.

Momentum Weakens as Long-Term Sellers Step In

The ETH price has attempted to recover over the past week, rising approximately 10%, but the broader trend remains down 23% over the last 30 days. The bounce looks healthy on the surface, yet the behavior underneath the chart tells a different story.

The RSI, or Relative Strength Index, measures momentum. A hidden bearish divergence has formed between November 18 and November 28.

The Ethereum price made a higher low, but momentum made a higher high. When this happens during a downtrend, it often signals a weak rebound and that sellers still control the trend.

Ethereum Price Action
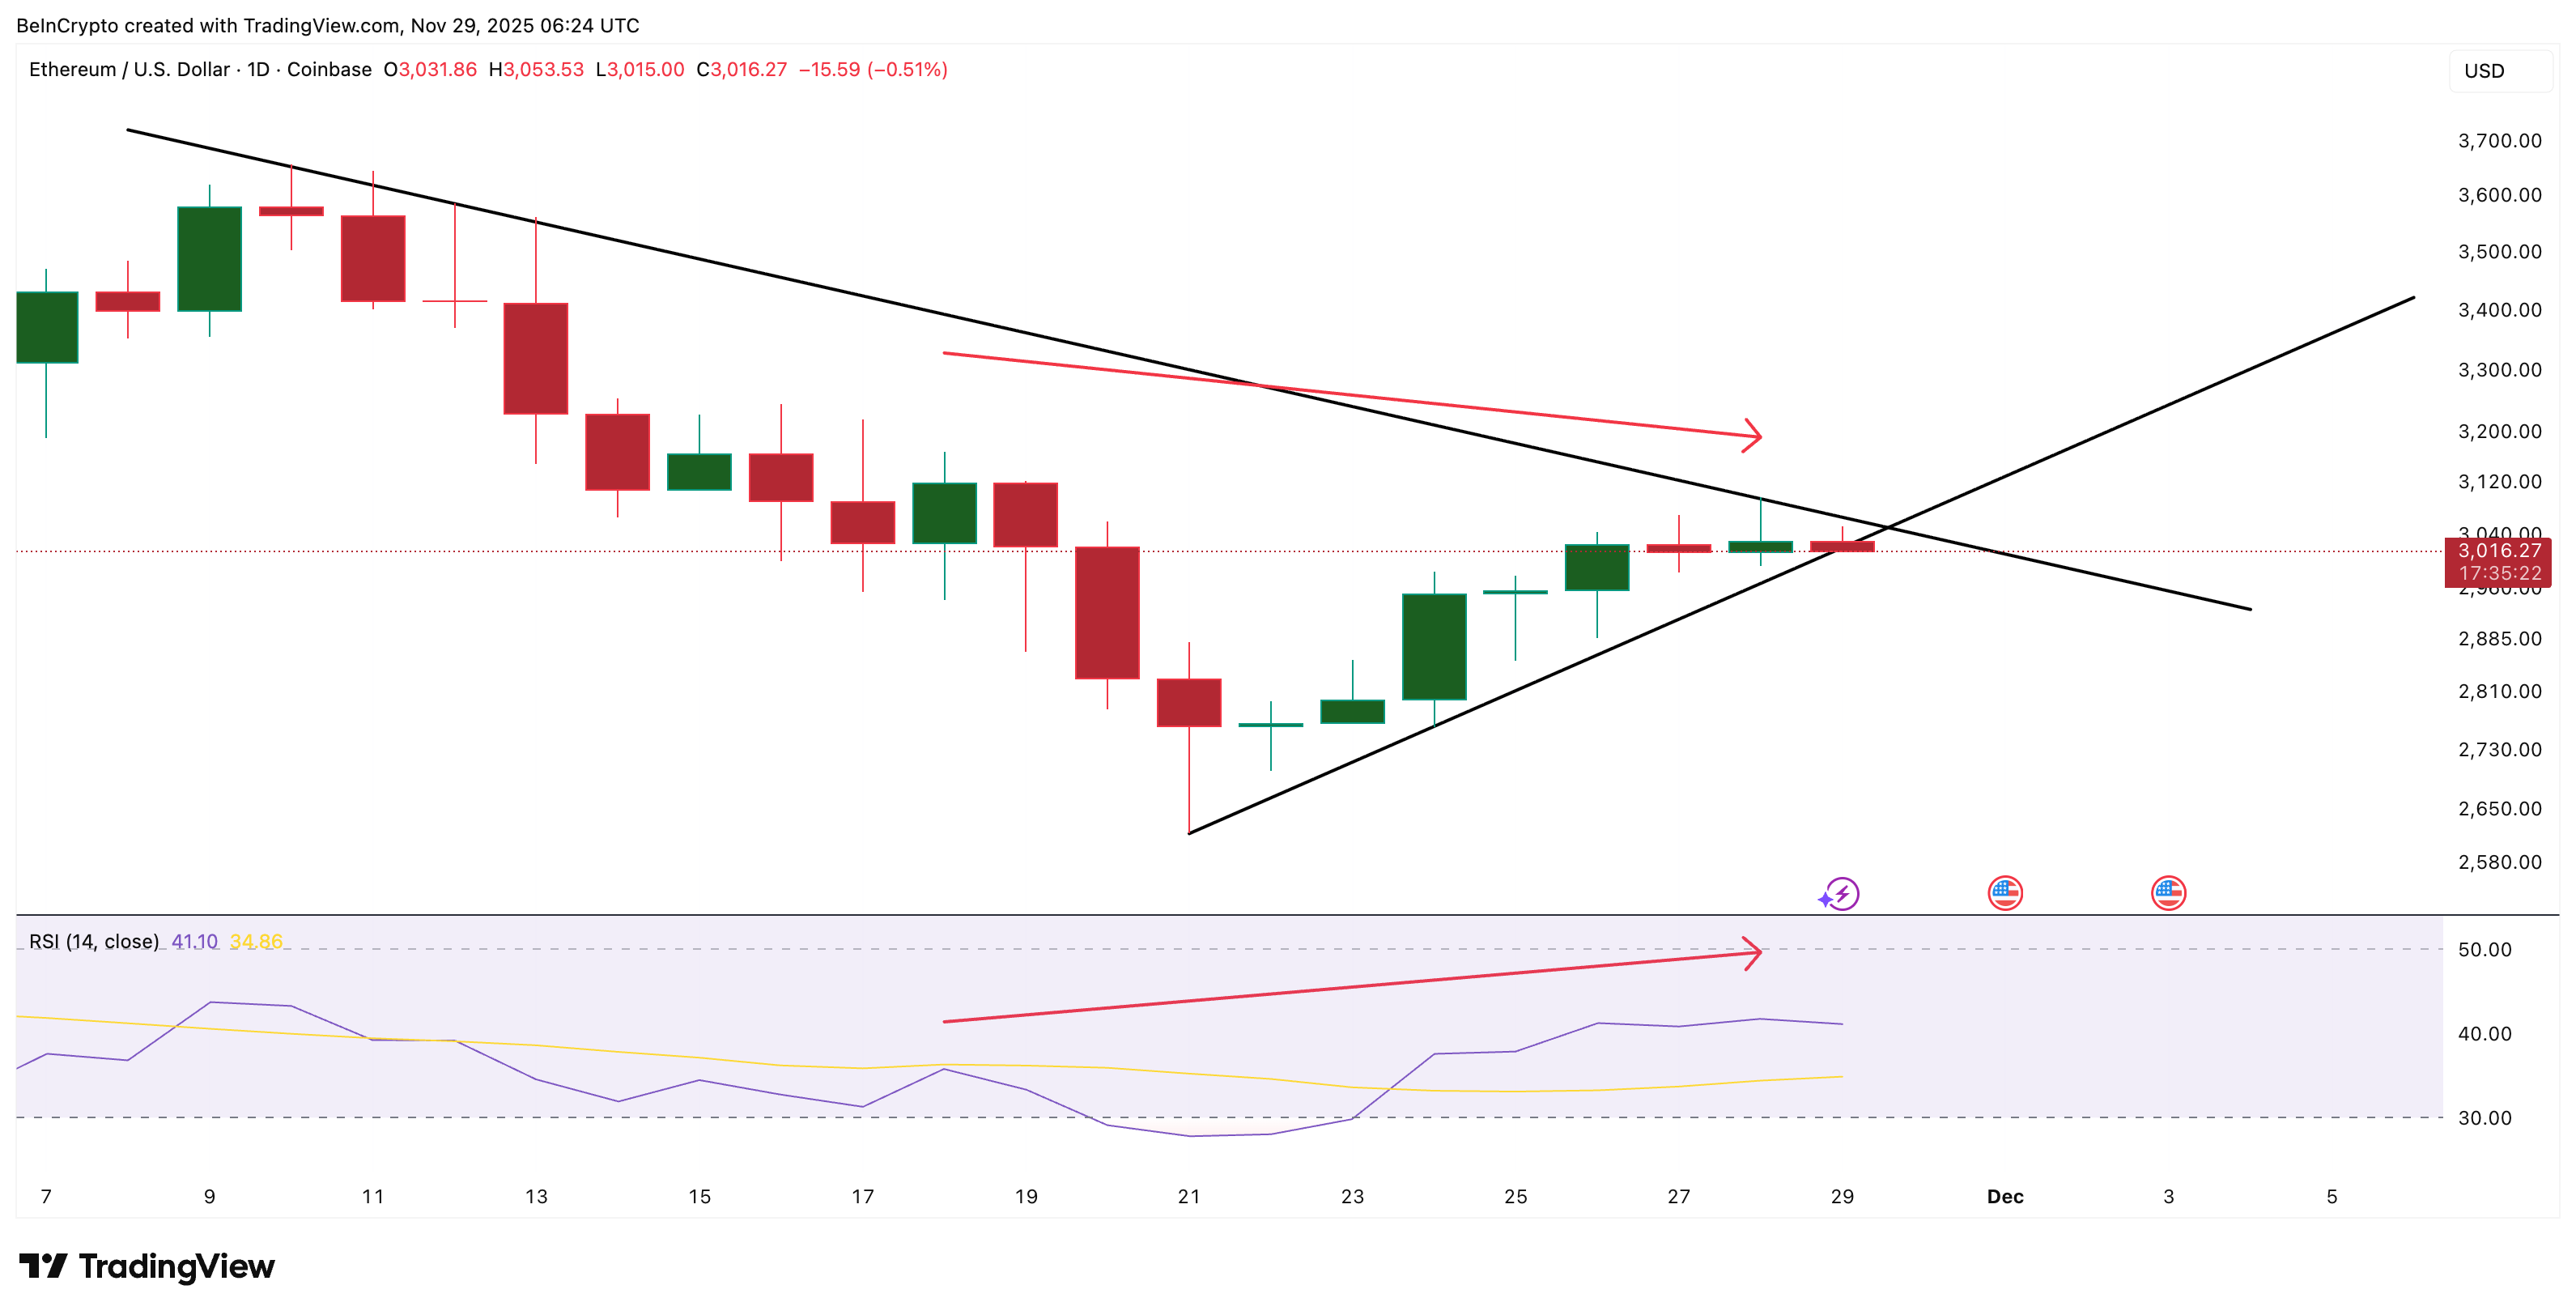
Ethereum Price Action: TradingView

Want more token insights like this? Sign up for Editor Harsh Notariya’s Daily Crypto Newsletter here.

Who are those sellers? On-chain data gives the answer.

Hodler Net Position Change — which shows whether long-term holders are adding or removing ETH — has stayed deep in red for the entire month. Red readings mean long-term wallets are sending ETH back toward exchanges.

Over the last week, that pressure has increased sharply. On November 22, long-term holders offloaded about 334,600 ETH, but by November 28 the figure had grown to roughly 973,000 ETH — a rise of about 191% in six days.

There was also a local spike near 1.1 million ETH on November 26. This steady increase in weekly outflows indicates that the cohort that typically stabilizes the market is now leaning more heavily towards the sell side.

Long-Term Cohort Selling
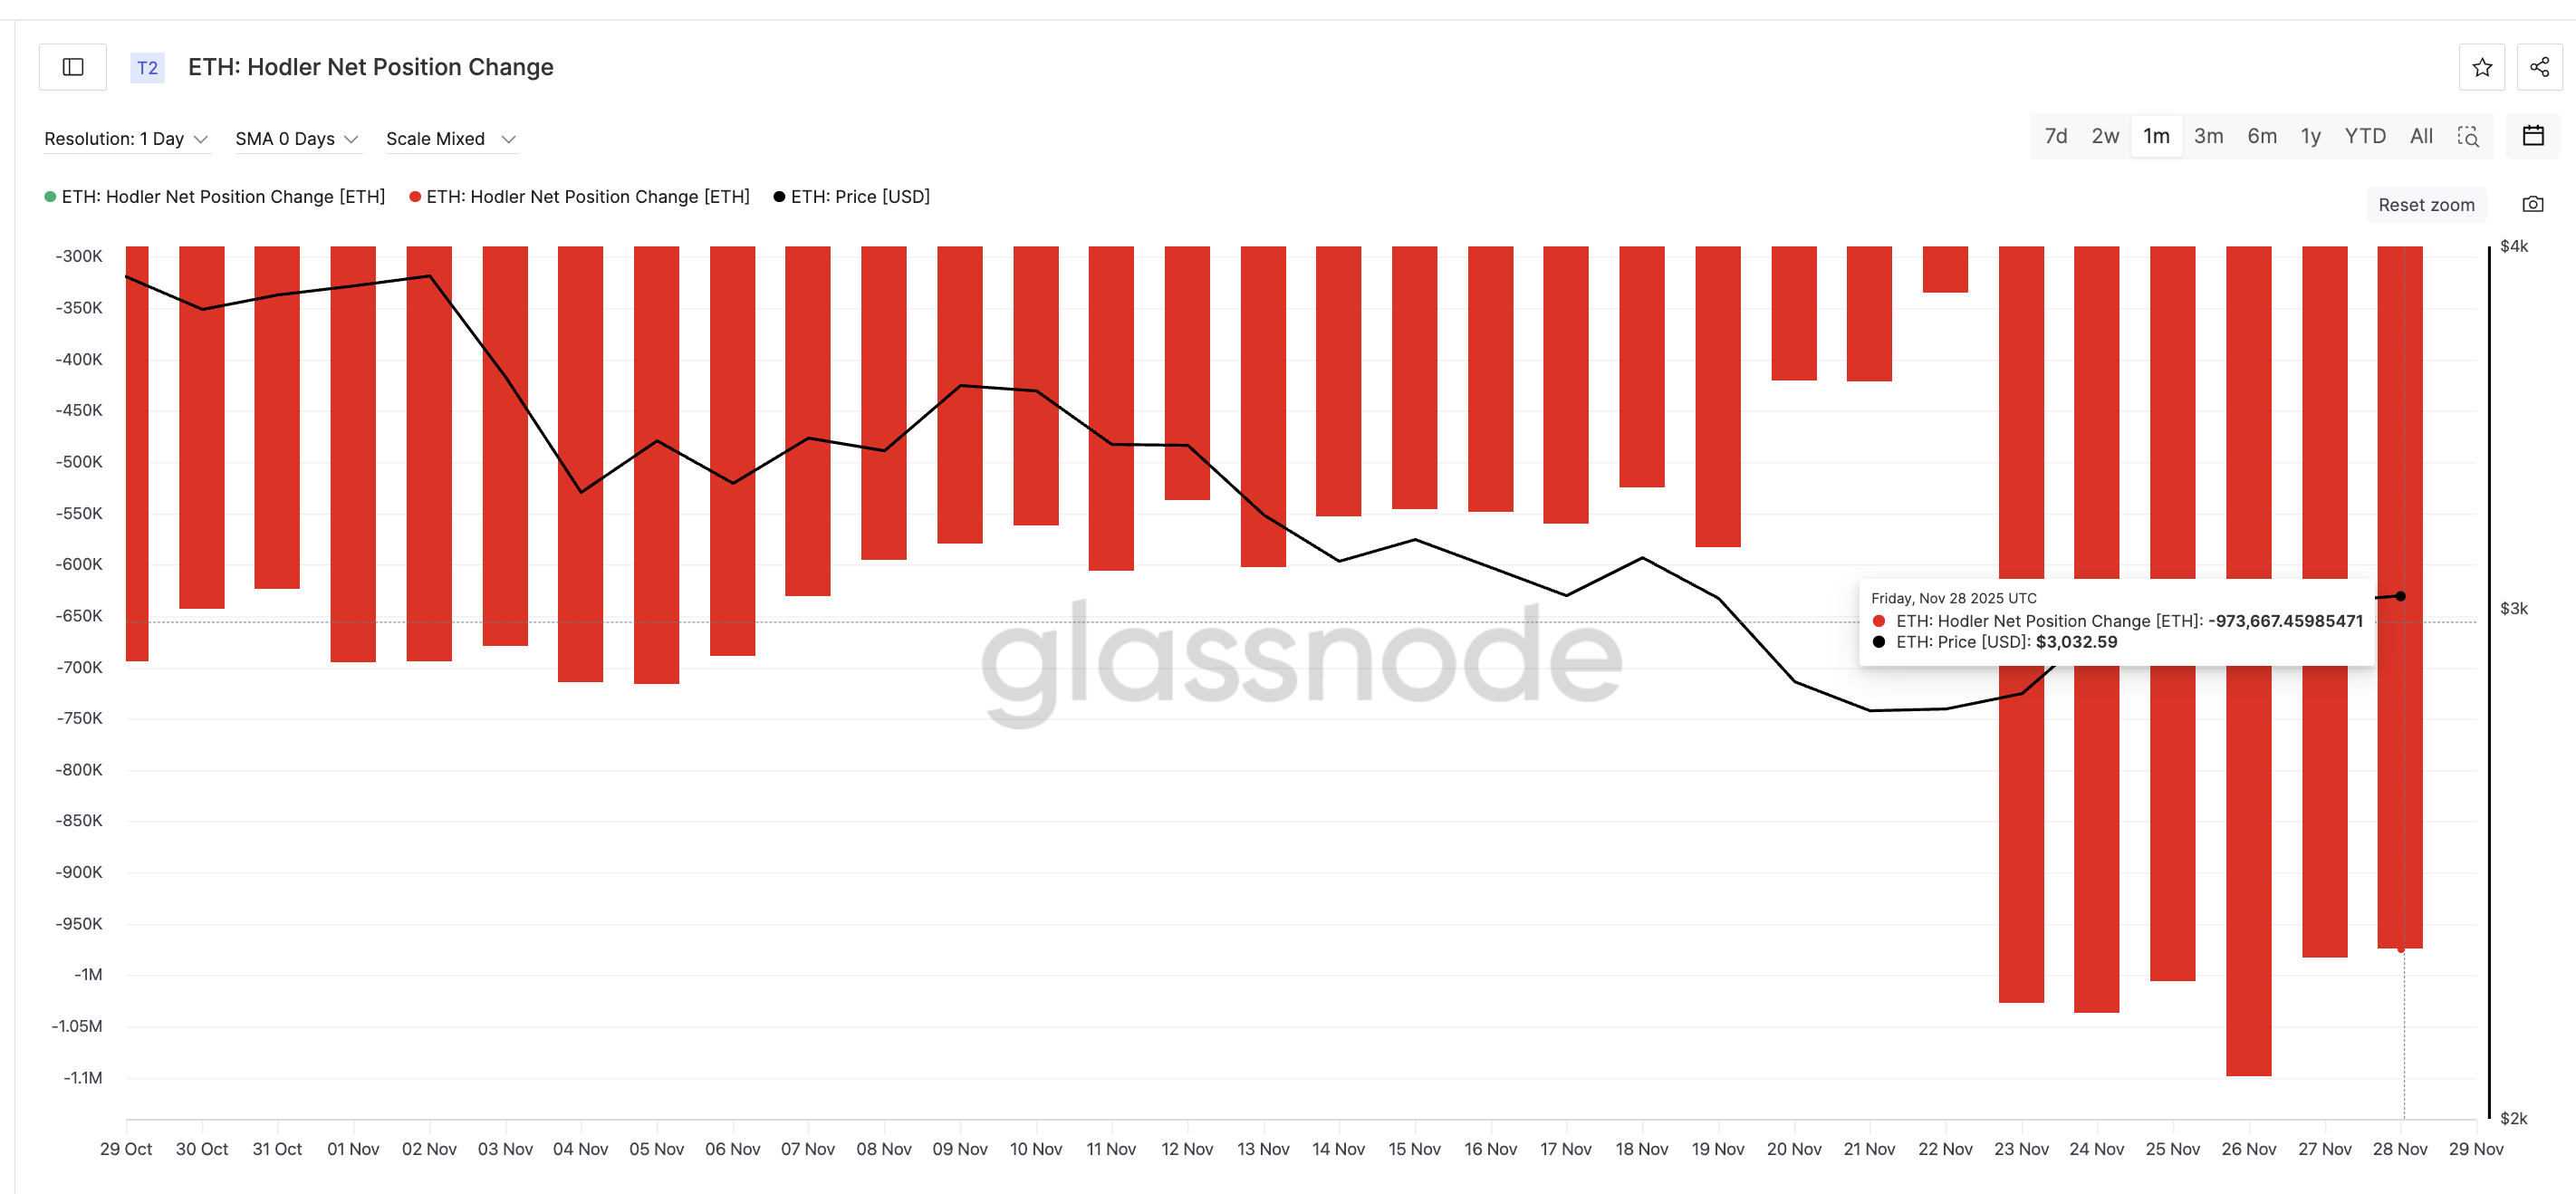
Long-Term Cohort Selling: Glassnode

Momentum softening and long-term selling happening together give ETH a clear downside risk.

Ethereum Price Sits at a Tight Break Point

The Ethereum price is also closing in on the edge of a pennant structure. This can break either way.

ETH now trades right above the $3,016 support zone, which lines up with the 0.382 Fibonacci level. If this floor breaks, the next levels sit at $2,864, a 5% dip. A deeper slide could open $2,619, especially if long-term selling continues.

Ethereum Price Analysis
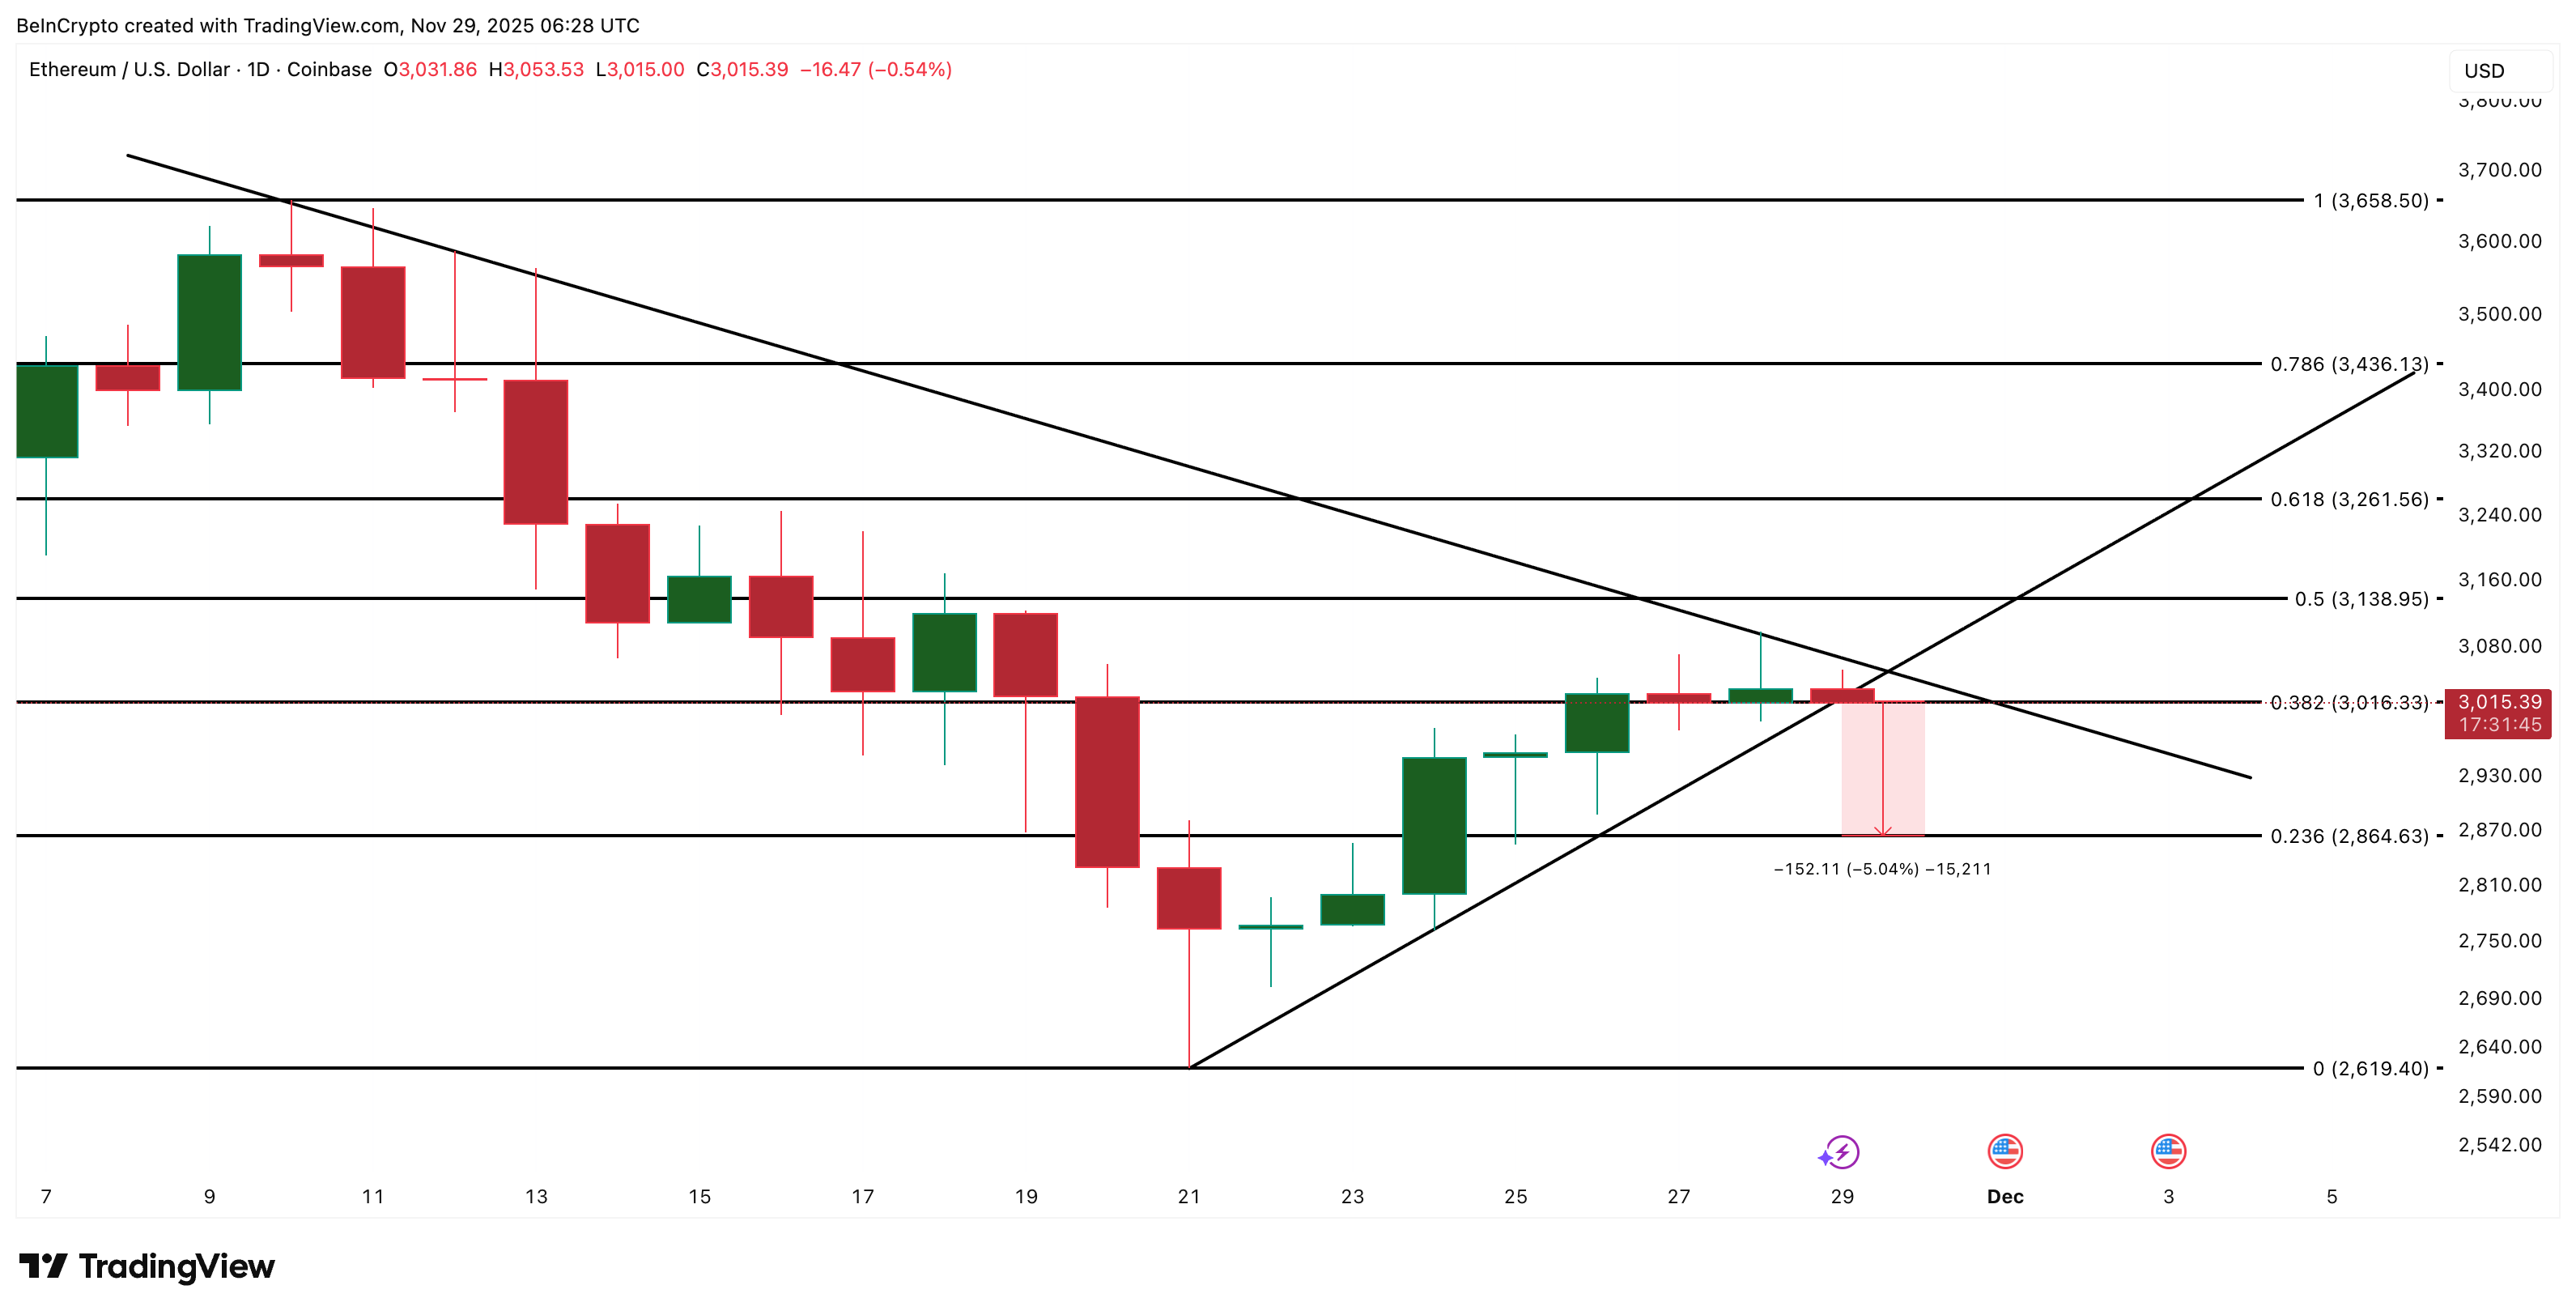
Ethereum Price Analysis: TradingView

To cancel the bearish setup, ETH must push above $3,138. That level breaks the upper pennant trendline and flips the short-term bias. Without that break, the chart remains vulnerable.

Pennants can technically break either way, but the RSI setup and long-term selling tilt the Ethereum price risk toward a downside break unless buyers step in soon.

Disclaimer: For information purposes only. Past performance is not indicative of future results.
placeholder
Google accelerates its post-quantum cryptography timeline to 2029 in its latest researchGoogle Quantum AI has released research showing that breaking Bitcoin’s encryption may require significantly fewer quantum resources than previously estimated. This discovery could potentially unlock billions of dollars in funds dormant due to private key losses. While Google’s discovery benefits individuals with no access to their fortunes, as Elon Musk promptly pointed out, it also […]
Author  Cryptopolitan
19 hours ago
Google Quantum AI has released research showing that breaking Bitcoin’s encryption may require significantly fewer quantum resources than previously estimated. This discovery could potentially unlock billions of dollars in funds dormant due to private key losses. While Google’s discovery benefits individuals with no access to their fortunes, as Elon Musk promptly pointed out, it also […]
placeholder
Ripple and Convera make payments faster as the XRP price holds around $1.34Ripple and Convera are working together to make cross-border payments faster using stablecoins and blockchain.
Author  Cryptopolitan
19 hours ago
Ripple and Convera are working together to make cross-border payments faster using stablecoins and blockchain.
placeholder
Silver Price Recovers From 2026 Low, but April Arrives With a 36% Downside ThreatSilver (XAG/USD) price has bounced roughly 18% from its 2026 low, currently trading above $72. The recovery followed a hidden bullish divergence that began forming in December. Additionally, the lates
Author  Beincrypto
19 hours ago
Silver (XAG/USD) price has bounced roughly 18% from its 2026 low, currently trading above $72. The recovery followed a hidden bullish divergence that began forming in December. Additionally, the lates
placeholder
Can XRP Price Survive the $1.30 Threat Before March Ends?The XRP price traded at $1.31 on March 31, sitting directly above the neckline of a head-and-shoulders pattern that carries an 18% measured breakdown target if it fails.The 4-hour chart shows the righ
Author  Beincrypto
20 hours ago
The XRP price traded at $1.31 on March 31, sitting directly above the neckline of a head-and-shoulders pattern that carries an 18% measured breakdown target if it fails.The 4-hour chart shows the righ
placeholder
If the US Troops Enter Iran, What Happens to Bitcoin? Lessons From Past WarsMarkets are already reacting to rising geopolitical risk. Several Polymarket insiders who successfully bet on the start date of the Iran war are now betting heavily on US boots on the ground in Iran.N
Author  Beincrypto
20 hours ago
Markets are already reacting to rising geopolitical risk. Several Polymarket insiders who successfully bet on the start date of the Iran war are now betting heavily on US boots on the ground in Iran.N
goTop
quote