


ASTER Breakout Confirmed, But Price Flashes Warning
The ASTER price is up over 8% today and about 12% in the past week. The token has finally broken out of a falling wedge, which is normally a bullish pattern.
But even with today’s sharp jump, some warning signs are forming. Two momentum divergences and a heavy long buildup on the liquidation map show that the next move may not be a straight continuation. The question now is whether ASTER can extend the breakout or if a pullback hits first.
Momentum Shows Strength, But Divergences Are Appearing
The first concern comes from the Relative Strength Index (RSI). RSI measures buying pressure and indicates whether the move has underlying strength. Between November 2 and November 16, ASTER’s price made a lower high while RSI made a higher high. That is a hidden bearish divergence. It appears that when buying pressure rises, the price fails to follow. It usually warns of a pullback.
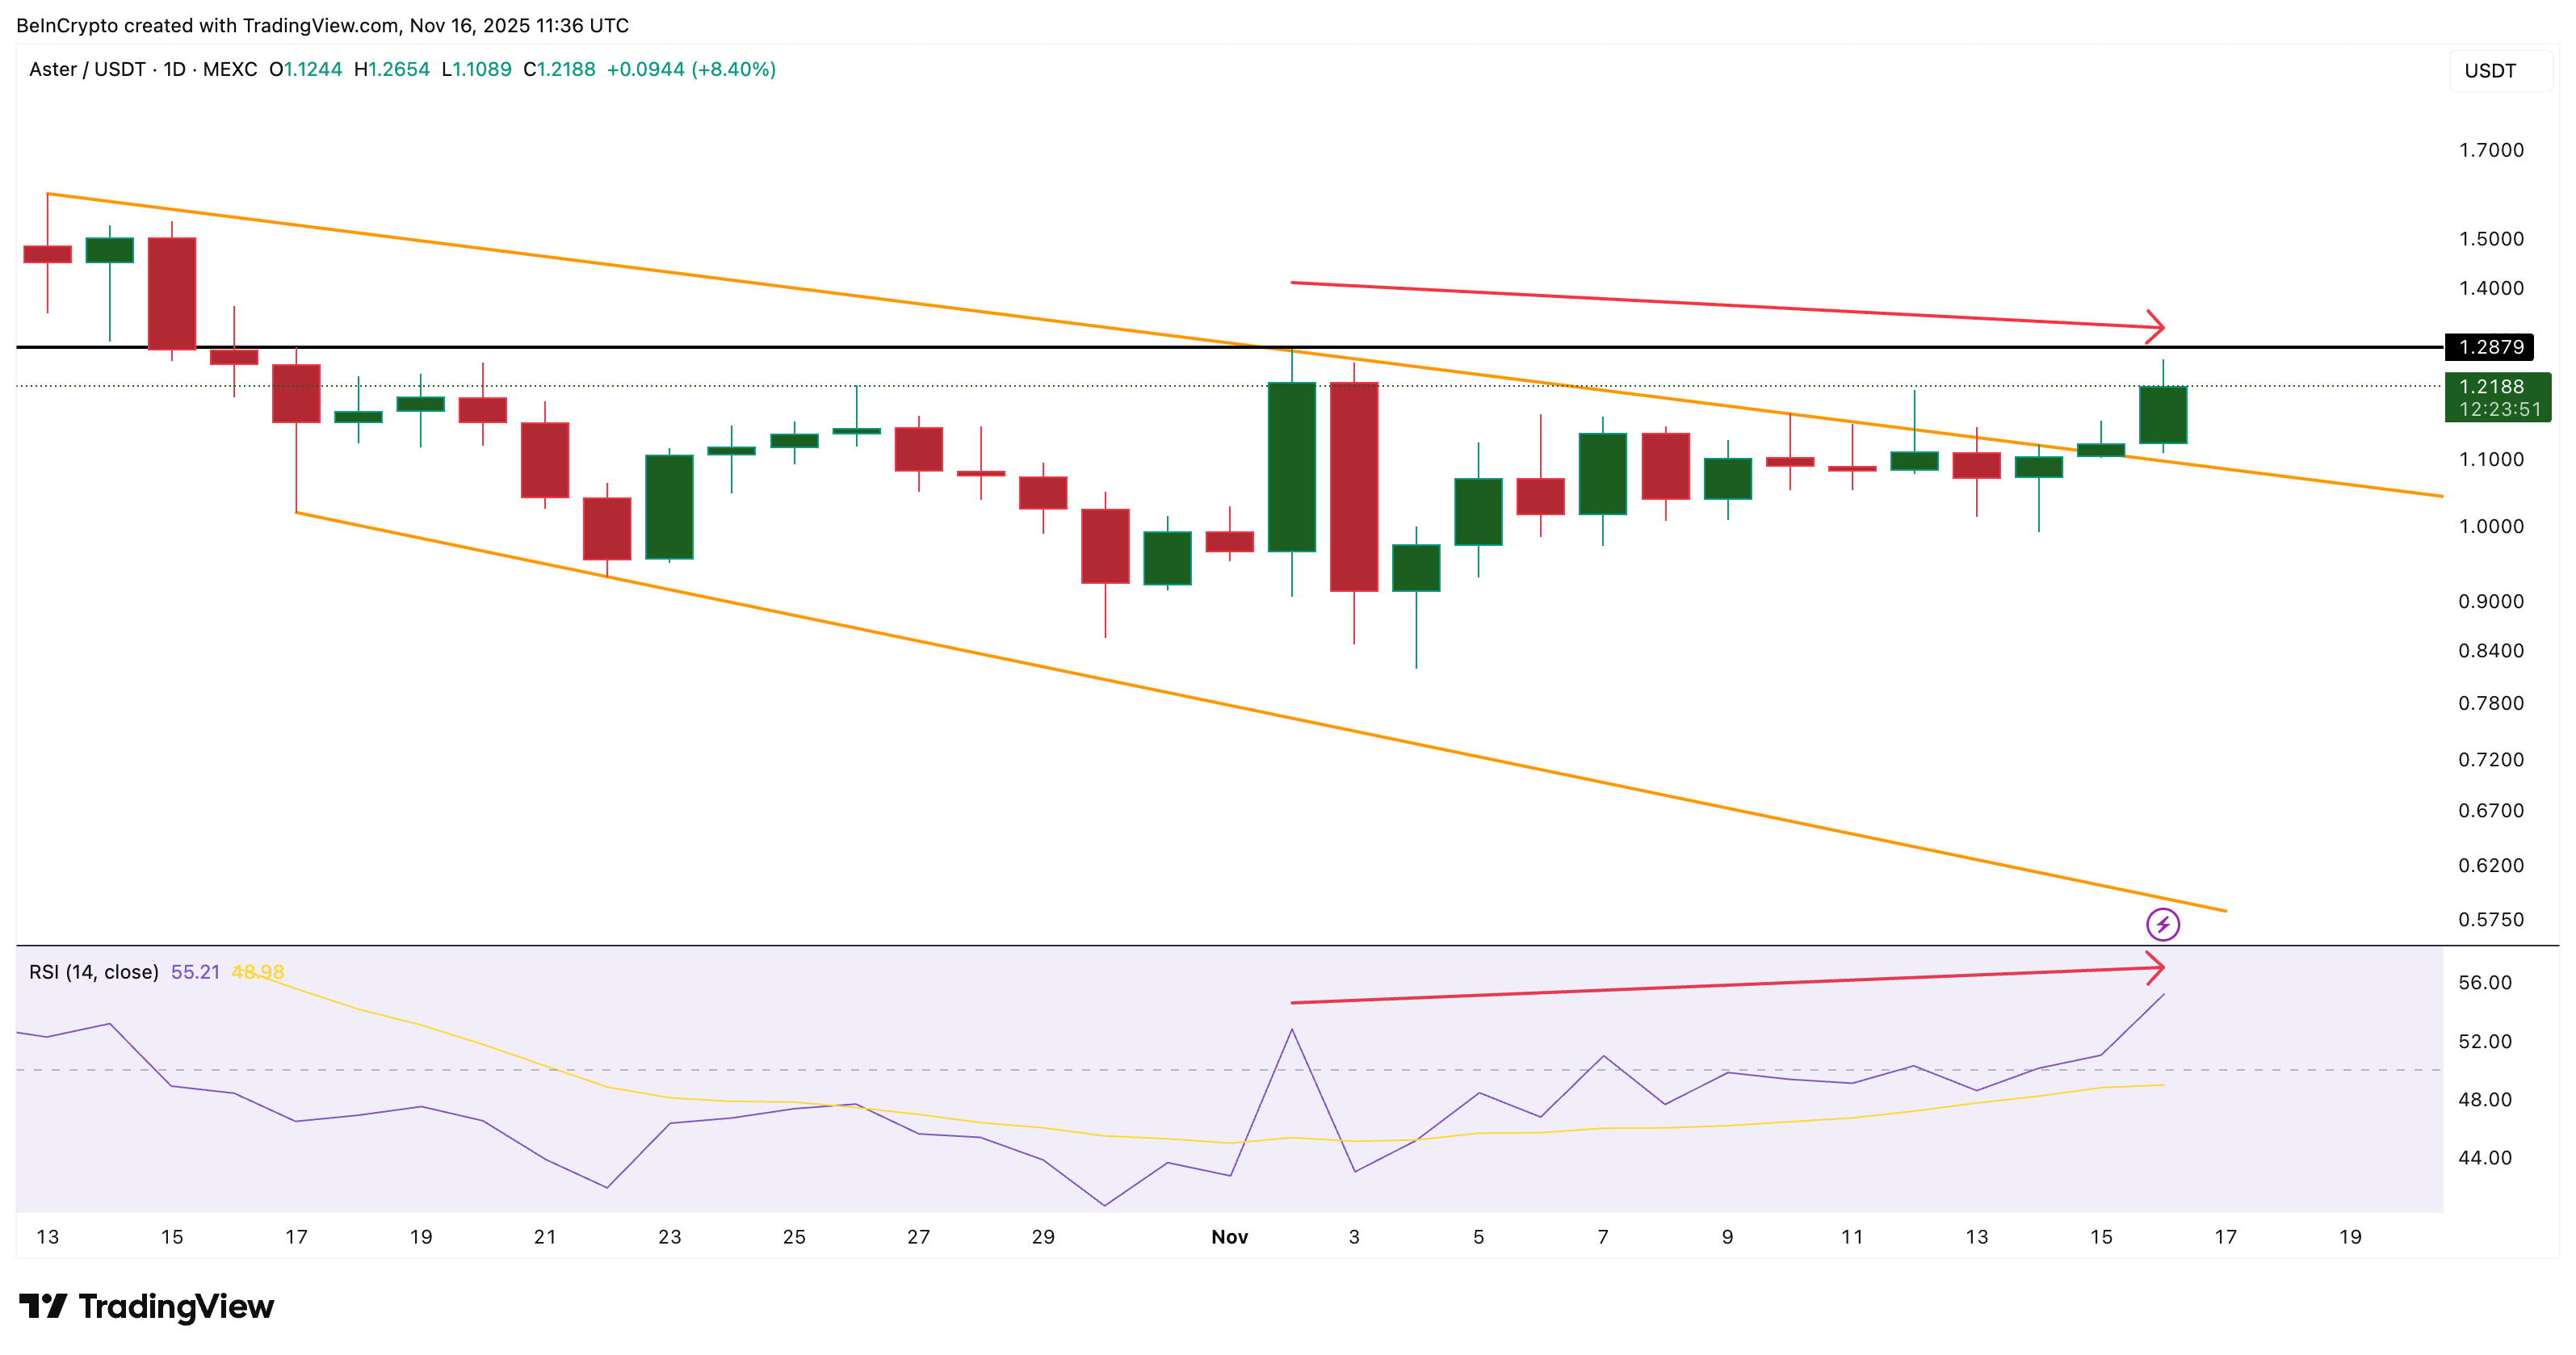 ASTER Shows RSI Divergence: TradingView
Want more token insights like this? Sign up for Editor Harsh Notariya’s Daily Crypto Newsletter here.
The Money Flow Index (MFI), which tracks dip buying by combining price and volume, is flashing the same problem. Between November 11 and November 16, the price formed a higher low, but MFI formed a lower low. This means dip buying is getting weaker.
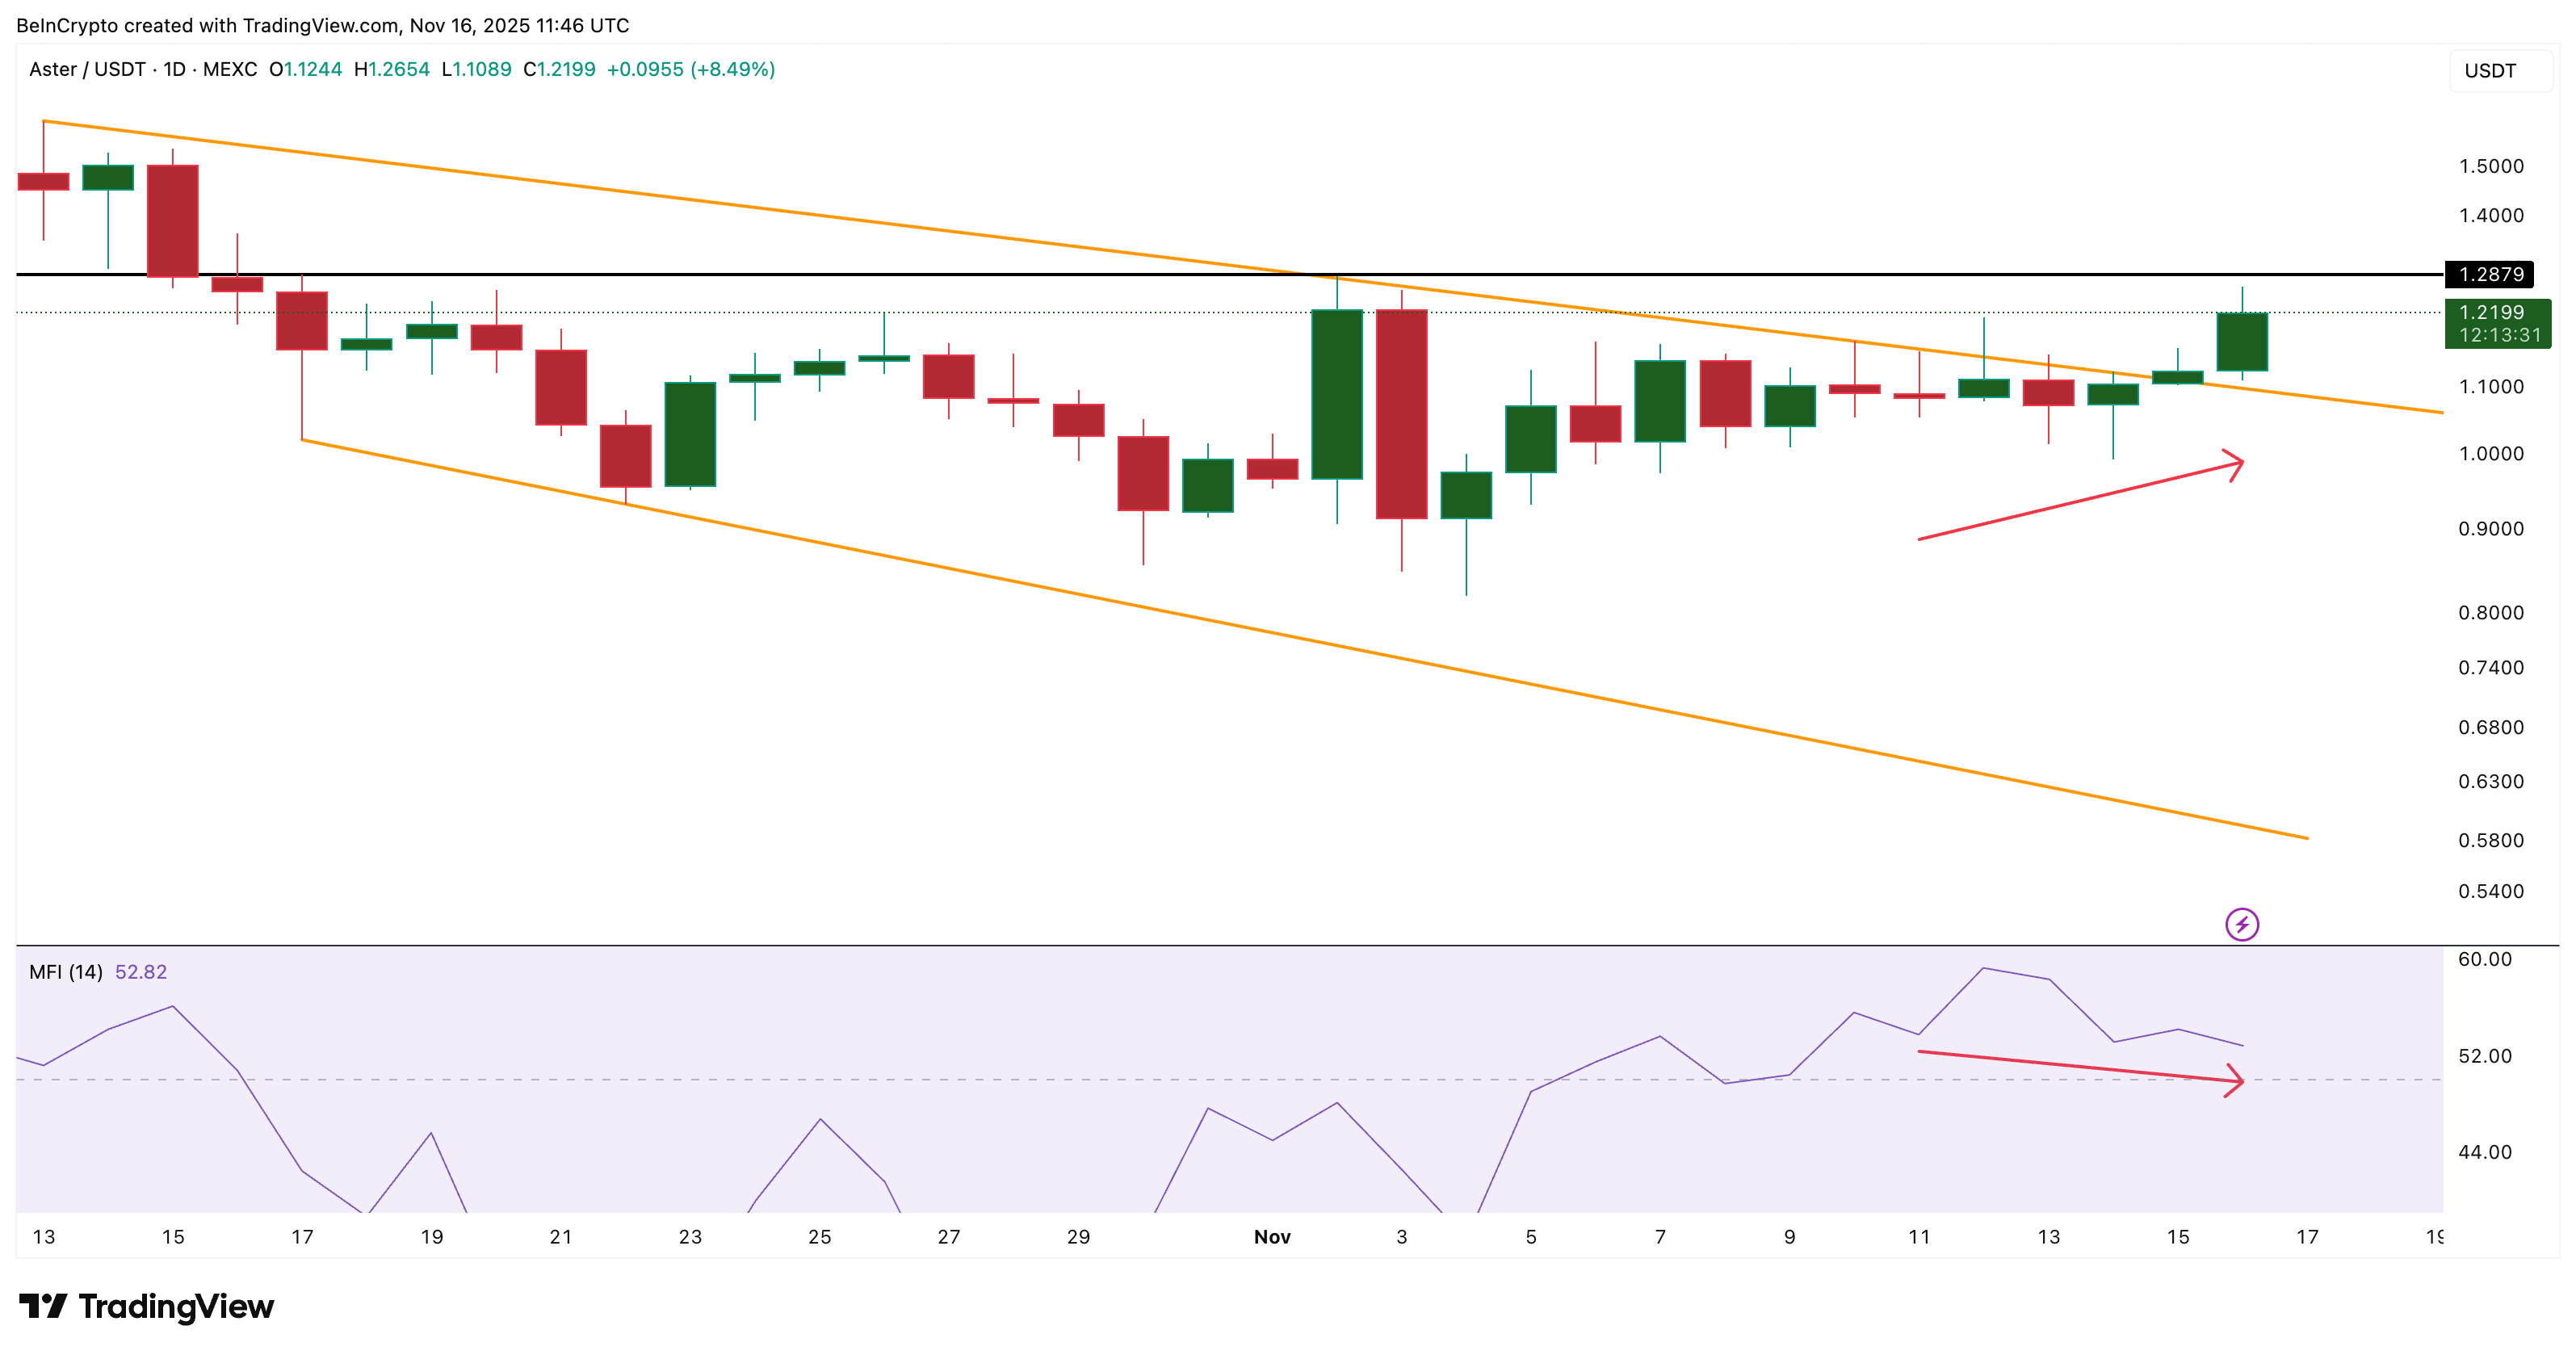 Dip Buying Slowing Down: TradingView
Both divergences point to the same message. Buyers pushed ASTER high enough to break the wedge, but they did not push strongly enough to confirm a rally. A daily candle close above $1.28 is the only level that clears both divergences and confirms real strength.
Long Heavy Positioning Raises Pullback Risk
The bigger risk comes from leverage. On Binance’s ASTER-USDT liquidation map, long liquidation leverage is $25.86 million. Short liquidation leverage is only $6.06 million.
So longs are more than four times larger than shorts. This setup means the move is built on aggressive long positioning. If the ASTER price even dips modestly, these longs are at risk. When long liquidations fire, the price usually drops faster because forced selling accelerates the move.
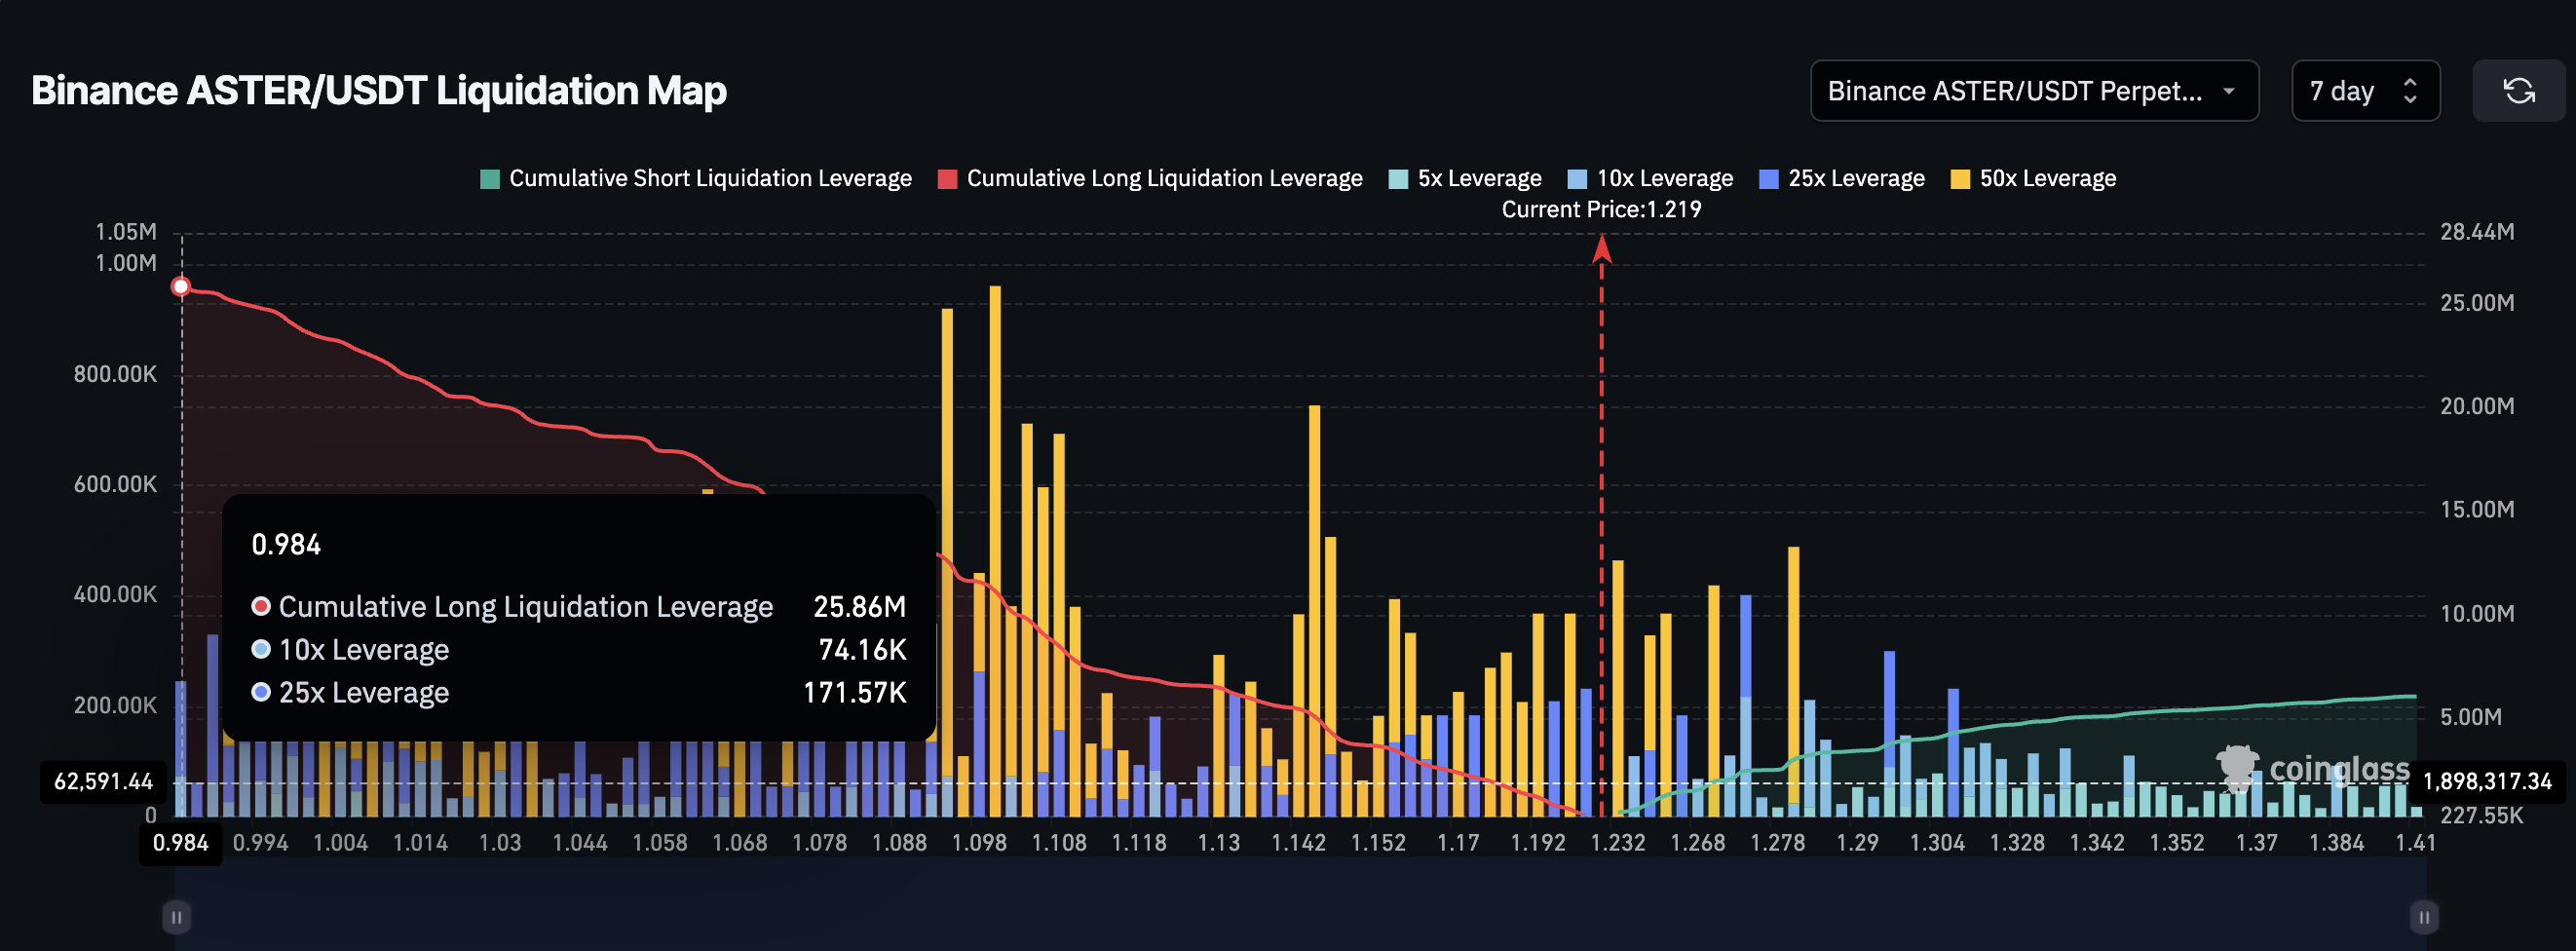 Long-Biased Liquidation Map: Coinglass
This pairs directly with the divergences. If momentum weakens and the price pulls back, the Aster price could face a deeper slide because the long side is overloaded. That is the core risk hidden under today’s breakout.
ASTER Price Needs $1.28 To Confirm Strength
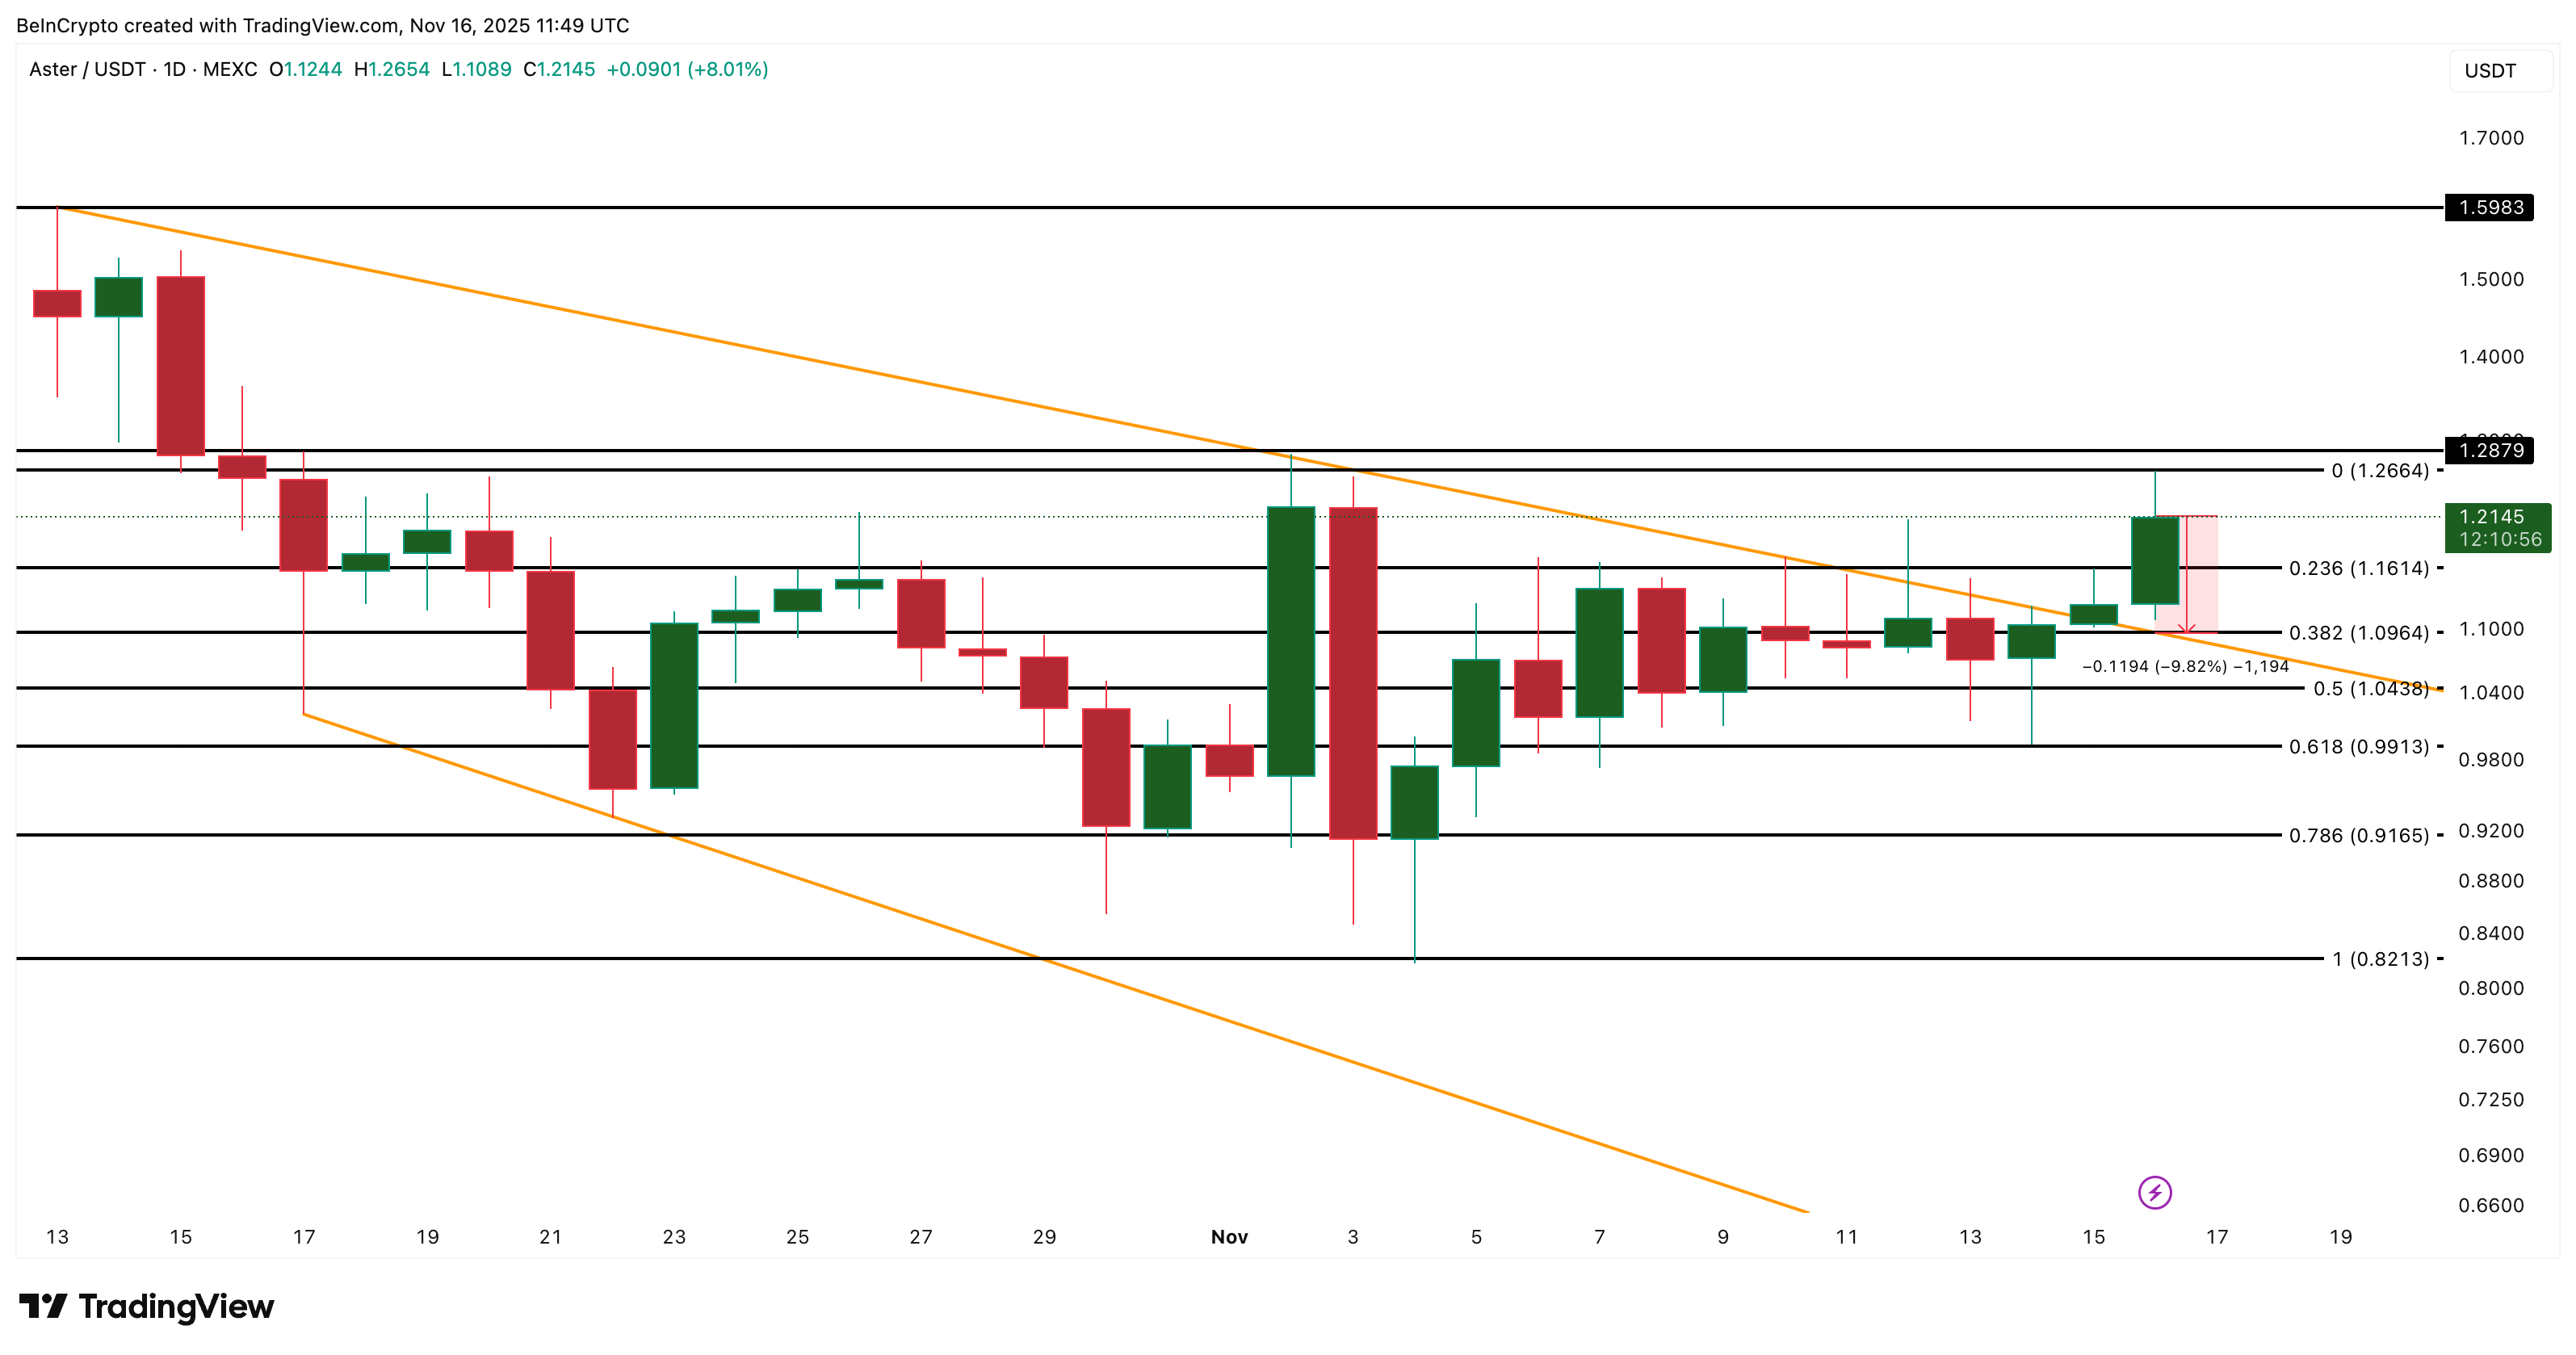
The ASTER price chart shows the same tension. ASTER broke the falling wedge today. But the breakout only becomes reliable above $1.28. That is the key level at which the structure transitions from an unstable breakout to a definite trend change.
If the divergences play out and the pullback begins, the first level ASTER needs to defend is $1.09. Holding that level keeps the drop limited to a simple correction.
Losing $1.09 opens the way toward $0.99, which is also where most long-liquidation clusters sit on the Binance map. A move into that zone would likely accelerate the drop because the long-side leverage is heavy.
 ASTER Price Analysis: TradingView
If ASTER closes above $1.28 instead, the divergences get invalidated and the path opens toward $1.59. That is the next major level the chart points to.
Recommended Articles


