



Solana (SOL) Falls Below Support, Will Bears Extend the Decline?

Source Newsbtc

Solana started a fresh decline from the $210 zone. SOL price is now showing bearish signs and might decline below the $172 support zone.

  • SOL price started a fresh decline after it failed to clear $210 against the US Dollar.
  • The price is now trading below $185 and the 100-hourly simple moving average.
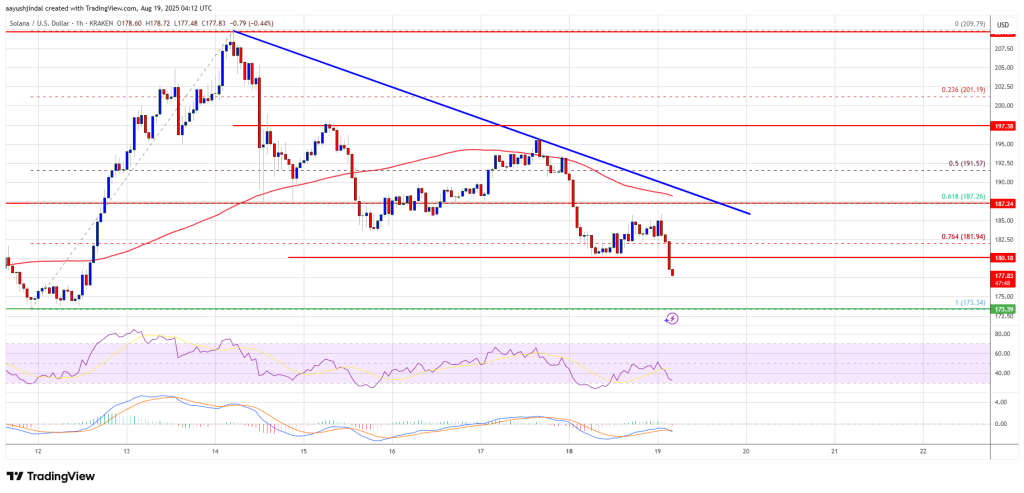
  • There is a connecting bearish trend line forming with resistance at $188 on the hourly chart of the SOL/USD pair (data source from Kraken).
  • The pair could start a fresh increase if it clears the $188 resistance zone.

Solana Price Dips Again

Solana price failed to clear the $210 zone and started a fresh decline, like Bitcoin and Ethereum. SOL traded below the $200 and $188 support levels to enter a short-term bearish zone.

The bears were able to push the price below the 50% Fib retracement level of the upward move from the $173 swing low to the $209 high. There is also a connecting bearish trend line forming with resistance at $188 on the hourly chart of the SOL/USD pair.

Solana is now trading below $185 and the 100-hourly simple moving average. It is also below the 76.4% Fib retracement level of the upward move from the $173 swing low to the $209 high.
Solana Price

On the upside, the price is facing resistance near the $182 level. The next major resistance is near the $184 level. The main resistance could be $188. A successful close above the $188 resistance zone could set the pace for another steady increase. The next key resistance is $192. Any more gains might send the price toward the $200 level.

More Losses In SOL?

If SOL fails to rise above the $182 resistance, it could continue to move down. Initial support on the downside is near the $175 zone. The first major support is near the $172 level.

A break below the $172 level might send the price toward the $162 support zone. If there is a close below the $162 support, the price could decline toward the $150 support in the near term.

Technical Indicators

Hourly MACD – The MACD for SOL/USD is gaining pace in the bearish zone.

Hourly Hours RSI (Relative Strength Index) – The RSI for SOL/USD is below the 50 level.

Major Support Levels – $172 and $162.

Major Resistance Levels – $182 and $188.

Disclaimer: For information purposes only. Past performance is not indicative of future results.
placeholder
MicroStrategy Shares are Performing Better than Bitcoin In 2026, But How?MicroStrategy stock is up nearly 3% at press time, trading above $137 as markets opened on March 9. Strategy just announced another 17,994 BTC purchase for $1.28 billion.The stock trades 57% lower ove
Author  Beincrypto
Mar 10, Tue
MicroStrategy stock is up nearly 3% at press time, trading above $137 as markets opened on March 9. Strategy just announced another 17,994 BTC purchase for $1.28 billion.The stock trades 57% lower ove
placeholder
What to Expect From NVIDIA Stock Price in April 2026?NVIDIA (NASDAQ: NVDA) stock price trades at $177.64 on the 2-day chart, up 5.31% over the past days but still down 6% year-to-date. April sits at a unique inflection for the stock. The Iran conflict c
Author  Beincrypto
Apr 08, Wed
NVIDIA (NASDAQ: NVDA) stock price trades at $177.64 on the 2-day chart, up 5.31% over the past days but still down 6% year-to-date. April sits at a unique inflection for the stock. The Iran conflict c
placeholder
3 Space Stocks To Watch Amid Elon Musk’s SpaceX IPO HypeA $1.75 trillion IPO is about to redefine which space stocks to watch this summer. SpaceX is closing in on the largest IPO ever. The public S-1 is due late May, with the listing slated for late June o
Author  Beincrypto
May 09, Sat
A $1.75 trillion IPO is about to redefine which space stocks to watch this summer. SpaceX is closing in on the largest IPO ever. The public S-1 is due late May, with the listing slated for late June o
placeholder
A Phone Call From Trump Just Earned Nvidia Stock a Potential 30% BoostNvidia (NVDA) stock price has rallied for seven consecutive sessions since the May 6 breakout, climbing to $227 on May 13. The move sits inside a 32% measured move setup, and the fundamental catalysts
Author  Beincrypto
May 14, Thu
Nvidia (NVDA) stock price has rallied for seven consecutive sessions since the May 6 breakout, climbing to $227 on May 13. The move sits inside a 32% measured move setup, and the fundamental catalysts
placeholder
Prediction markets weigh hardware flaws against Nvidia’s quarterly earnings streakInvestors are waiting for Nvidia’s results on May 20, but concerns about problems with its newest graphics cards are creating uncertainty about what the results will show. The chipmaker will report first-quarter fiscal 2027 earnings next week. Betting platforms tracking business outcomes expect strong results. On Polymarket, users price in about a 97% chance of...
Author  Cryptopolitan
Yesterday 02: 17
Investors are waiting for Nvidia’s results on May 20, but concerns about problems with its newest graphics cards are creating uncertainty about what the results will show. The chipmaker will report first-quarter fiscal 2027 earnings next week. Betting platforms tracking business outcomes expect strong results. On Polymarket, users price in about a 97% chance of...
goTop
quote