


Wells Fargo & Co Stock (WFC) Moved Down by 3.21% on Mar 27: Key Drivers Unveiled
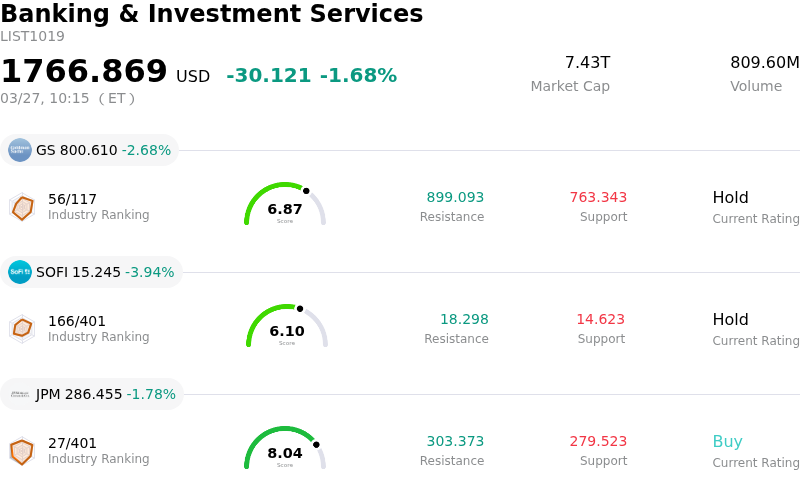
Wells Fargo & Co (WFC) moved down by 3.21%. The Banking & Investment Services sector is down by 1.68%. The company underperformed the industry. Top 3 stocks by turnover in the sector: Goldman Sachs Group Inc (GS) down 2.68%; SoFi Technologies Inc (SOFI) down 3.94%; JPMorgan Chase & Co (JPM) down 1.78%.
What is driving Wells Fargo & Co (WFC)’s stock price down today?
Wells Fargo's shares experienced downward movement today, likely influenced by a confluence of macroeconomic concerns and evolving market sentiment within the financial sector. Investor apprehension appears to stem from renewed worries about inflation and the potential for prolonged higher interest rates. These concerns are partly fueled by geopolitical developments and rising oil prices, which could lead to increased inflationary pressure and a tightening of financial conditions, impacting bank profitability and credit quality.
Adding to this sentiment, while the overall analyst consensus for Wells Fargo remains generally positive, several prominent firms recently lowered their price targets, even while maintaining "Buy" ratings. This adjustment in expectations, coupled with management's own cautionary statements regarding potential credit losses, may be contributing to investor caution. Furthermore, recent reports indicate that some institutional investors have significantly reduced their holdings, and insider selling has also occurred in prior months, which can signal a more cautious outlook to the market.
The banking industry is also navigating regulatory changes, as federal agencies recently re-proposed revisions to capital requirements under the Basel III Endgame framework. While these proposals aim to modernize and simplify rules, the associated uncertainty and the potential for a less stringent regulatory environment carrying increased risk within the banking system could also be weighing on financial stocks. These factors, collectively, are likely driving the observed intraday volatility and downward price action for Wells Fargo.
Technical Analysis of Wells Fargo & Co (WFC)
Technically, Wells Fargo & Co (WFC) shows a MACD (12,26,9) value of [-2.66], indicating a neutral signal. The RSI at 44.22 suggests neutral condition and the Williams %R at -26.13 suggests oversold condition. Please monitor closely.
Fundamental Analysis of Wells Fargo & Co (WFC)
Wells Fargo & Co (WFC) is in the Banking & Investment Services industry. Its latest annual revenue is $81.45B, ranking 3 in the industry. The net profit is $20.29B, ranking 4 in the industry. Company Profile
Over the past month, multiple analysts have rated the company as Buy, with an average price target of $100.37, a high of $113.00, and a low of $79.50.
More details about Wells Fargo & Co (WFC)
Company Specific Risks:
- Multiple analysts have recently lowered their price targets for Wells Fargo, indicating a revised, more cautious outlook on the stock's future performance despite maintaining "Buy" or "Outperform" ratings.
- Valuation analyses from InvestingPro and GuruFocus suggest Wells Fargo's stock may be currently overvalued relative to its estimated fair value, implying potential for downward price correction.
- Truist Securities has noted that its earnings per share estimates for Wells Fargo are slightly below consensus expectations, raising concerns about potential underperformance in future financial results, particularly regarding trading revenue growth and fee revenues.
Recommended Articles


