

Ethereum Price Falls Below $1,700. Hits More Than One-Year Low, Is Now an Epic Buying Opportunity?
TradingKey - Ethereum prices hit a one-year low; historical data suggests a potential decline toward $1,000.
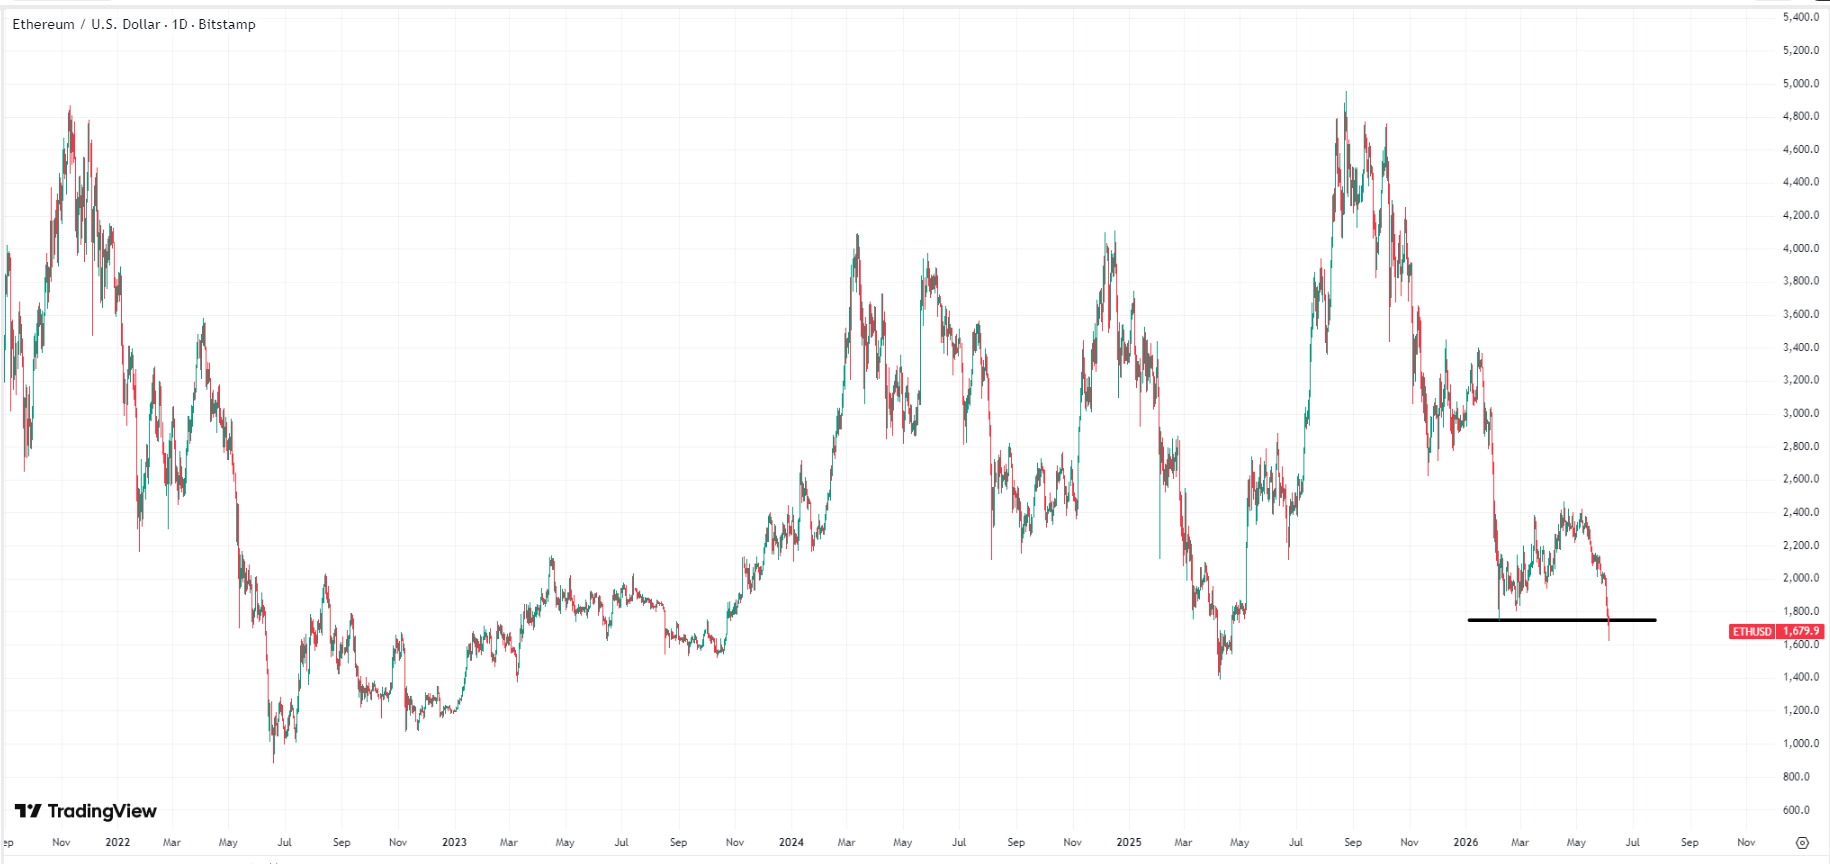
On June 5, Bitcoin ( BTC) prices remained volatile, staying above $60,000 and not breaking below the lows hit in February this year. However, Ethereum ( ETH) prices continued to drop to new lows. In the past 24 hours, the price of Ether saw a maximum decline of over 8%, falling as low as $1,636 and touching its May 2025 low.
 Ethereum price chart, Source: CoinMarketCap
Typically, Ethereum's price action follows Bitcoin. Its lead in breaking below previous lows suggests the market is increasingly pessimistic about its future. Ironically, while U.S. spot Bitcoin ETFs continue to see outflows, spot Ethereum ETFs have seen net inflows yet performed even worse. Why is this happening?
To some extent, this decline in Ethereum was dragged down by Bitcoin's fall, with deeper causes including MicroStrategy's first-ever Bitcoin sale and fading hopes for Federal Reserve rate cuts. However, Ethereum's own intrinsic reasons cannot be overlooked. As of late May 2026, at least eight top executives and core scientists/researchers have departed the Ethereum Foundation, which also sold approximately 20,000 ETH in April and May, cashing out over $40 million and sparking panic within the Ethereum community.
Furthermore, although the Ethereum Layer 2 ecosystem achieved high throughput in the first half of the year, extremely low fees failed to generate the expected token burn rate for the Ethereum mainnet. This caused ETH to shift from "deflationary" back to "slight inflation," weakening the value consensus among long-term holders.
Compared to the record high of around $5,000 set last year, Ether has dropped a cumulative 66%. Does this mean it has bottomed out? Is it a good time to buy now? Based on historical bear market data, drawdowns for altcoins and Ethereum in past extreme bear cycles typically exceed 80%, meaning a further decline toward the $1,000 level is possible.
Bear Market Cycle | All-Time High | Bear Market Low | Maximum Drawdown |
2018 Bear Market | Approx. $1,420 | Approx. $80 | -94% |
2022 Bear Market | Approx. $4,890 | Approx. $880 | -82.0% |
Recommended Articles


