

Life-or-Death Battle for 70,000 Level. Strategy Selling Panic Spreads, Rattling U.S. BTC ETFs to Accelerate Outflows
TradingKey - MicroStrategy's Bitcoin sale triggers further capital flight; prices risk falling below $70,000.
On June 2, Bitcoin ( BTC) prices continued their decline, plunging nearly 4% within the day—a drop significantly larger than those seen over the past two weeks, indicating an acceleration phase. This morning, Bitcoin nearly surrendered the $70,000 psychological level, falling as low as $70,159 and touching a two-month low.
Last night, the world's largest corporate holder of Bitcoin, MicroStrategy ( MSTR ), was reported to have sold Bitcoin, causing its stock price to tumble over 6% in pre-market trading and exacerbating market panic. According to the company's latest 8-K filing with the SEC, MicroStrategy sold 32 Bitcoins between May 26 and May 31.
While MicroStrategy only cashed out approximately $2.5 million, the resulting capital flight from U.S. spot Bitcoin ETFs was 20 times that amount, totaling $483 million; the largest sell-off came from BlackRock's ( BLK ) IBIT, which saw net outflows of $440 million, followed by Fidelity's FBTC and ARK 21Shares' ARKB.
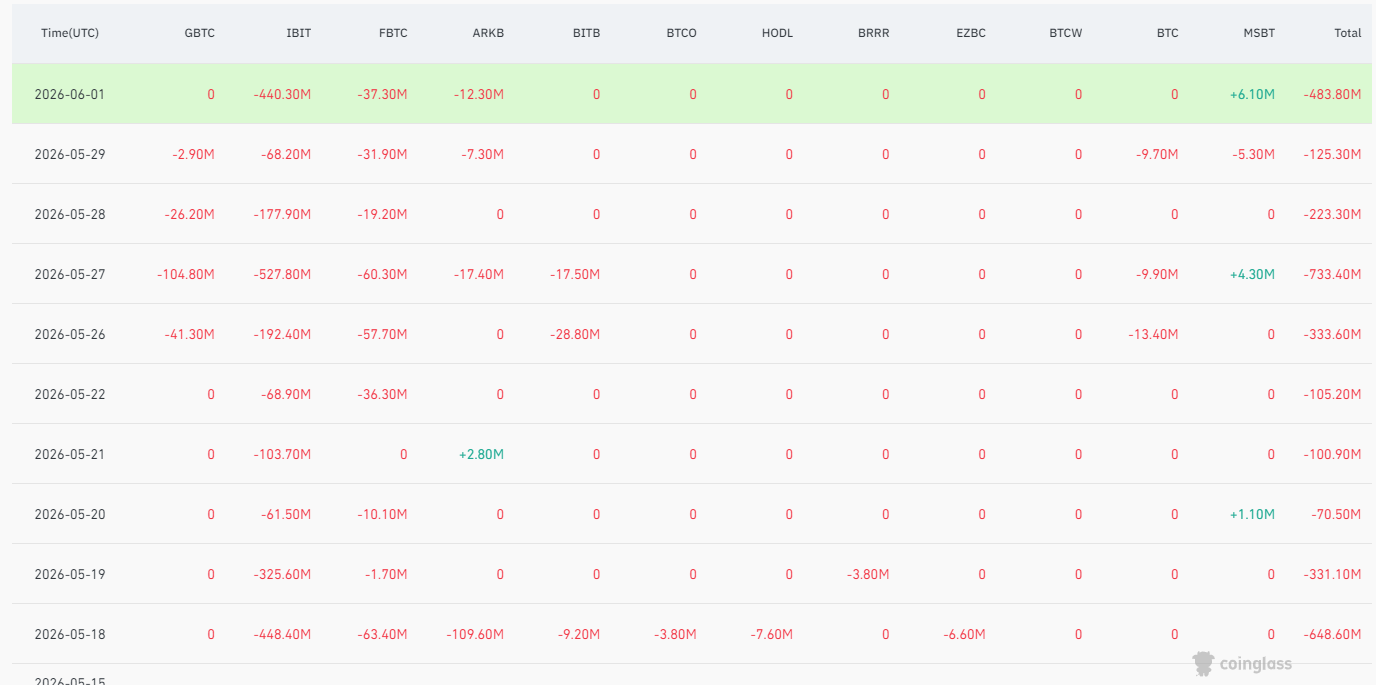 Spot Bitcoin ETF Fund Flows, Source: CoinGlass
Although MicroStrategy emphasized in the filing that the Bitcoin sale was intended to meet cash dividend obligations for its preferred stock, it still sparked panic selling. Over the past two years, the company has repeatedly stated its long-term commitment to 'only buying and never selling.' The sudden official announcement of selling 32 coins sparked short-term FUD, leading to a wave of stop-loss liquidations among highly leveraged long positions near $73,000.
However, this Bitcoin decline cannot be attributed solely to MicroStrategy; it is also linked to the deteriorating geopolitical situation in the Middle East and the upcoming U.S. non-farm payroll (NFP) report. These factors led Wall Street institutional investors to temporarily close risk exposures ahead of high-impact data and geopolitical conflict, a trend confirmed by historical spot Bitcoin ETF flows. Data shows that U.S. spot Bitcoin ETFs began seeing defensive capital flight as early as May 18.
Since May 11, Bitcoin prices have undergone a correction for approximately two consecutive weeks, with market panic deepening. However, the current sentiment index is at 31, not yet in the 'extreme fear' zone (below 20), suggesting further downside potential. Additionally, the RSI is at 27, having just entered oversold territory, indicating that prices may continue to slide. Both sentiment and technical indicators suggest the $70,000 level is unlikely to hold, with a probable retest of the February 6 low of $60,000.
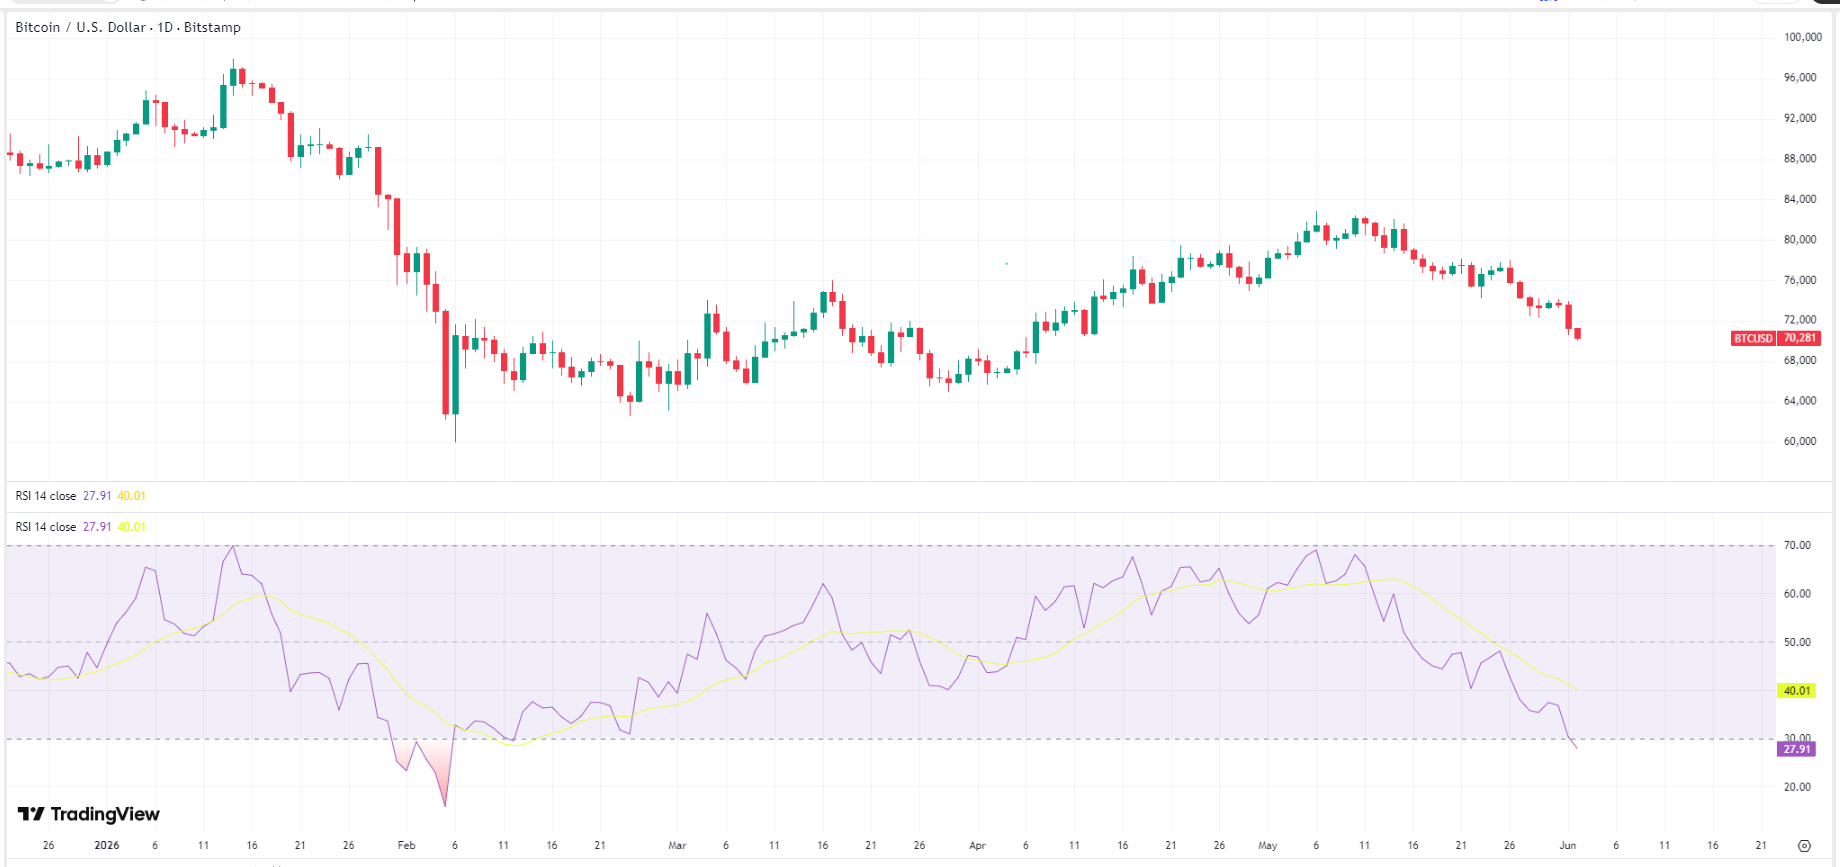 Bitcoin Price Chart, Source: TradingView
Recommended Articles


