Quant Price Forecast: QNT poised for next leg higher as buy-side pressure builds

แหล่งที่มา Fxstreet
  • Quant price holds steady near $100.70 on Thursday after rebounding from a key support level earlier this week.
  • On-chain metrics highlight bullish momentum, with QNT’s Spot Taker CVD turning positive and trending upward.
  • Robinhood EU expands crypto offerings, enabling European users to trade QNT tokens.

Quant (QNT) price is stabilizing near $100.70 on Thursday after rebounding from a key support level earlier this week. On-chain data reinforces the bullish outlook, with QNT’s Spot Taker Cumulative Volume Delta (CVD) turning positive and trending upward, signaling increased buy-side dominance. Adding to the positive sentiment, Robinhood EU has announced that its European customers can now access QNT trading, potentially expanding the token’s investor base.

Quant bulls take control of the momentum

CryptoQuant data, as shown in the graph below, highlights buying pressure on Quant. The Taker CVD (Cumulative Volume Delta) for QNT has been positive, has increased since mid-April, and is reaching levels not seen since February. This indicator measures the cumulative difference between market buy and sell volumes over 3 months. When 90-day CVD is positive and increasing, it suggests the Taker Buy Dominant Phase, while a negative and decreasing value indicates the Taker Sell Dominant Phase.

QNT Spot Taker CVD chart. Source: CryptoQuant

QNT Spot Taker CVD chart. Source: CryptoQuant

On Monday, Robinhood Crypto EU announced that it is expanding crypto offerings, enabling European users to trade QNT tokens. It also added Solana blockchain memecoins Popcat (POPCAT) and Peanut the Squirrel (PNUT).

Listing these tokens is a positive catalyst that will likely drive short-term price increases due to increased visibility and retail investor access. However, the longevity of these price movements depends on sustained trading volume, community engagement, and broader market conditions.

Quant Price Forecast: QNT rebounds from key support level

Quant price retested and found support around the daily level at $94.3 on Tuesday, and rebounded the next day. At the time of writing on Thursday, it hovers around $100.7.

If QNT holds above the daily support at $94.3, it could extend the rally to retest its 50% price retracement level (drawn from the December high of $171.7 to the April low of $59.2) at $115.4.

The Relative Strength Index (RSI) on the daily chart reads 71 above its overbought level of 70, pointing upwards, indicating strong bullish momentum. However, traders should be cautious as the chances of a pullback are high due to the overbought condition. Another possibility is that the RSI remains above the overbought level of 70 and continues its upward trend.
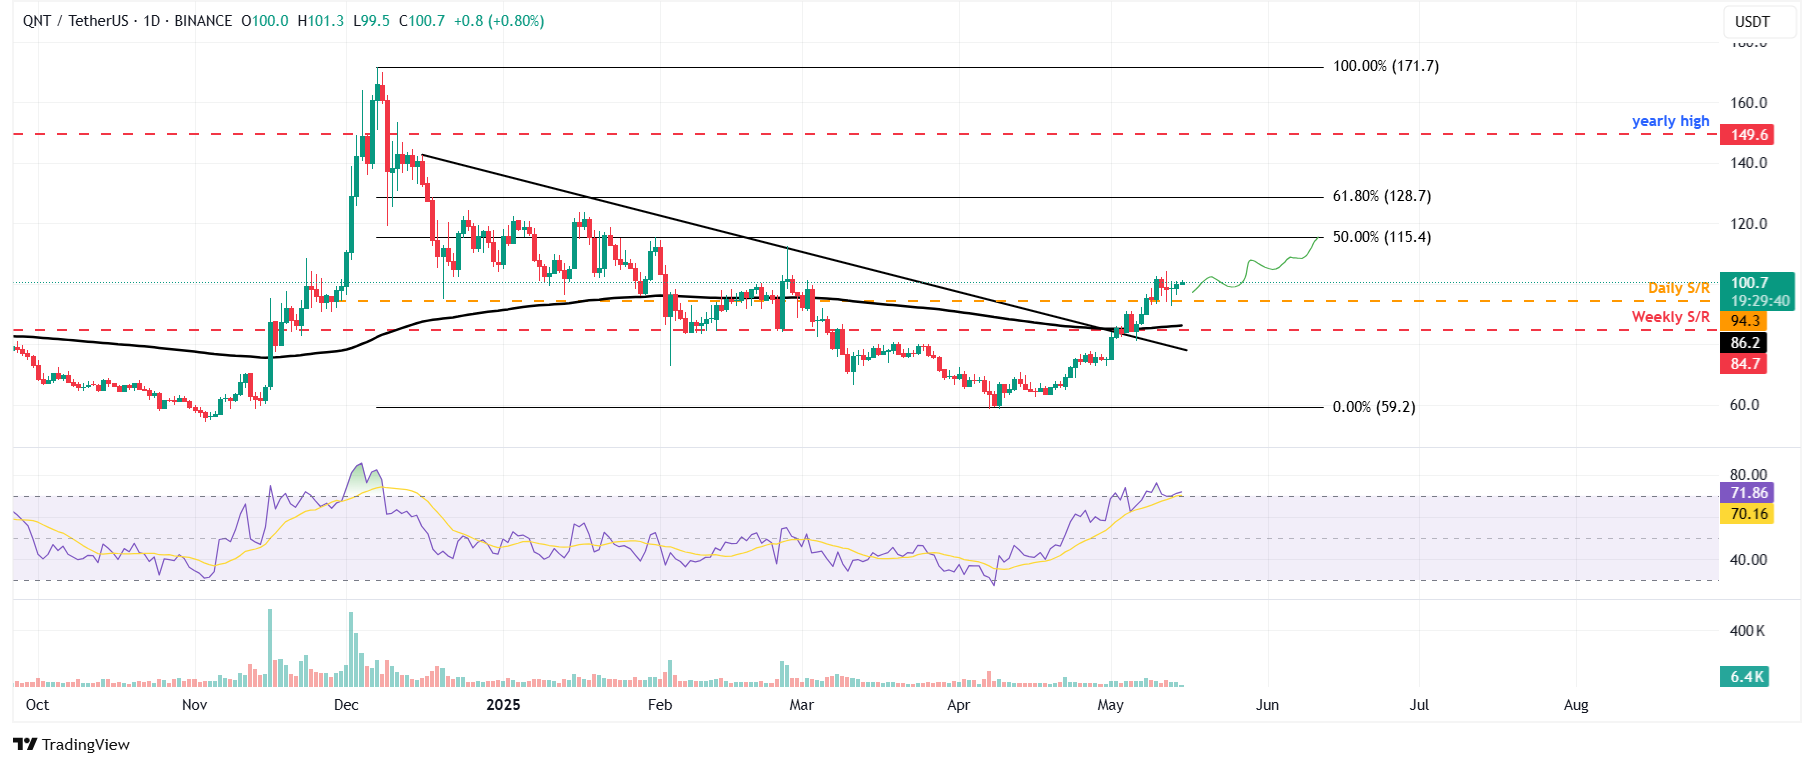
QNT/USDT daily chart

QNT/USDT daily chart

However, if QNT closes below $94.3, it would extend the decline to retest its next weekly support at $84.2.

ข้อจำกัดความรับผิดชอบ: เพื่อการอ้างอิงเท่านั้น ผลการดำเนินงานในอดีตไม่ได้บ่งบอกถึงผลลัพธ์ในอนาคต
placeholder
Coinbase พุ่งกว่า 10%! ร่วม S&P 500 กลายเป็นดาวเด่นใหม่ของคริปโตTradingKey – Coinbase ได้รับคัดเลือกเข้าเป็นสมาชิกในดัชนี S&P 500 ส่งผลให้ราคาหุ้นทะยานขึ้นมากกว่า 10% และสะท้อนถึงอิทธิพลที่เพิ่มขึ้นของคริปโตในตลาดแบบดั้งเดิมเมื่อวันจันทร์ที่ 12 พฤษภาคม (เวลา ET) S
ผู้เขียน  TradingKey
5 เดือน 13 วัน อังคาร
TradingKey – Coinbase ได้รับคัดเลือกเข้าเป็นสมาชิกในดัชนี S&P 500 ส่งผลให้ราคาหุ้นทะยานขึ้นมากกว่า 10% และสะท้อนถึงอิทธิพลที่เพิ่มขึ้นของคริปโตในตลาดแบบดั้งเดิมเมื่อวันจันทร์ที่ 12 พฤษภาคม (เวลา ET) S
placeholder
WTI ปรับตัวขึ้นต่อเหนือ $63.00 หลังจากความตึงเครียดทางการค้าลดลงน้ำมันดิบเวสต์เทกซัสอินเตอร์มีเดียต (WTI) ซึ่งเป็นเกณฑ์มาตรฐานน้ำมันดิบของสหรัฐฯ ซื้อขายอยู่ที่ประมาณ 63.25 ดอลลาร์ในช่วงเวลาการซื้อขายของเอเชียในวันพุธ ราคาของ WTI ขยายตัวขึ้นท่ามกลางความตึงเครียดทางการค้าที่ลดลงระหว่างสหรัฐฯ และจีน ซึ่งกระตุ้นให้เทรดเดอร์ลดความน่าจะเป็นของภาวะถดถอย
ผู้เขียน  FXStreet
เมื่อวาน 01: 38
น้ำมันดิบเวสต์เทกซัสอินเตอร์มีเดียต (WTI) ซึ่งเป็นเกณฑ์มาตรฐานน้ำมันดิบของสหรัฐฯ ซื้อขายอยู่ที่ประมาณ 63.25 ดอลลาร์ในช่วงเวลาการซื้อขายของเอเชียในวันพุธ ราคาของ WTI ขยายตัวขึ้นท่ามกลางความตึงเครียดทางการค้าที่ลดลงระหว่างสหรัฐฯ และจีน ซึ่งกระตุ้นให้เทรดเดอร์ลดความน่าจะเป็นของภาวะถดถอย
placeholder
USDCAD อ่อนค่าลงต่ำกว่า 1.3950 เนื่องจากเงินเฟ้อในสหรัฐฯ ชะลอตัวลงมากกว่าที่คาดการณ์ไว้ในเดือนเมษายนในช่วงเช้าของตลาดลงทุนเอเชียวันพุธ คู่ USDCAD ปรับตัวลดลงใกล้ 1.3925 ดอลลาร์สหรัฐ (USD) ขยับลงเมื่อเทียบกับดอลลาร์แคนาดา (CAD) หลังจากข้อมูลอัตราเงินเฟ้อออกมาต่ำกว่าคาดการณ์ของตลาด
ผู้เขียน  FXStreet
เมื่อวาน 02: 39
ในช่วงเช้าของตลาดลงทุนเอเชียวันพุธ คู่ USDCAD ปรับตัวลดลงใกล้ 1.3925 ดอลลาร์สหรัฐ (USD) ขยับลงเมื่อเทียบกับดอลลาร์แคนาดา (CAD) หลังจากข้อมูลอัตราเงินเฟ้อออกมาต่ำกว่าคาดการณ์ของตลาด
placeholder
การคาดการณ์ราคาของ WTI: ขาขึ้นมีความได้เปรียบเมื่ออยู่เหนือ $62.00/200-period SMA บนกราฟ H4ราคาน้ำมันดิบ West Texas Intermediate (WTI) ของสหรัฐฯ ยังคงอยู่ในภาวะซบเซาตลอดช่วงเซสชั่นยุโรปในวันพุธ และในขณะนี้ ดูเหมือนว่าจะหยุดสตรีคการปรับตัวขึ้นติดต่อกันเป็นเวลา 4 วันที่ระดับกลาง $63.00 หรือสูงกว่าระดับสูงสุดในรอบสองสัปดาห์ที่แตะเมื่อวันก่อน
ผู้เขียน  FXStreet
เมื่อวาน 09: 40
ราคาน้ำมันดิบ West Texas Intermediate (WTI) ของสหรัฐฯ ยังคงอยู่ในภาวะซบเซาตลอดช่วงเซสชั่นยุโรปในวันพุธ และในขณะนี้ ดูเหมือนว่าจะหยุดสตรีคการปรับตัวขึ้นติดต่อกันเป็นเวลา 4 วันที่ระดับกลาง $63.00 หรือสูงกว่าระดับสูงสุดในรอบสองสัปดาห์ที่แตะเมื่อวันก่อน
placeholder
การคาดการณ์ราคาเงิน: XAG/USD ลดลงมากกว่า 2% จากผลตอบแทนพันธบัตรสหรัฐที่สูง อยู่ใกล้ระดับ $32.00ราคาโลหะเงินลดลง 2% ในวันพุธท่ามกลางอัตราผลตอบแทนพันธบัตรรัฐบาลสหรัฐฯ ที่สูงขึ้น เนื่องจากนักลงทุนดูเหมือนมั่นใจว่าธนาคารกลางสหรัฐฯ (เฟด) จะไม่ปรับลดอัตราดอกเบี้ย ในขณะที่เขียนบทความนี้ XAG/USD ซื้อขายอยู่ที่ 32.20 ดอลลาร์ ไม่เปลี่ยนแปลงเมื่อเริ่มต้นเซสชันเอเชีย
ผู้เขียน  FXStreet
9 ชั่วโมงที่แล้ว
ราคาโลหะเงินลดลง 2% ในวันพุธท่ามกลางอัตราผลตอบแทนพันธบัตรรัฐบาลสหรัฐฯ ที่สูงขึ้น เนื่องจากนักลงทุนดูเหมือนมั่นใจว่าธนาคารกลางสหรัฐฯ (เฟด) จะไม่ปรับลดอัตราดอกเบี้ย ในขณะที่เขียนบทความนี้ XAG/USD ซื้อขายอยู่ที่ 32.20 ดอลลาร์ ไม่เปลี่ยนแปลงเมื่อเริ่มต้นเซสชันเอเชีย
goTop
quote