

Dow Jones Industrial Average battles low side after Durable Goods miss
- The Dow Jones is fighting to regain its balance after getting knocked lower.
- Overall market flows are constrained with a holiday-shortened week on the cards.
- US Durable Goods Orders fell more than expected in November.
The Dow Jones Industrial Average (DJIA) weakened to kick off the Christmas trading week, falling a little over 500 points at its lowest before staging a meager recovery to -100 points on Monday. The Dow Jones is grappling with chart territory south of 43,000 following a ten-day backslide that dragged the major equity index back underneath record bids above 45,000.
US Durable Goods Orders contracted further than expected in November, declining 1.1% MoM compared to October’s revised 0.8% upswing. Investors expected a print of -0.4%. Declines in consumer durable goods were concentrated in automotive purchases, as US Durable Goods Orders excluding Transportation fell by a meager 0.1% MoM. Median markets forecasts had expected a better core Durable Goods Orders growth of 0.3% in November.
Overall market flows are constrained during the Christmas holiday-shortened trading week. Markets will be shuttered during the midweek market session, and trading volumes are set to remain constrained throughout the entire week.
Dow Jones news
The Dow Jones has moderated after snapping it’s longest losing streak since the 70s, where the index closed lower for ten consecutive trading sessions. Most of the Dow Jones is stuck on the low side of Monday’s opening bids, but firm tech gains have limited downside losses for the broader index.
Nvidia (NVDA) rallied 3.2% and crossed above $139 per share as the broad-market tech rally continues to float on the high side. On the low side, retail giant Walmart declined 2.2%, falling to $90 per share for the first time in a month. According to the Consumer Financial Protection Bureau, the federal consumer protection agency is suing Walmart after it was revealed that Walmart unlawfully requires delivery drivers to use an expensive app with one of the consumer giant’s fintech partners, Branch Messenger.
Dow Jones price forecast
A near-term backslide has left the Dow Jones battling chart territory just south of 43,000. Price action has slipped back below the 50-day Exponential Moving Average (EMA) which is rolling over near 43,350, but a clear technical floor is getting priced in near the 42,000 handle.
Buyers will be looking for a chance to step back into another leg higher from here, though momentum traders may be waiting for a confirming close back above 43,500. On the low side, bears will be looking for a continuation to the 200-day EMA near 41,000.
Dow Jones daily chart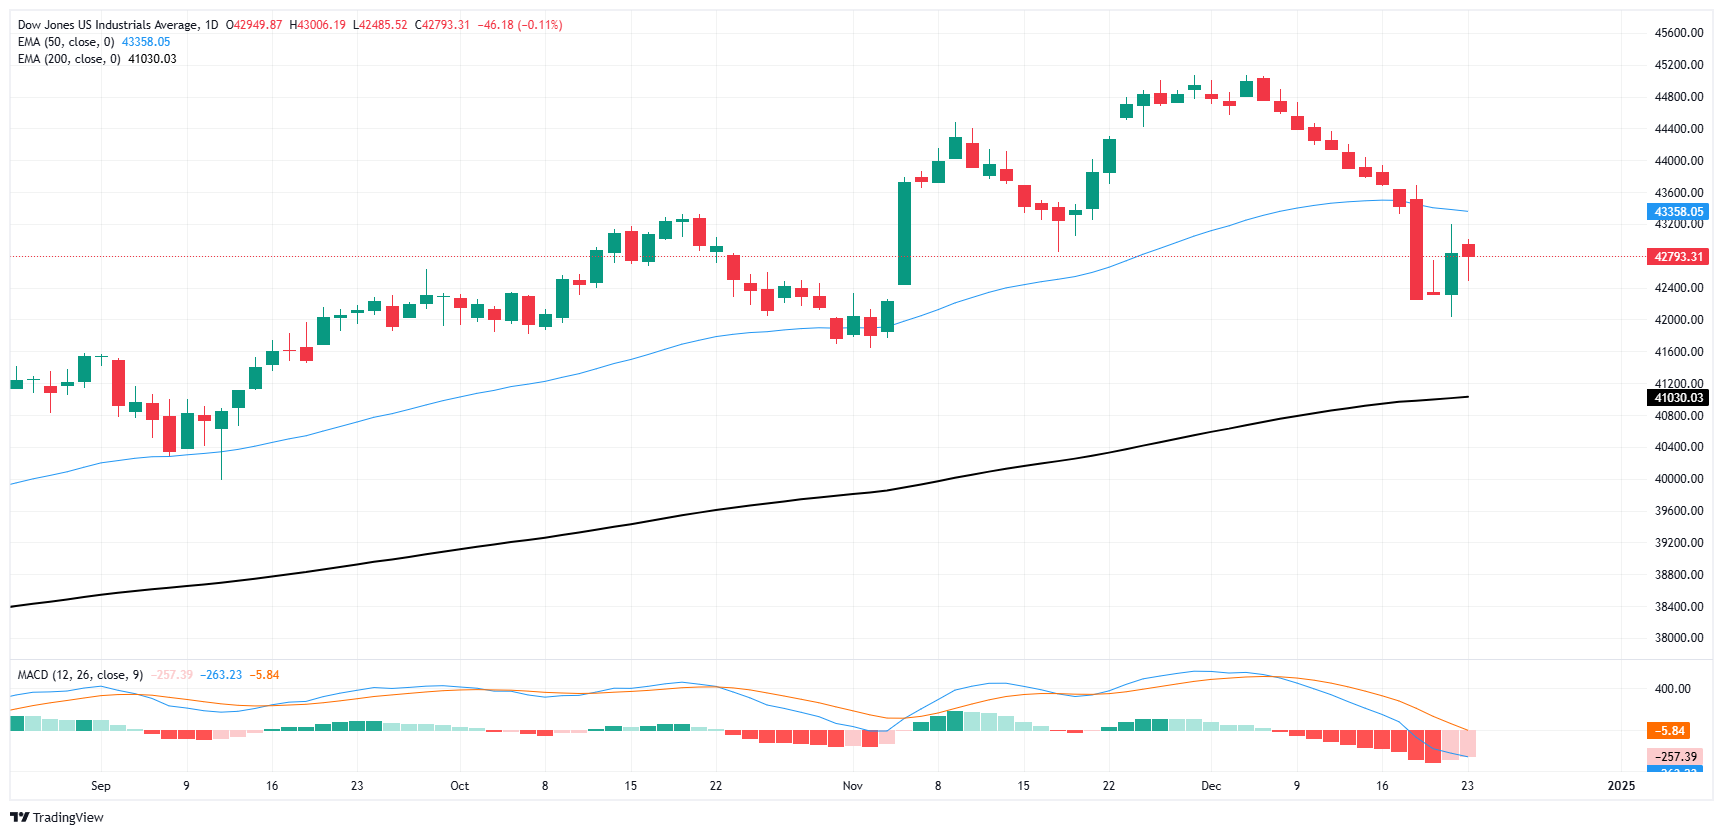
Dow Jones FAQs
The Dow Jones Industrial Average, one of the oldest stock market indices in the world, is compiled of the 30 most traded stocks in the US. The index is price-weighted rather than weighted by capitalization. It is calculated by summing the prices of the constituent stocks and dividing them by a factor, currently 0.152. The index was founded by Charles Dow, who also founded the Wall Street Journal. In later years it has been criticized for not being broadly representative enough because it only tracks 30 conglomerates, unlike broader indices such as the S&P 500.
Many different factors drive the Dow Jones Industrial Average (DJIA). The aggregate performance of the component companies revealed in quarterly company earnings reports is the main one. US and global macroeconomic data also contributes as it impacts on investor sentiment. The level of interest rates, set by the Federal Reserve (Fed), also influences the DJIA as it affects the cost of credit, on which many corporations are heavily reliant. Therefore, inflation can be a major driver as well as other metrics which impact the Fed decisions.
Dow Theory is a method for identifying the primary trend of the stock market developed by Charles Dow. A key step is to compare the direction of the Dow Jones Industrial Average (DJIA) and the Dow Jones Transportation Average (DJTA) and only follow trends where both are moving in the same direction. Volume is a confirmatory criteria. The theory uses elements of peak and trough analysis. Dow’s theory posits three trend phases: accumulation, when smart money starts buying or selling; public participation, when the wider public joins in; and distribution, when the smart money exits.
There are a number of ways to trade the DJIA. One is to use ETFs which allow investors to trade the DJIA as a single security, rather than having to buy shares in all 30 constituent companies. A leading example is the SPDR Dow Jones Industrial Average ETF (DIA). DJIA futures contracts enable traders to speculate on the future value of the index and Options provide the right, but not the obligation, to buy or sell the index at a predetermined price in the future. Mutual funds enable investors to buy a share of a diversified portfolio of DJIA stocks thus providing exposure to the overall index.
Artigos Recomendados


