

US Dollar faces make or break moment ahead of US CPI
- The US Dollar on the backfoot ahead of US CPI for July later on Wednesday.
- Massive risk-on on Tuesday crushed the Greenback across the board.
- The US Dollar index trades in the mid-102.00 range and could trade in another ballpark by the closing bell.
The US Dollar (USD) trades lower again, as measured by the US Dollar Index (DXY), in the European session on Wednesday following a 0.50% decline a day before. The US Dollar snapped under pressure after a massive wave of risk-on pushed US equities higher and sent US yields lower on Tuesday. The biggest reason for that move was weaker Producer Price Index (PPI) data on all fronts and segments in July, which hypes up the upcoming consumer inflation number with elevated expectations of coming in softer than expected.
On the economic data front, the US Consumer Price Index (CPI) for July will be key on Wednesday. If the PPI data from Tuesday holds any relevance, traders will want to gear up for some volatility going into the US CPI number. Ahead of the US data, Europe will release the preliminary Gross Domestic Product (GDP) for the second quarter, which might also move the US Dollar Index.
Daily digest market movers: CPI ahead of Jackson Hole
- Japan must seek a new prime minister as Fumio Kishida does not want to run for a second term.
- The Royal Bank of New Zealand (RBNZ) surprised the market with a 25 basis point interest rate cut during the Asian session on Wednesday and the message that the cutting cycle has started. RBNZ Chairman Adrian Orr even said that a 50 basis point cut was on the table for this meeting. A comment that sent the New Zealand Dollar 1% lower against the US Dollar.
- At 11:00 GMT, the Mortgage Bankers Association (MBA) will release its weekly Mortgage Applications Index for the week ending August 9. The previous week, it was up 6.9%
- At 12:30 GMt, the US consumer inflation data for July will be released:
- Headline monthly CPI inflation is expected to rise by 0.2% in July following the -0.1% the month before. The yearly benchmark is expected to remain at 3.0%.
- Core monthly CPI inflation is expected to increase by 0.2% after the 0.1% in June. The yearly gauge is expected to soften to 3.2% from 3.3%.
- Equity markets are rallying higher in Japan based on the political news that a new prime minister needs to be found. The Topix trades up over 1%, while the Nikkei lags by 0.4%. European equities are up less than 0.5%, while US futures are flat, awaiting the US CPI release.
- The CME Fedwatch Tool shows a 47.5% chance of a 25 basis points (bps) interest rate cut by the Fed in September against a 52.5% chance for a 50 bps cut. Another 25 bps cut (if September is a 25 bps cut) is expected in November by 31.5%, while there is a 50.8% chance that rates will be 75 bps below the current levels and a 17.7% probability of rates being 100 basis points lower.
- The US 10-year benchmark rate trades at 3.84% and slips further away to fresh lows for this week.
US Dollar Index Technical Analysis: Not going quietly
The US Dollar Index (DXY) has moved away from the crucial 103.18 pivotal level following the surprise PPI release on Tuesday. From a technical perspective, a slide below 103.00 suggests more downside should be at hand. The DXY will need to decline further, pulling the Relative Strength Index (RSI) into oversold to see ample support and sending it back up towards 103.00.
A two-tiered recovery can be taken away from the charts, with the first resistance(yes, again, the same level we have been talking about since last week) at 103.18, where the DXY has been unable to hold above in recent days. Once bulls can hold that level and move away from it, 104.00 comes into play. However, further upside is limited as the 200-day Simple Moving Average (SMA) at 104.12 will throw a spanner in the works in the near term.
On the downside, the oversold condition in the Relative Strength Index (RSI) indicator has eased in the daily chart and holds room for a small leg lower. Support nearby is the August 5 low at 102.17. Once through there, pressure will start to build on 102.00 as a big psychological figure before testing 101.90, which was a pivotal level in December 2023 and January 2024.
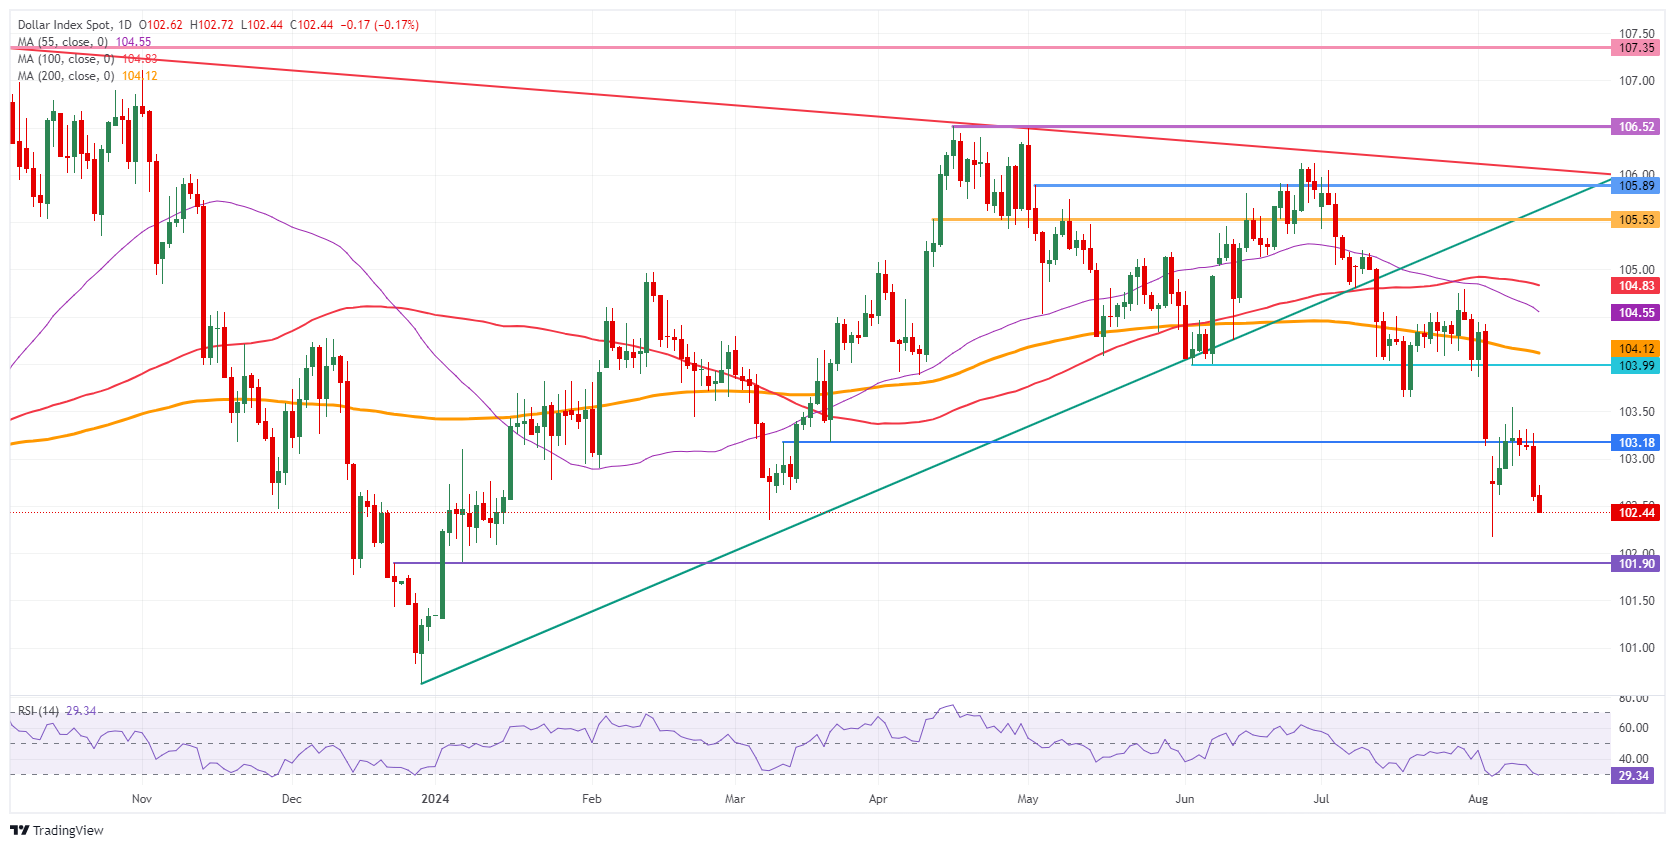
US Dollar Index: Daily Chart
US Dollar FAQs
The US Dollar (USD) is the official currency of the United States of America, and the ‘de facto’ currency of a significant number of other countries where it is found in circulation alongside local notes. It is the most heavily traded currency in the world, accounting for over 88% of all global foreign exchange turnover, or an average of $6.6 trillion in transactions per day, according to data from 2022. Following the second world war, the USD took over from the British Pound as the world’s reserve currency. For most of its history, the US Dollar was backed by Gold, until the Bretton Woods Agreement in 1971 when the Gold Standard went away.
The most important single factor impacting on the value of the US Dollar is monetary policy, which is shaped by the Federal Reserve (Fed). The Fed has two mandates: to achieve price stability (control inflation) and foster full employment. Its primary tool to achieve these two goals is by adjusting interest rates. When prices are rising too quickly and inflation is above the Fed’s 2% target, the Fed will raise rates, which helps the USD value. When inflation falls below 2% or the Unemployment Rate is too high, the Fed may lower interest rates, which weighs on the Greenback.
In extreme situations, the Federal Reserve can also print more Dollars and enact quantitative easing (QE). QE is the process by which the Fed substantially increases the flow of credit in a stuck financial system. It is a non-standard policy measure used when credit has dried up because banks will not lend to each other (out of the fear of counterparty default). It is a last resort when simply lowering interest rates is unlikely to achieve the necessary result. It was the Fed’s weapon of choice to combat the credit crunch that occurred during the Great Financial Crisis in 2008. It involves the Fed printing more Dollars and using them to buy US government bonds predominantly from financial institutions. QE usually leads to a weaker US Dollar.
Quantitative tightening (QT) is the reverse process whereby the Federal Reserve stops buying bonds from financial institutions and does not reinvest the principal from the bonds it holds maturing in new purchases. It is usually positive for the US Dollar.
Artigos Recomendados


