

Dogwifhat price sets for 12% rally

Fonte Fxstreet
  • Dogwifhat price breaks above a descending trendline, suggesting a bullish move.
  • WIF price action shows a formation of a double bottom pattern, hints at a potential trend reversal ahead.
  • A daily candlestick close below $1.482 would invalidate the bullish thesis.

Dogwifhat (WIF) price broke above a descending trendline on Monday, suggesting a potential bullish move. At the time of writing, it is slightly up 1% at $2.171 on Tuesday. Additionally, WIF's price action reveals the formation of a double bottom pattern, signaling a possible trend reversal on the horizon.


Dogwifhat price shows potential for a rally

Dogwifhat's price peaked at $2.361 in the second half of June after bouncing off the $1.547 level. This support level has been tested again recently. This 'W’-like structure (double-bottom pattern) is a bottom reversal pattern that often hints at a potential trend reversal, favoring the bulls. If bullish momentum persists and WIF can break the resistance at $2.361, it is likely to rally 12% to $2.644, the high from June 17. 

The Relative Strength Index (RSI) on the daily chart is firmly above the neutral level of 50, while the Awesome Oscillator (AO) is on its way to doing the same. If bulls are indeed making a comeback, then both momentum indicators must maintain their positions above their respective mean levels. Such a development would add a tailwind to the recovery rally.

Furthermore, surpassing the $2.644 level could pave the way for an additional 16% rally to retest $3.087, the 61.8% Fibonacci retracement level drawn from a swing high of $4.080 from May 29 to a swing low of $1.482 from June 24.
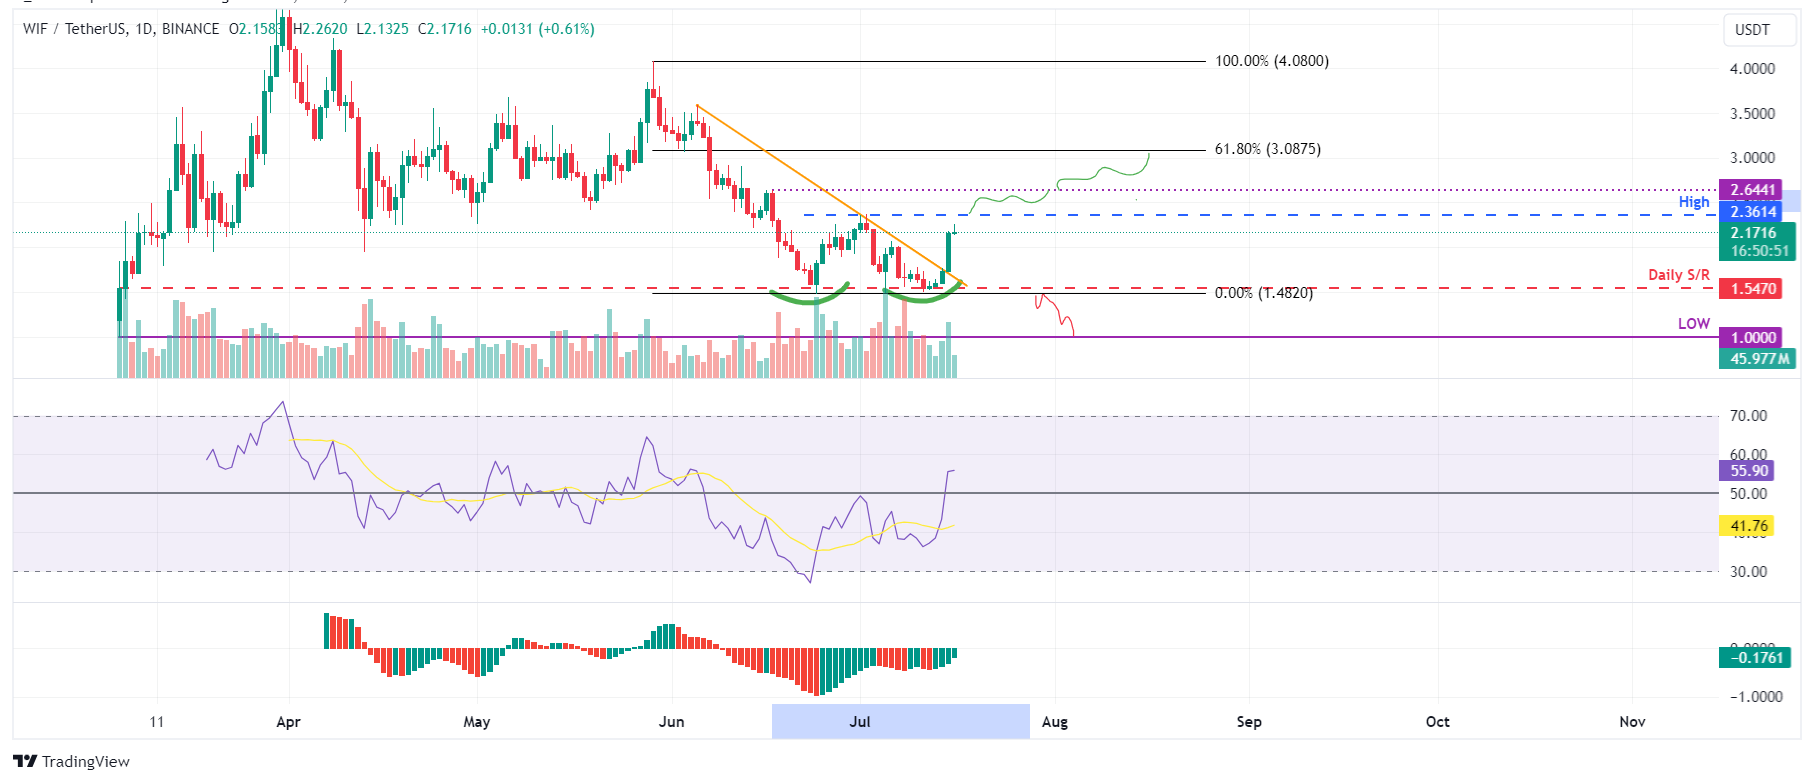
WIF/USDT daily chart

WIF/USDT daily chart

However, if Dogwifhat's daily candlestick closes below $1.482, the price will form a lower low relative to the June 24 low, resuming WIF's downtrend. This will refute the bullish argument, leading to a 33% crash to retest its March 5 low of $1.

Isenção de responsabilidade: Apenas para fins informativos. O desempenho passado não é indicativo de resultados futuros.
placeholder
Ações do Japão e da Coreia do Sul divergem: Nikkei 225 sobe quase 2%, Kospi cai 0,48% após queda de 18,8% no terceiro trimestreTradingKey - Em 30 de setembro, os mercados de ações do Japão e da Coreia do Sul divergiram, com as ações japonesas se fortalecendo significativamente, enquanto os papéis sul-coreanos registraram leve
Autor  TradingKey
14 horas atrás
TradingKey - Em 30 de setembro, os mercados de ações do Japão e da Coreia do Sul divergiram, com as ações japonesas se fortalecendo significativamente, enquanto os papéis sul-coreanos registraram leve
placeholder
Previsão do Preço do Ouro: PCE de Agosto dos EUA Iminente, o Preço do Ouro Vai Subir ou Cair no Curto Prazo?TradingKey - Na sessão europeia de 30 de setembro, os preços do ouro (XAUUSD) continuaram a se recuperar após uma forte queda no início desta semana, retomando o patamar de US$ 4.200 no intradiário, c
Autor  TradingKey
14 horas atrás
TradingKey - Na sessão europeia de 30 de setembro, os preços do ouro (XAUUSD) continuaram a se recuperar após uma forte queda no início desta semana, retomando o patamar de US$ 4.200 no intradiário, c
placeholder
Previsão do Preço do Ouro: Ouro despenca para a mínima de sete semanas, o suporte de US$ 4.100 vai resistir?TradingKey - O ouro à vista (XAUUSD) despencou 4% na segunda-feira, fechando a US$ 4.114,93 por onça-troy, após atingir a mínima intradia de US$ 4.110,80, seu menor nível desde 5 de agosto. No início
Autor  TradingKey
Ontem 09: 21
TradingKey - O ouro à vista (XAUUSD) despencou 4% na segunda-feira, fechando a US$ 4.114,93 por onça-troy, após atingir a mínima intradia de US$ 4.110,80, seu menor nível desde 5 de agosto. No início
placeholder
Ações japonesas e sul-coreanas fecham em queda; Nikkei 225 cai 0,6%, Kospi recua 0,27%, Samsung contraria tendência e sobe quase 1%TradingKey - Em 29 de setembro, os mercados acionários do Japão e da Coreia do Sul mantiveram-se fracos no pregão da tarde, com o aumento do sentimento de cautela no mercado. O índice Nikkei 225 do Ja
Autor  TradingKey
Ontem 09: 19
TradingKey - Em 29 de setembro, os mercados acionários do Japão e da Coreia do Sul mantiveram-se fracos no pregão da tarde, com o aumento do sentimento de cautela no mercado. O índice Nikkei 225 do Ja
placeholder
Ações do Japão e da Coreia do Sul recuam enquanto Kospi cai 2,7%, Samsung e SK Hynix caem mais de 5% e Kioxia recua mais de 4%TradingKey - Em 28 de setembro, os mercados de ações do Japão e da Coreia do Sul caíram em conjunto, com as perdas no mercado sul-coreano se ampliando significativamente. O índice KOSPI da Coreia do S
Autor  TradingKey
9 Mês 28 Dia Seg
TradingKey - Em 28 de setembro, os mercados de ações do Japão e da Coreia do Sul caíram em conjunto, com as perdas no mercado sul-coreano se ampliando significativamente. O índice KOSPI da Coreia do S
goTop
quote