

Pi Network Price Forecast: Steady decline risks a lower leg below $0.080

Fonte Fxstreet
  • Pi Network is down over 4% on Wednesday, extending a steady decline over the past seven days.
  • Social chatter surrounding the PI token surges to an annual high of 0.16% on Tuesday.
  • The technical outlook for PI is bearish, risking a breakout below the crucial support level near $0.0801.

Pi Network (PI) continues to extend a bearish phase over the last seven days, risking a breakout below the $0.0800 round figure. The social chatter surrounding the PI token is on the rise, likely driven by investors’ fear. The technical outlook for Pi Network suggests a downside bias as bearish momentum persists. 

Social chatter warns of investors’ panic

Pi Network is gaining social interest despite its declining spot price. Santiment data shows a surge in social dominance to 0.16% on Tuesday, up from 0.03% the previous day. This increase in social buzz surrounding the PI token coincides with the recent bearish phase, suggesting a potential stress building among investors. 
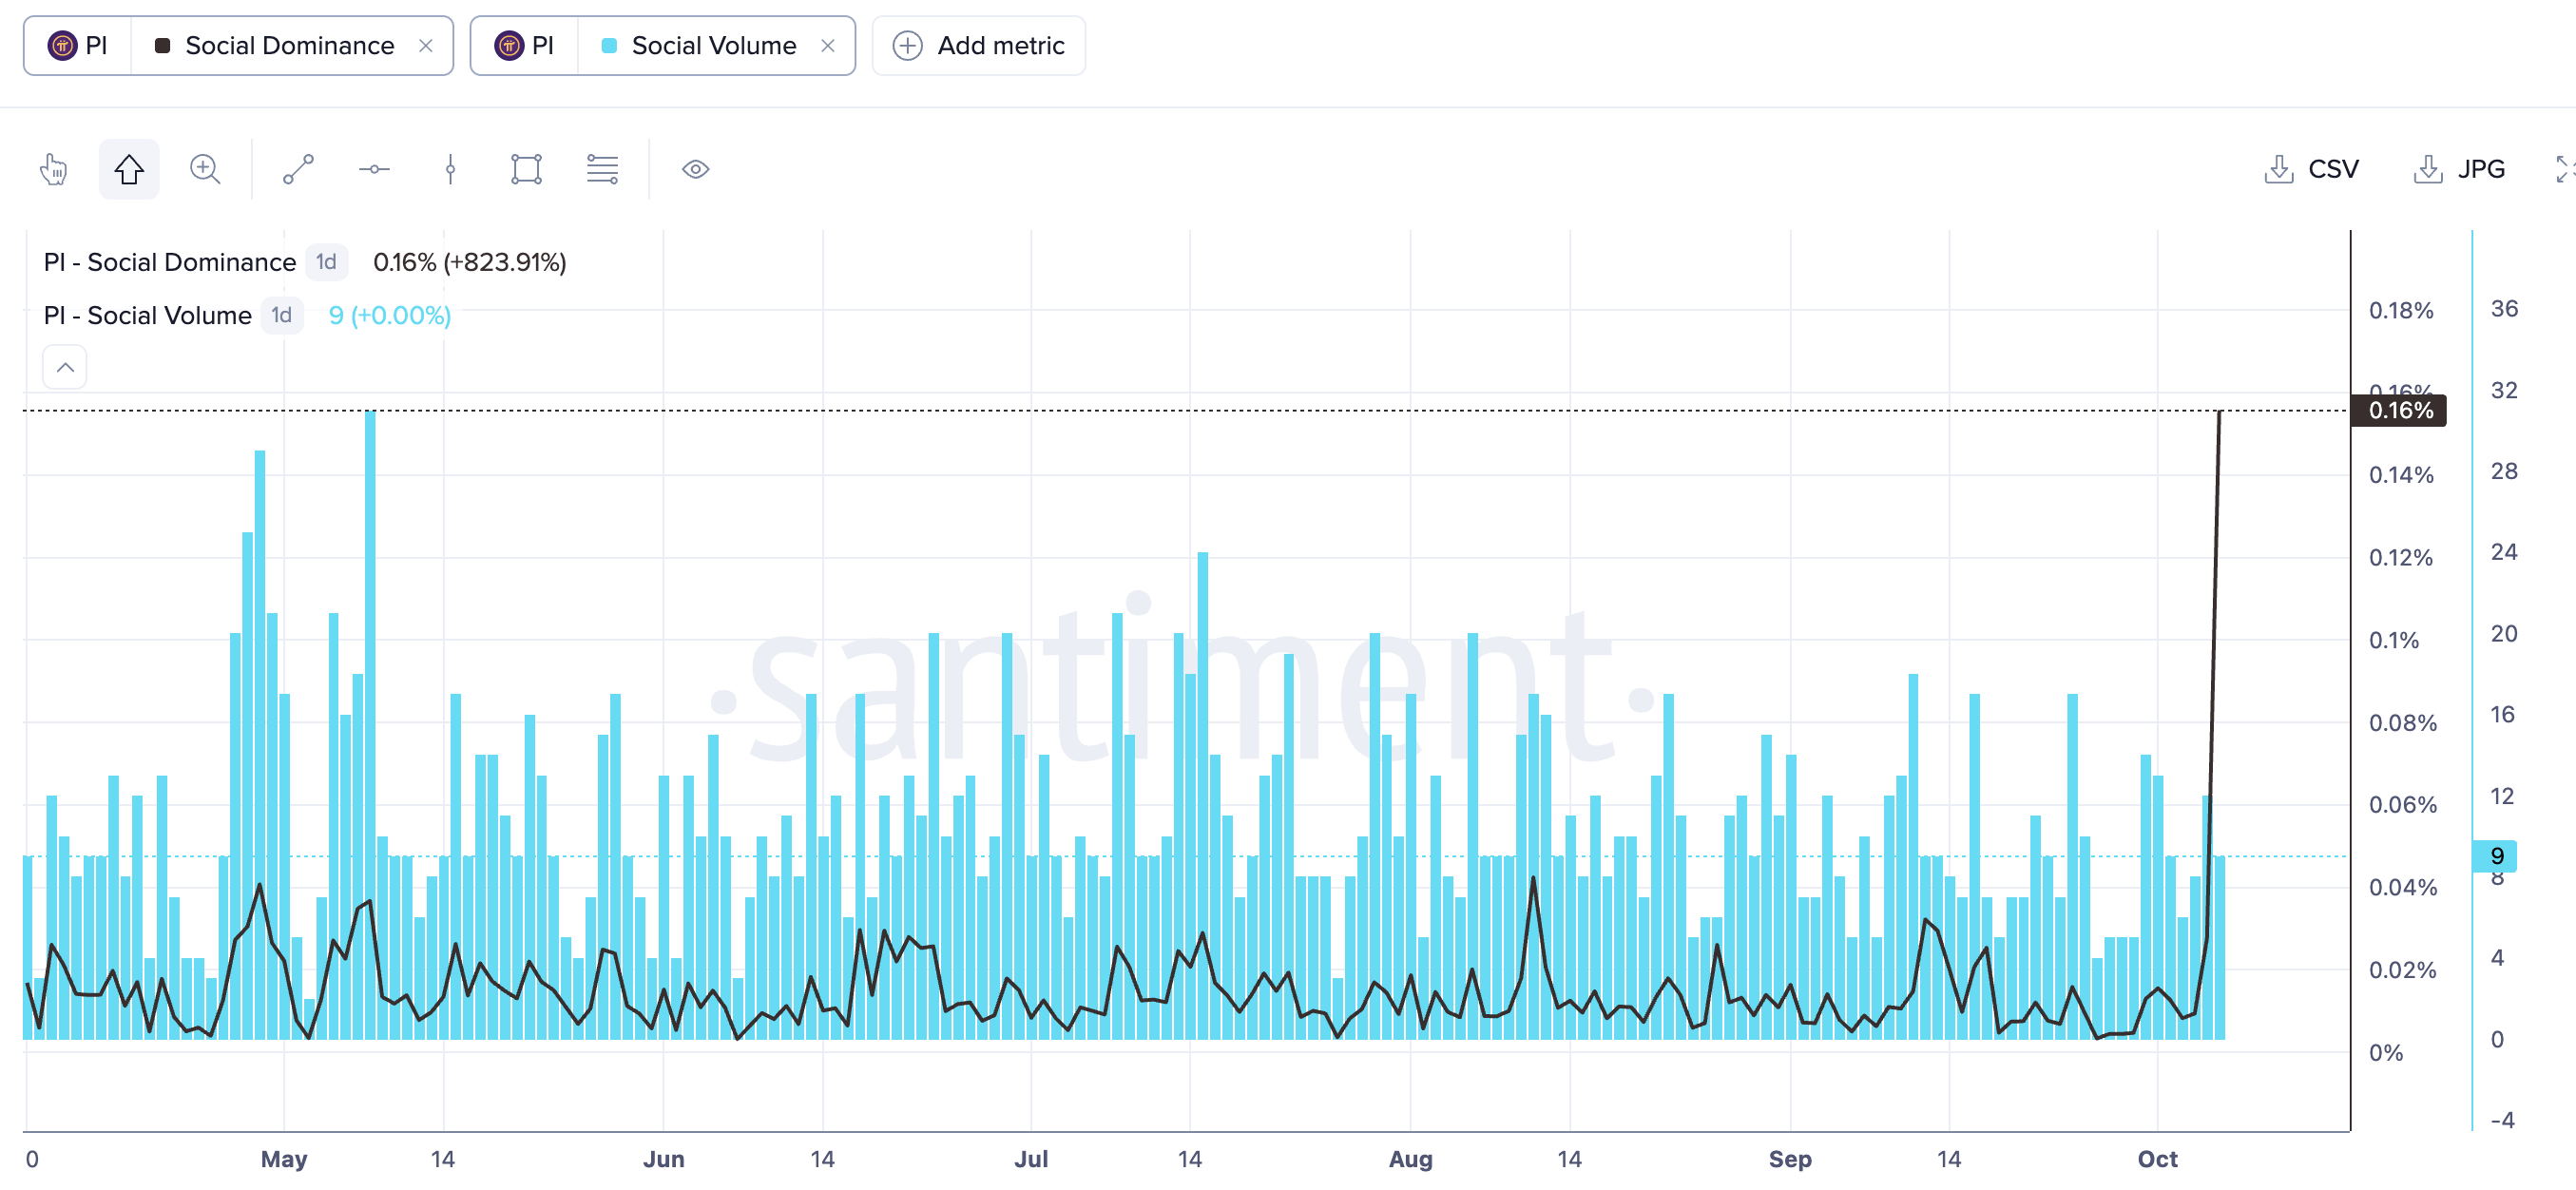
PI social interest data. Source: Santiment

Technical outlook: Pi Network holds at the last line of defense

Pi Network trades around $0.0830 at press time on Wednesday, maintaining a firm bearish bias. PI token holds extends a steady decline below the 50-day Exponential MOving Average (EMA) around $0.09061, which capped gains last week. Meanwhile, 100- and 200-day EMAs at $0.09890, and $0.1250, respectively, are well above the spot price, reaffirming a long-term downtrend.

The Moving Average Convergence Divergence (MACD) crosses below zero and signal line, while the Relative Strength Index (RSI) at 37 hovers just above oversold territory, hinting at persistent downside pressure.

The immediate support cluster of the 23.6% Fibonacci level at $0.08271, measured from $0.1341 to $0.0704, and the July 31 low at $0.0801 acts as the last line of defense. A confirmed breakout below this support zone could extend the decline towards the $0.0704 swing low, which could ignite dip buying interest.

Chart Analysis PI/USD (baha Crypto)
PI/USD daily price chart.

On the topside, initial resistance aligns at the 50-period EMA at $0.0906, followed by the 100-period EMA at $0.09890 near the 50% retracement level at $0.0990.

(The technical analysis of this story was written with the help of an AI tool. Know more.)

Isenção de responsabilidade: Apenas para fins informativos. O desempenho passado não é indicativo de resultados futuros.
placeholder
Eleições de meio de mandato nos EUA se aproximam: veja por que elas podem impactar as ações americanasTradingKey - As eleições de meio de mandato de 2026 nos EUA serão realizadas em 3 de novembro, com todas as cadeiras da Câmara dos Representantes e uma parcela do Senado em disputa. Segundo dados do a
Autor  TradingKey
10 horas atrás
TradingKey - As eleições de meio de mandato de 2026 nos EUA serão realizadas em 3 de novembro, com todas as cadeiras da Câmara dos Representantes e uma parcela do Senado em disputa. Segundo dados do a
placeholder
Japanese Yen drifts lower as sustained USD buying offsets intervention fearsThe USD/JPY pair attracts some buyers following the previous day's two-day price moves, trading above the 158.00 mark during the early part of the European session on Tuesday.
Autor  FXStreet
Ontem 08: 03
The USD/JPY pair attracts some buyers following the previous day's two-day price moves, trading above the 158.00 mark during the early part of the European session on Tuesday.
placeholder
Gold holds steady below $4,150 amid elevated US yields Gold price (XAU/USD) trades on a flat note near $4,140 during the early Asian session on Tuesday. Pressure from a stronger US Dollar (USD) and elevated US Treasury yields was offset by reduced expectations of a Federal Reserve (Fed) rate hike this month.
Autor  FXStreet
Ontem 02: 24
Gold price (XAU/USD) trades on a flat note near $4,140 during the early Asian session on Tuesday. Pressure from a stronger US Dollar (USD) and elevated US Treasury yields was offset by reduced expectations of a Federal Reserve (Fed) rate hike this month.
placeholder
Ações de Cibersegurança em IA Ganham Foco do Mercado: Qual Vale Mais a Pena Acompanhar, CrowdStrike ou Palo Alto?TradingKey - Anteriormente, os investidores estavam preocupados que a inteligência artificial pudesse disromper os modelos de negócios de software tradicionais, enfraquecendo os fossos competitivos e
Autor  TradingKey
10 Mês 05 Dia Seg
TradingKey - Anteriormente, os investidores estavam preocupados que a inteligência artificial pudesse disromper os modelos de negócios de software tradicionais, enfraquecendo os fossos competitivos e
placeholder
Preços do ouro retomam impulso de alta, prestes a voltar ao mercado de alta: quais ações de ouro valem a pena acompanhar?TradingKey - Em agosto, os preços do ouro (XAUUSD) continuaram a se recuperar de perto de US$ 4.000 e chegaram a se aproximar de US$ 4.700. Com o rompimento do nível chave de resistência de US$ 4.500,
Autor  TradingKey
10 Mês 05 Dia Seg
TradingKey - Em agosto, os preços do ouro (XAUUSD) continuaram a se recuperar de perto de US$ 4.000 e chegaram a se aproximar de US$ 4.700. Com o rompimento do nível chave de resistência de US$ 4.500,
goTop
quote