


Top 3 Price Prediction: Bitcoin, Ethereum, Ripple – BTC, ETH, XRP pause near recent highs as bullish momentum moderates
- Bitcoin consolidates near $83,369 on Wednesday, as bulls fail to close above the key $85,000 level earlier this week.
- Ethereum hovers at $2,674 as bulls show signs of exhaustion.
- XRP pauses its rally and consolidates around $1.500 as traders assess its move.
Bitcoin (BTC), Ethereum (ETH), and Ripple (XRP) are showing signs of slowing bullish momentum mid-week after slight pullbacks from their recent highs. BTC faces resistance near $85,000, with ETH hovering around $2,674 and XRP holding near $1.500, as traders assess whether these top three cryptocurrencies can resume their recent rallies.
Bitcoin faces rejection from $85,000 mark
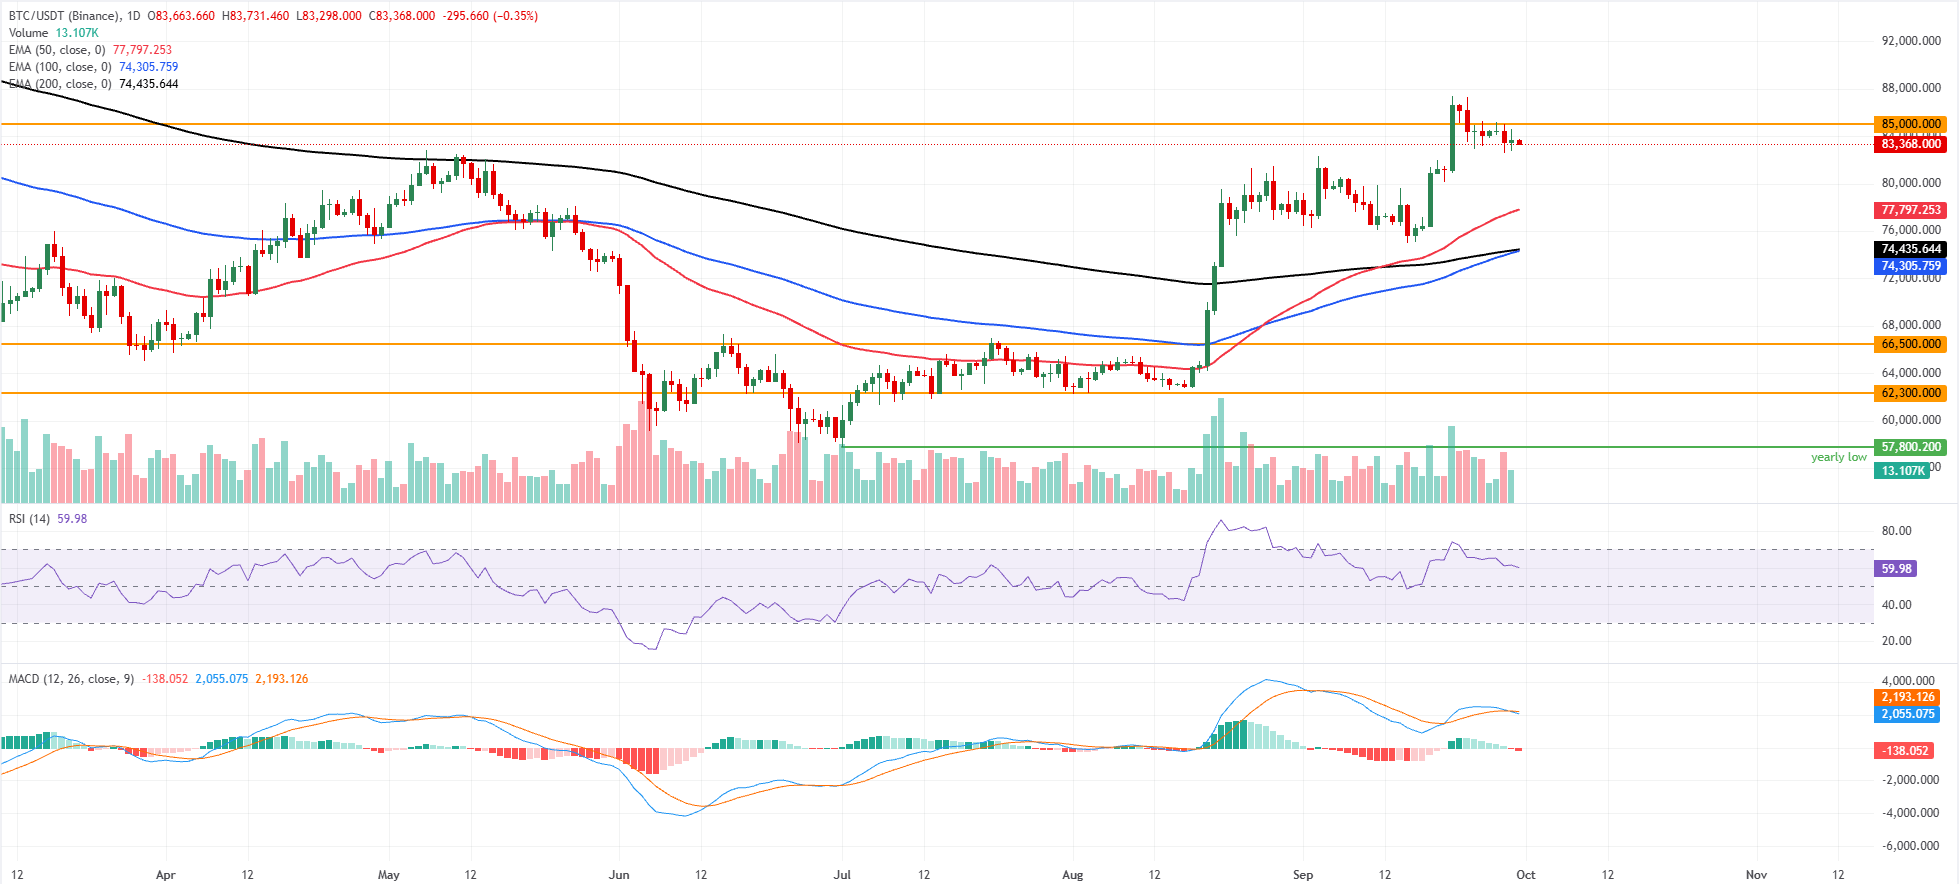
Bitcoin price trades at $83,368 on Wednesday after failing to close above key resistance near $85,000 earlier this week. Despite this pullback, BTC holds above the 50-day, 100-day and 200-day Exponential Moving Averages (EMAs), which collectively reinforce a bullish near-term bias.
The Relative Strength Index (RSI) near 59 suggests constructive but not overextended momentum. At the same time, the Moving Average Convergence Divergence (MACD) indicator remains slightly negative, hinting that upside pressure is moderating rather than reversing at this stage.
On the topside, immediate resistance emerges at the horizontal barrier around $85,000, where a break higher would open the way for another leg toward fresh highs.
On the downside, initial support sits near the 50-day EMA at $77,797, followed by a broader demand band defined by the 100-day and 200-day EMAs clustered around $74,300–$74,400, with deeper support at $66,500 and $62,300 in a more pronounced pullback.
Ethereum bulls show signs of exhaustion
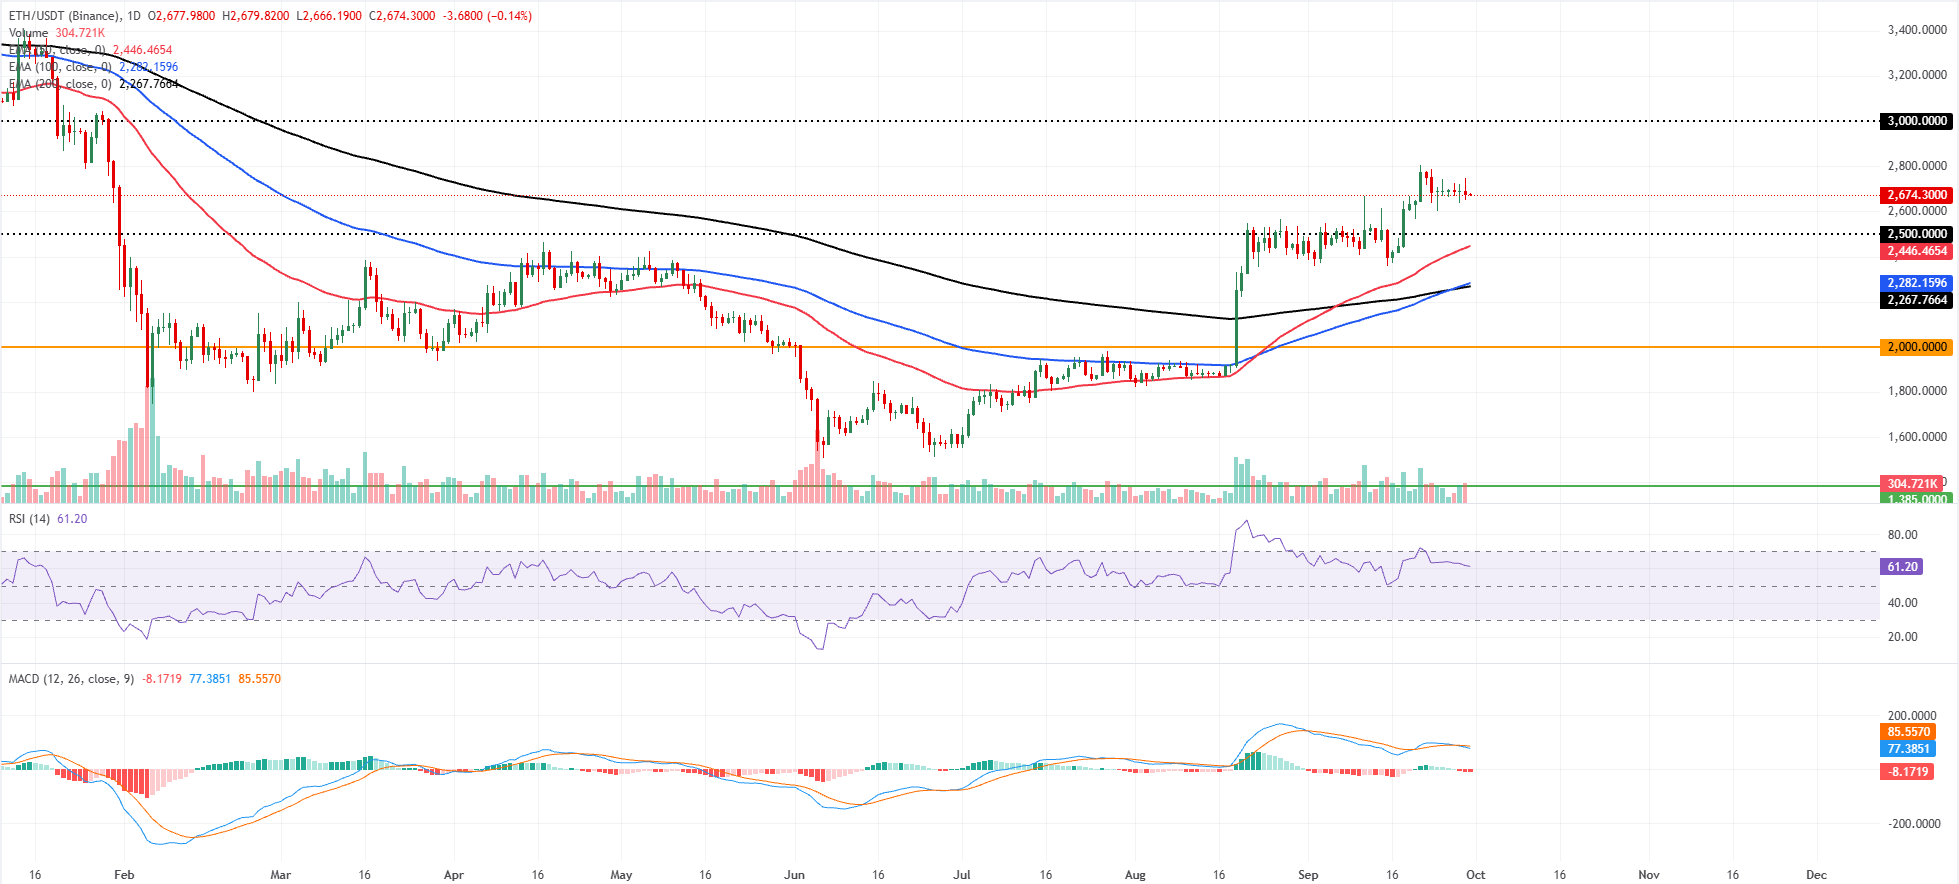
Ethereum price trades at $2,674 on Wednesday, consolidating near recent highs as bulls show signs of exhaustion. Despite pauses in its rally, ETH holds a constructive bias as it remains well above the 50-day, 100-day and 200-day EMAs at $2,446, $2,282 and $2,267, respectively.
The cluster of underlying EMAs and the horizontal level at $2,500 reinforce a supportive backdrop. At the same time, the RSI around 61 suggests steady, but not overextended, upside momentum even as the MACD indicator slips further below zero, hinting at a mild loss of short-term upside conviction rather than a full-fledged reversal.
On the downside, immediate support is seen at the $2,500 horizontal line, followed closely by the 50-day EMA at $2,446, with the 100-day and 200-day EMAs at $2,282 and $2,267 providing a deeper demand band ahead of the more distant $2,000 and $1,385 structural floors.
On the topside, the next relevant resistance is the psychological $3,000 barrier, and a decisive daily close above it would likely open the way for an extension of the prevailing uptrend despite the currently cautious MACD signal.
XRP shows early signs of weakness
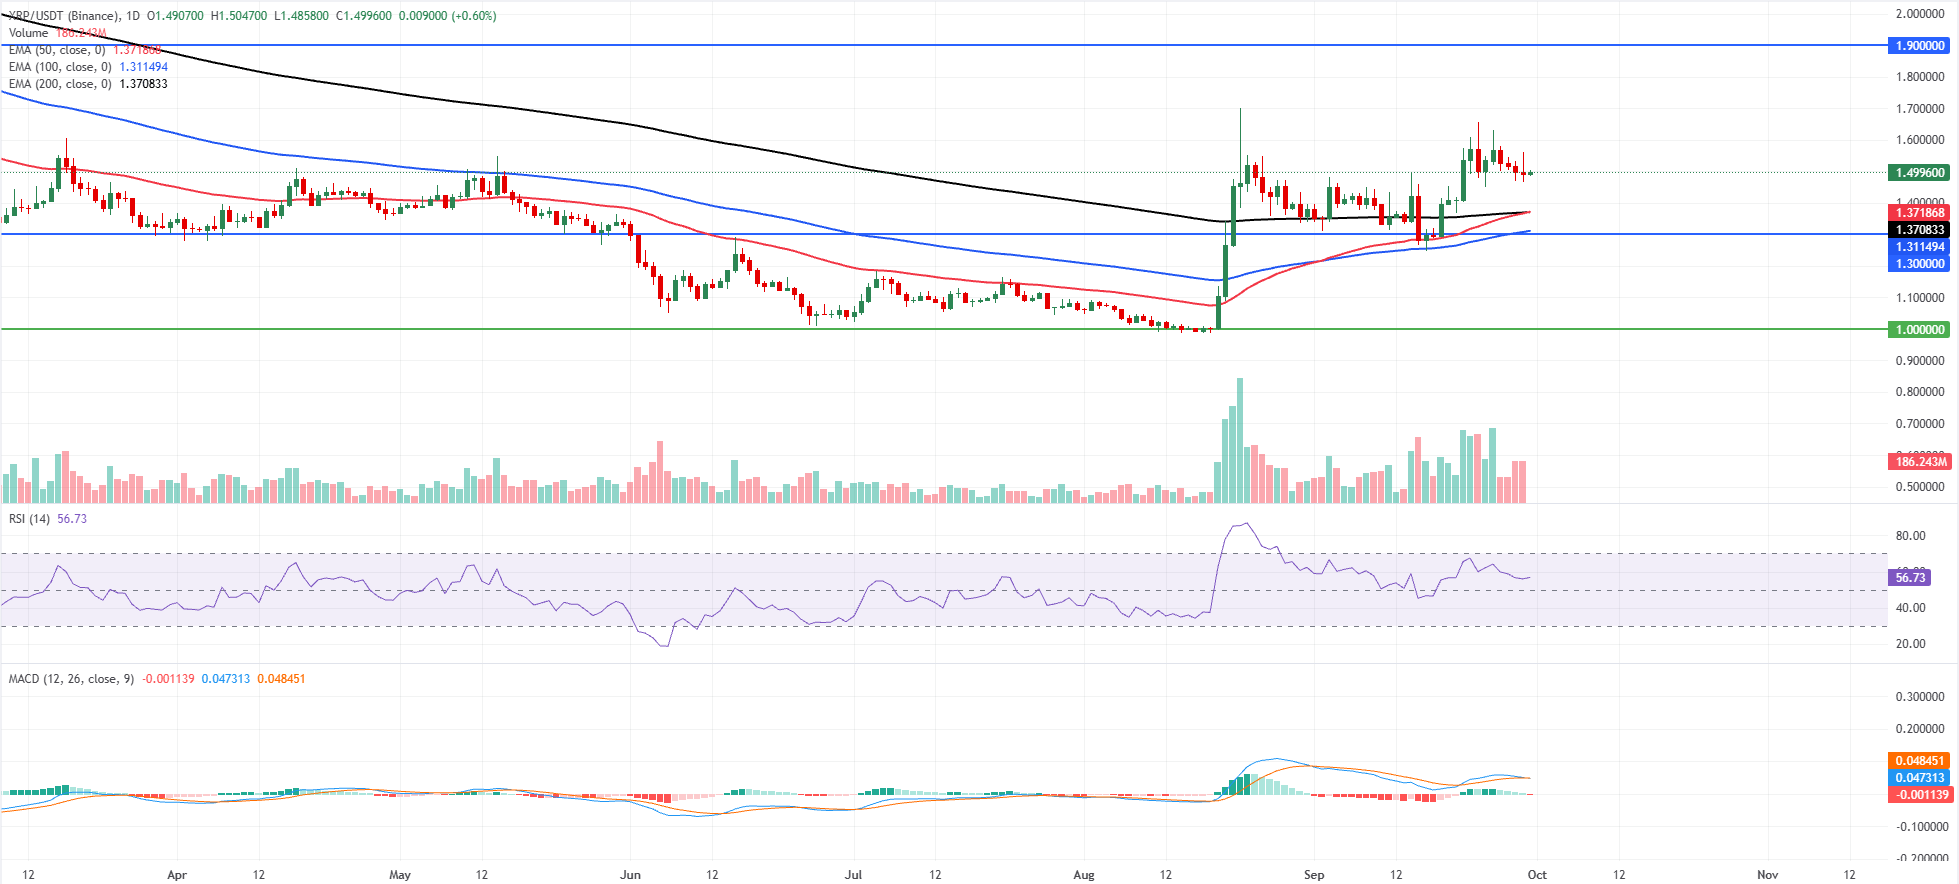
XRP price trades at $1.499 on Wednesday after four consecutive days of losses since last week. Despite this correction, XRP maintains a constructive outlook, holding well above the 50-day and 200-day EMAs at $1.371 and $1.370, as well as the 100-day EMA at $1.311.
The RSI at 56 stays in positive territory without reaching overbought levels. At the same time, the MACD flattens just below the zero line, suggesting that bullish momentum is moderating but the broader upside structure remains intact.
On the downside, initial support is seen at the clustered 50-day and 200-day EMAs around $1.370, followed by the 100-day EMA at $1.311 and the horizontal level at $1.300, before a deeper floor emerges near $1.000.
On the topside, the next key hurdle is the horizontal resistance at $1.900, and a sustained break above this barrier would open the path for a continuation of the prevailing uptrend.
(The technical analysis of this story was written with the help of an AI tool. Know more.)
Cryptocurrency metrics FAQs
The developer or creator of each cryptocurrency decides on the total number of tokens that can be minted or issued. Only a certain number of these assets can be minted by mining, staking or other mechanisms. This is defined by the algorithm of the underlying blockchain technology. On the other hand, circulating supply can also be decreased via actions such as burning tokens, or mistakenly sending assets to addresses of other incompatible blockchains.
Market capitalization is the result of multiplying the circulating supply of a certain asset by the asset’s current market value.
Trading volume refers to the total number of tokens for a specific asset that has been transacted or exchanged between buyers and sellers within set trading hours, for example, 24 hours. It is used to gauge market sentiment, this metric combines all volumes on centralized exchanges and decentralized exchanges. Increasing trading volume often denotes the demand for a certain asset as more people are buying and selling the cryptocurrency.
Funding rates are a concept designed to encourage traders to take positions and ensure perpetual contract prices match spot markets. It defines a mechanism by exchanges to ensure that future prices and index prices periodic payments regularly converge. When the funding rate is positive, the price of the perpetual contract is higher than the mark price. This means traders who are bullish and have opened long positions pay traders who are in short positions. On the other hand, a negative funding rate means perpetual prices are below the mark price, and hence traders with short positions pay traders who have opened long positions.
Artigos Recomendados


