

Dogecoin Forecast: DOGE risks falling toward four-year floor price

Fonte Fxstreet
  • Dogecoin trades 55% below yearly highs on Friday amid a sustained downtrend, targeting 2022 lows at $0.050.
  • The meme coin’s perpetual futures Open Interest rises to 16 billion DOGE but fails to lift Dogecoin’s outlook.
  • Declining major moving averages align with weak momentum indicators to cap Dogecoin’s recovery potential.

Dogecoin (DOGE) continues to slide below the $0.0700 mark, in step with the broader market’s prevailing bearish sentiment. Trading approximately 55% beneath its yearly peak of $1.5666, DOGE faces mounting downside pressure, increasing the risk of a retest of the four-year low at $0.0500 set in June 2022.

Dogecoin falters amid modest retail activity

Dogecoin derivatives sustain a gradual increase in perpetual futures Open Interest (OI), which is approaching 16 billion DOGE on Friday, up from 15.4 billion DOGE the previous day. Looking back, the meme coin attracted 13.6 billion DOGE in OI on July 1, underscoring medium-term positive investor interest in the meme coin.
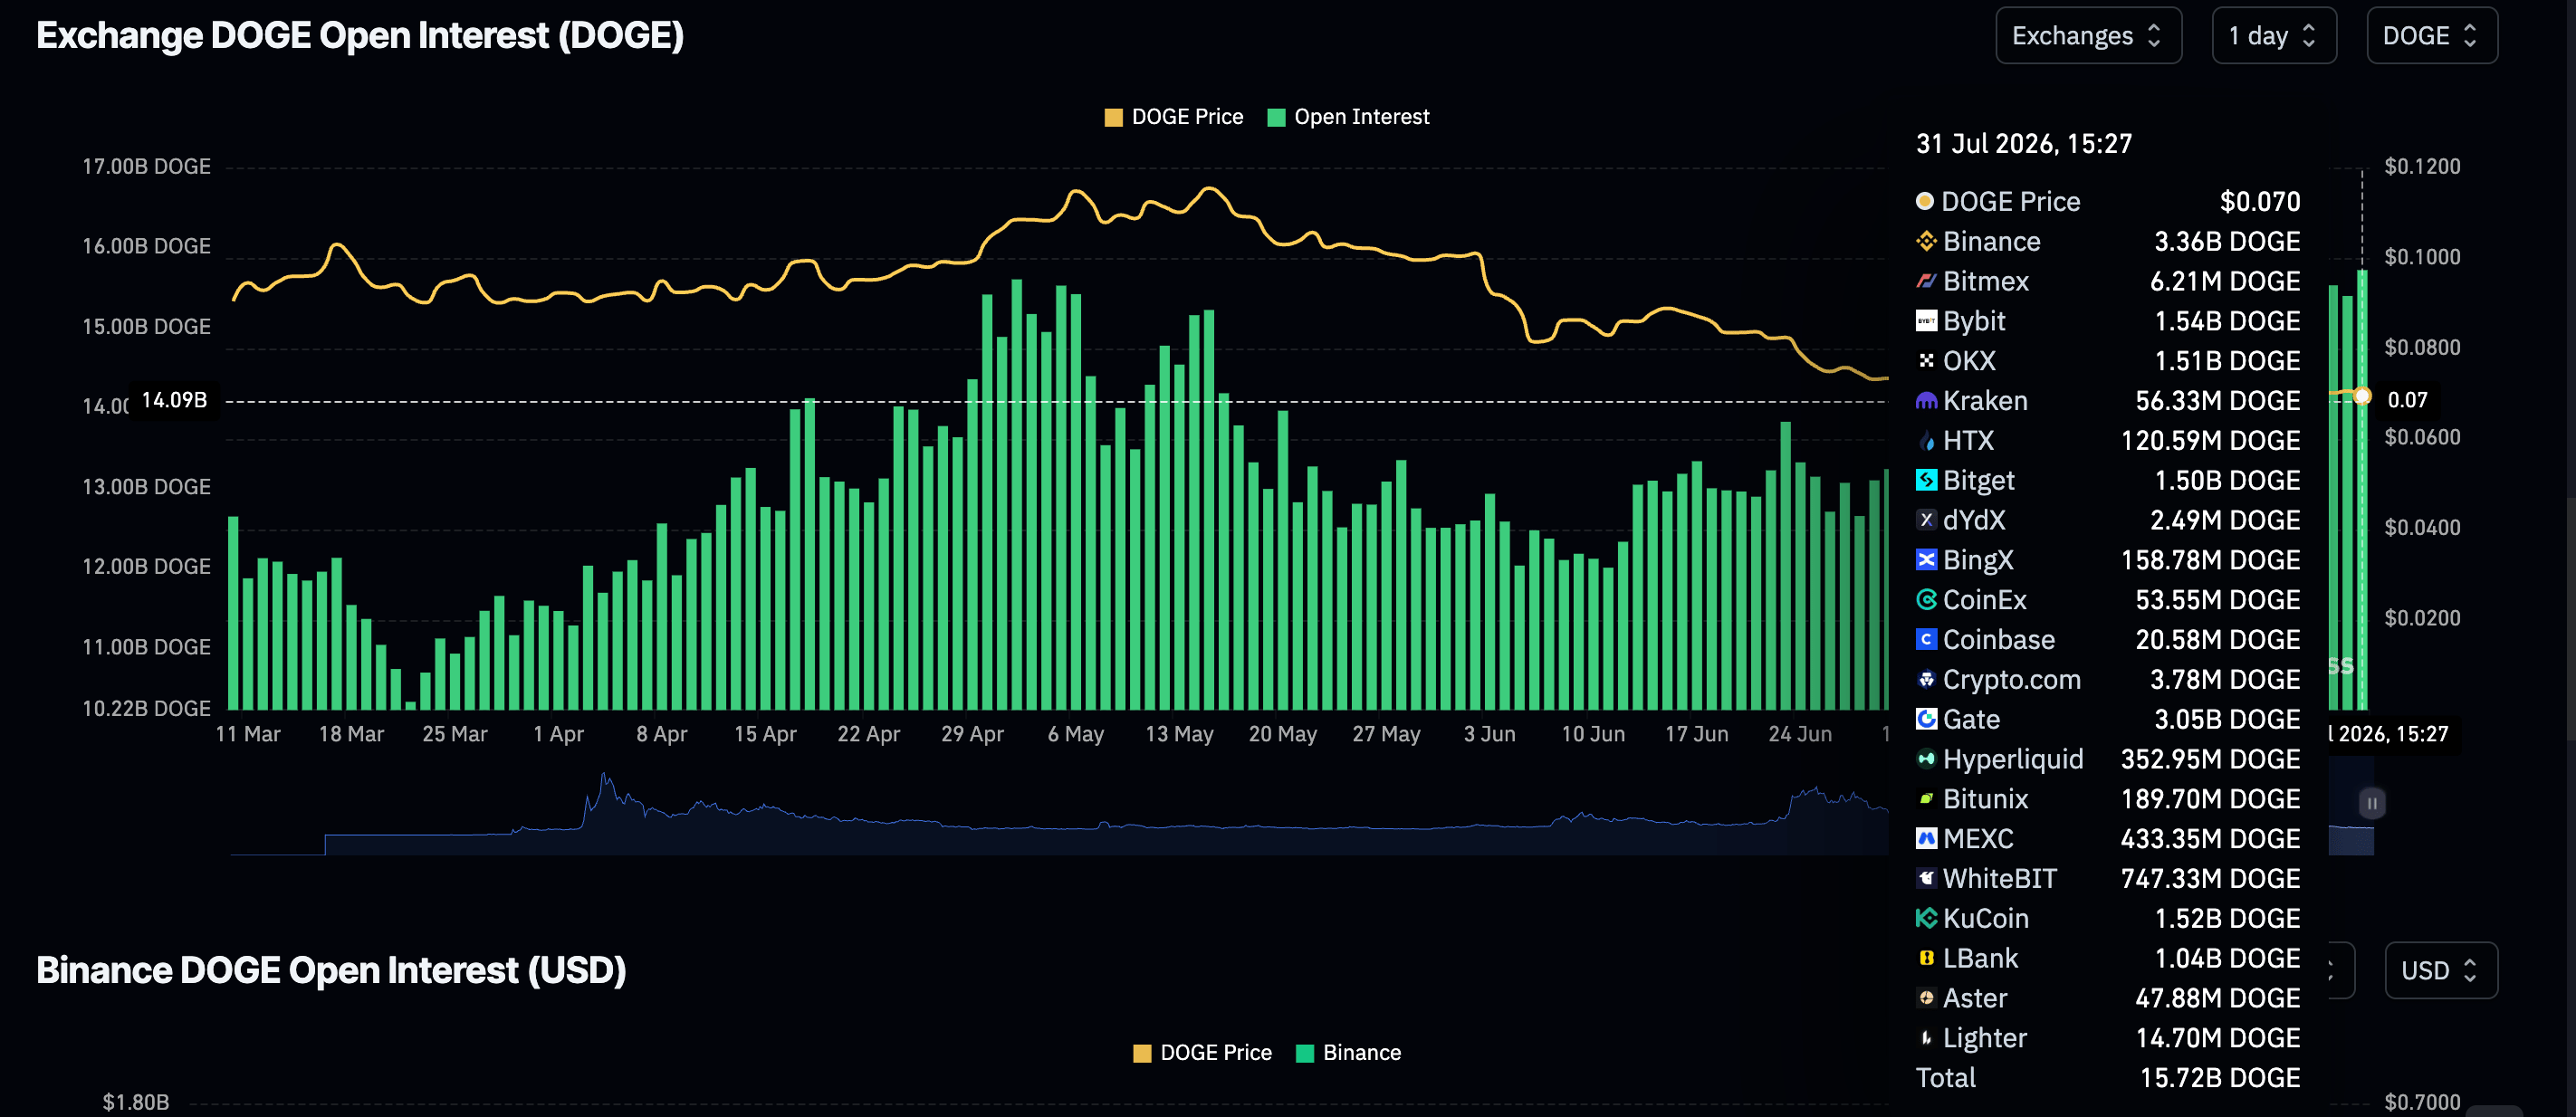
Dogecoin Futures OI | Source: CoinGlass

Despite rising OI, Dogecoin’s outlook has remained lethargic, with the path of least resistance remaining primarily downward. However, risk-off sentiment prevailed in the broader crypto market, as reflected in the Fear & Greed Index. After a brief rally above 30 earlier in the month, the market sentiment index is at 25 in the Extreme Fear territory on Friday, down from 28 the day before. This outlook suggests that bears still have teeth that could stretch the sell-off toward the critical $0.0500 level.
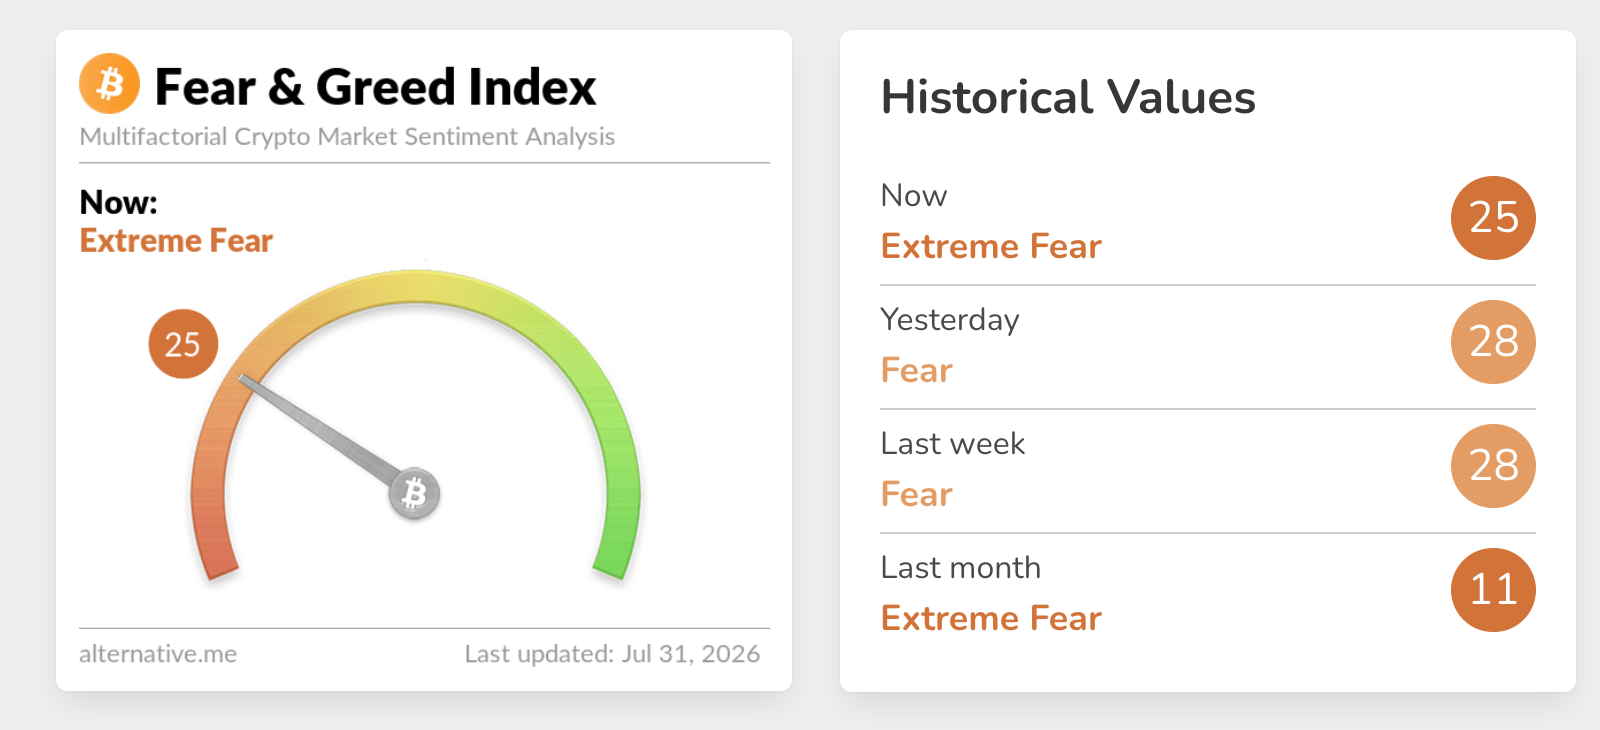
Crypto Fear & Greed Index | Source

Dogecoin bears retail control

Dogecoin trades at $0.0696, extending a bearish near-term bias as price holds well below the 50-week, 100-week and 200-week Exponential Moving Averages (EMAs). The cluster of long-term EMAs above the market suggests rallies remain corrective within a broader downtrend.

Meanwhile, the Moving Average Convergence Divergence (MACD) indicator hovers just above the zero line with a flat tone, hinting at weak underlying downside momentum. The Relative Strength Index (RSI) at roughly 33 leans toward oversold territory, but its failure to rebound meaningfully so far reinforces the view that sellers retain control.

DOGE/USDT weekly chart

Initial resistance aligns with the downtrend resistance line around $0.1120, with the 50-week EMA near $0.1214 forming the next cap. Higher up, the 200-week EMA at about $0.1391 and the 100-week EMA just above $0.1422 create a dense supply zone that would need to be overcome to ease the broader bearish structure. With no clear structural supports immediately below current levels on the daily timeframe, any further decline could see DOGE test psychological levels at $0.0600 and the 2022 floor price at $0.0500.

(The technical analysis of this story was written with the help of an AI tool. Know more.)

Open Interest, funding rate FAQs

Higher Open Interest is associated with higher liquidity and new capital inflow to the market. This is considered the equivalent of increase in efficiency and the ongoing trend continues. When Open Interest decreases, it is considered a sign of liquidation in the market, investors are leaving and the overall demand for an asset is on a decline, fueling a bearish sentiment among investors.

Funding fees bridge the difference between spot prices and prices of futures contracts of an asset by increasing liquidation risks faced by traders. A consistently high and positive funding rate implies there is a bullish sentiment among market participants and there is an expectation of a price hike. A consistently negative funding rate for an asset implies a bearish sentiment, indicating that traders expect the cryptocurrency’s price to fall and a bearish trend reversal is likely to occur.

Isenção de responsabilidade: Apenas para fins informativos. O desempenho passado não é indicativo de resultados futuros.
placeholder
Trump compra ações da Berkshire Hathaway pela primeira vez, no meio de mais de mil transações num mêsDonald Trump comprou ações da Berkshire Hathaway (NYSE: BRK.B) pela primeira vez em junho, realizando 1.051 transações financeiras distintas envolvendo ações, obrigações e fundos negociados em bolsa, de acordo com o último relatório financeiro de Trump, divulgado a 22 de agosto. Os valores das transações variaram entre 78,1 milhões de dólares e 263,1 milhões de dólares, conforme previsto pela lei de transparência que exige a divulgação destas transações...
Autor  Cryptopolitan
Ontem 01: 44
Donald Trump comprou ações da Berkshire Hathaway (NYSE: BRK.B) pela primeira vez em junho, realizando 1.051 transações financeiras distintas envolvendo ações, obrigações e fundos negociados em bolsa, de acordo com o último relatório financeiro de Trump, divulgado a 22 de agosto. Os valores das transações variaram entre 78,1 milhões de dólares e 263,1 milhões de dólares, conforme previsto pela lei de transparência que exige a divulgação destas transações...
placeholder
Ouro atinge máxima desde maio com queda nos juros e dólar fracoO ouro (XAU/USD) dá continuidade ao movimento de alta da semana passada acima da Média Móvel Simples (SMA) de 200 dias — um nível tecnicamente significativo — e ultrapassa os US$ 4.650 durante a sessão asiática nesta segunda-feira, atingindo uma nova máxima desde meados de maio.
Autor  FXStreet
Ontem 05: 53
O ouro (XAU/USD) dá continuidade ao movimento de alta da semana passada acima da Média Móvel Simples (SMA) de 200 dias — um nível tecnicamente significativo — e ultrapassa os US$ 4.650 durante a sessão asiática nesta segunda-feira, atingindo uma nova máxima desde meados de maio.
placeholder
O investimento de 10 mil milhões de dólares da Alibaba em IA acontece um dia antes do lançamento do Wan3.0A Alibaba lançou o Wan3.0, um modelo que transforma documentos, folhas de cálculo e diapositivos em vídeos de 30 segundos.
Autor  Cryptopolitan
13 horas atrás
A Alibaba lançou o Wan3.0, um modelo que transforma documentos, folhas de cálculo e diapositivos em vídeos de 30 segundos.
placeholder
Porque é que as ações da Nvidia estão a cair hoje?A Nvidia (NASDAQ:NVDA) teve uma forte oscilação na segunda-feira. As ações subiram cerca de 3% logo após a abertura da sessão, mas caíram aproximadamente 2% após a divulgação das notícias sobre o Groq. Antes, a Nvidia anunciou que o seu rack Groq 3 LPX já está a ser produzido em larga escala, transformando a tecnologia da maior aquisição da história da Nvidia em hardware pronto para o cliente.
Autor  Cryptopolitan
13 horas atrás
A Nvidia (NASDAQ:NVDA) teve uma forte oscilação na segunda-feira. As ações subiram cerca de 3% logo após a abertura da sessão, mas caíram aproximadamente 2% após a divulgação das notícias sobre o Groq. Antes, a Nvidia anunciou que o seu rack Groq 3 LPX já está a ser produzido em larga escala, transformando a tecnologia da maior aquisição da história da Nvidia em hardware pronto para o cliente.
placeholder
Ouro recua de máximas desde maio e perde força antes de US$ 4.700 com riscos do Fed sustentando o dólarO ouro (XAU/USD) atingiu uma nova máxima desde 14 de maio durante a sessão asiática desta terça-feira, embora tenha tido dificuldades para dar continuidade ao movimento e não tenha conseguido superar a marca de US$ 4.700.
Autor  FXStreet
9 horas atrás
O ouro (XAU/USD) atingiu uma nova máxima desde 14 de maio durante a sessão asiática desta terça-feira, embora tenha tido dificuldades para dar continuidade ao movimento e não tenha conseguido superar a marca de US$ 4.700.
Produtos relacionados
goTop
quote