

Top Crypto Gainers: Decred, Zcash, and Dogecoin lead recovery as Bitcoin crosses $72,000
- Bitcoin hovers above $72,500 on Thursday, up 6% from the previous day, suggesting renewed upside pressure.
- The total cryptocurrency market is valued at $2.43 trillion after 5% surge on Wednesday, lifting the broader market sentiment.
- Decred, Zcash, and Dogecoin lead the broader market recovery, with gains of 7% to 13% over the last 24 hours.
Bitcoin trades above $72,500 at press time on Thursday, holding its 6% gain from the previous day, contributing to a broader market recovery. The total cryptocurrency market capitalization stands at over $2.43 trillion as the broader market sentiment improves significantly. Decred (DCR), Zcash (ZEC), and Dogecoin (DOGE) lead gains over the last 24 hours, as the broader market risk-on sentiment renews.
Bitcoin recovers above $72,000, lifting all boats
Bitcoin exited a long-standing consolidation range below $70,000, jumping 6% on Wednesday. At the time of writing, BTC is holding above $72,500 on Thursday as the 50-day Exponential Moving Average (EMA) capped gains on the previous day.
The declining trend of the 50-, 100-, and 200-day EMAs reaffirms a prevailing bearish bias and could cap extended recovery attempts. The Relative Strength Index (RSI) is at 55 on the daily chart, extending a steady rise above the midline as buying pressure increases. At the same time, the Moving Average Convergence Divergence (MACD) scales toward the zero line amid expanding positive histograms, confirming a bullish bias in trend momentum.
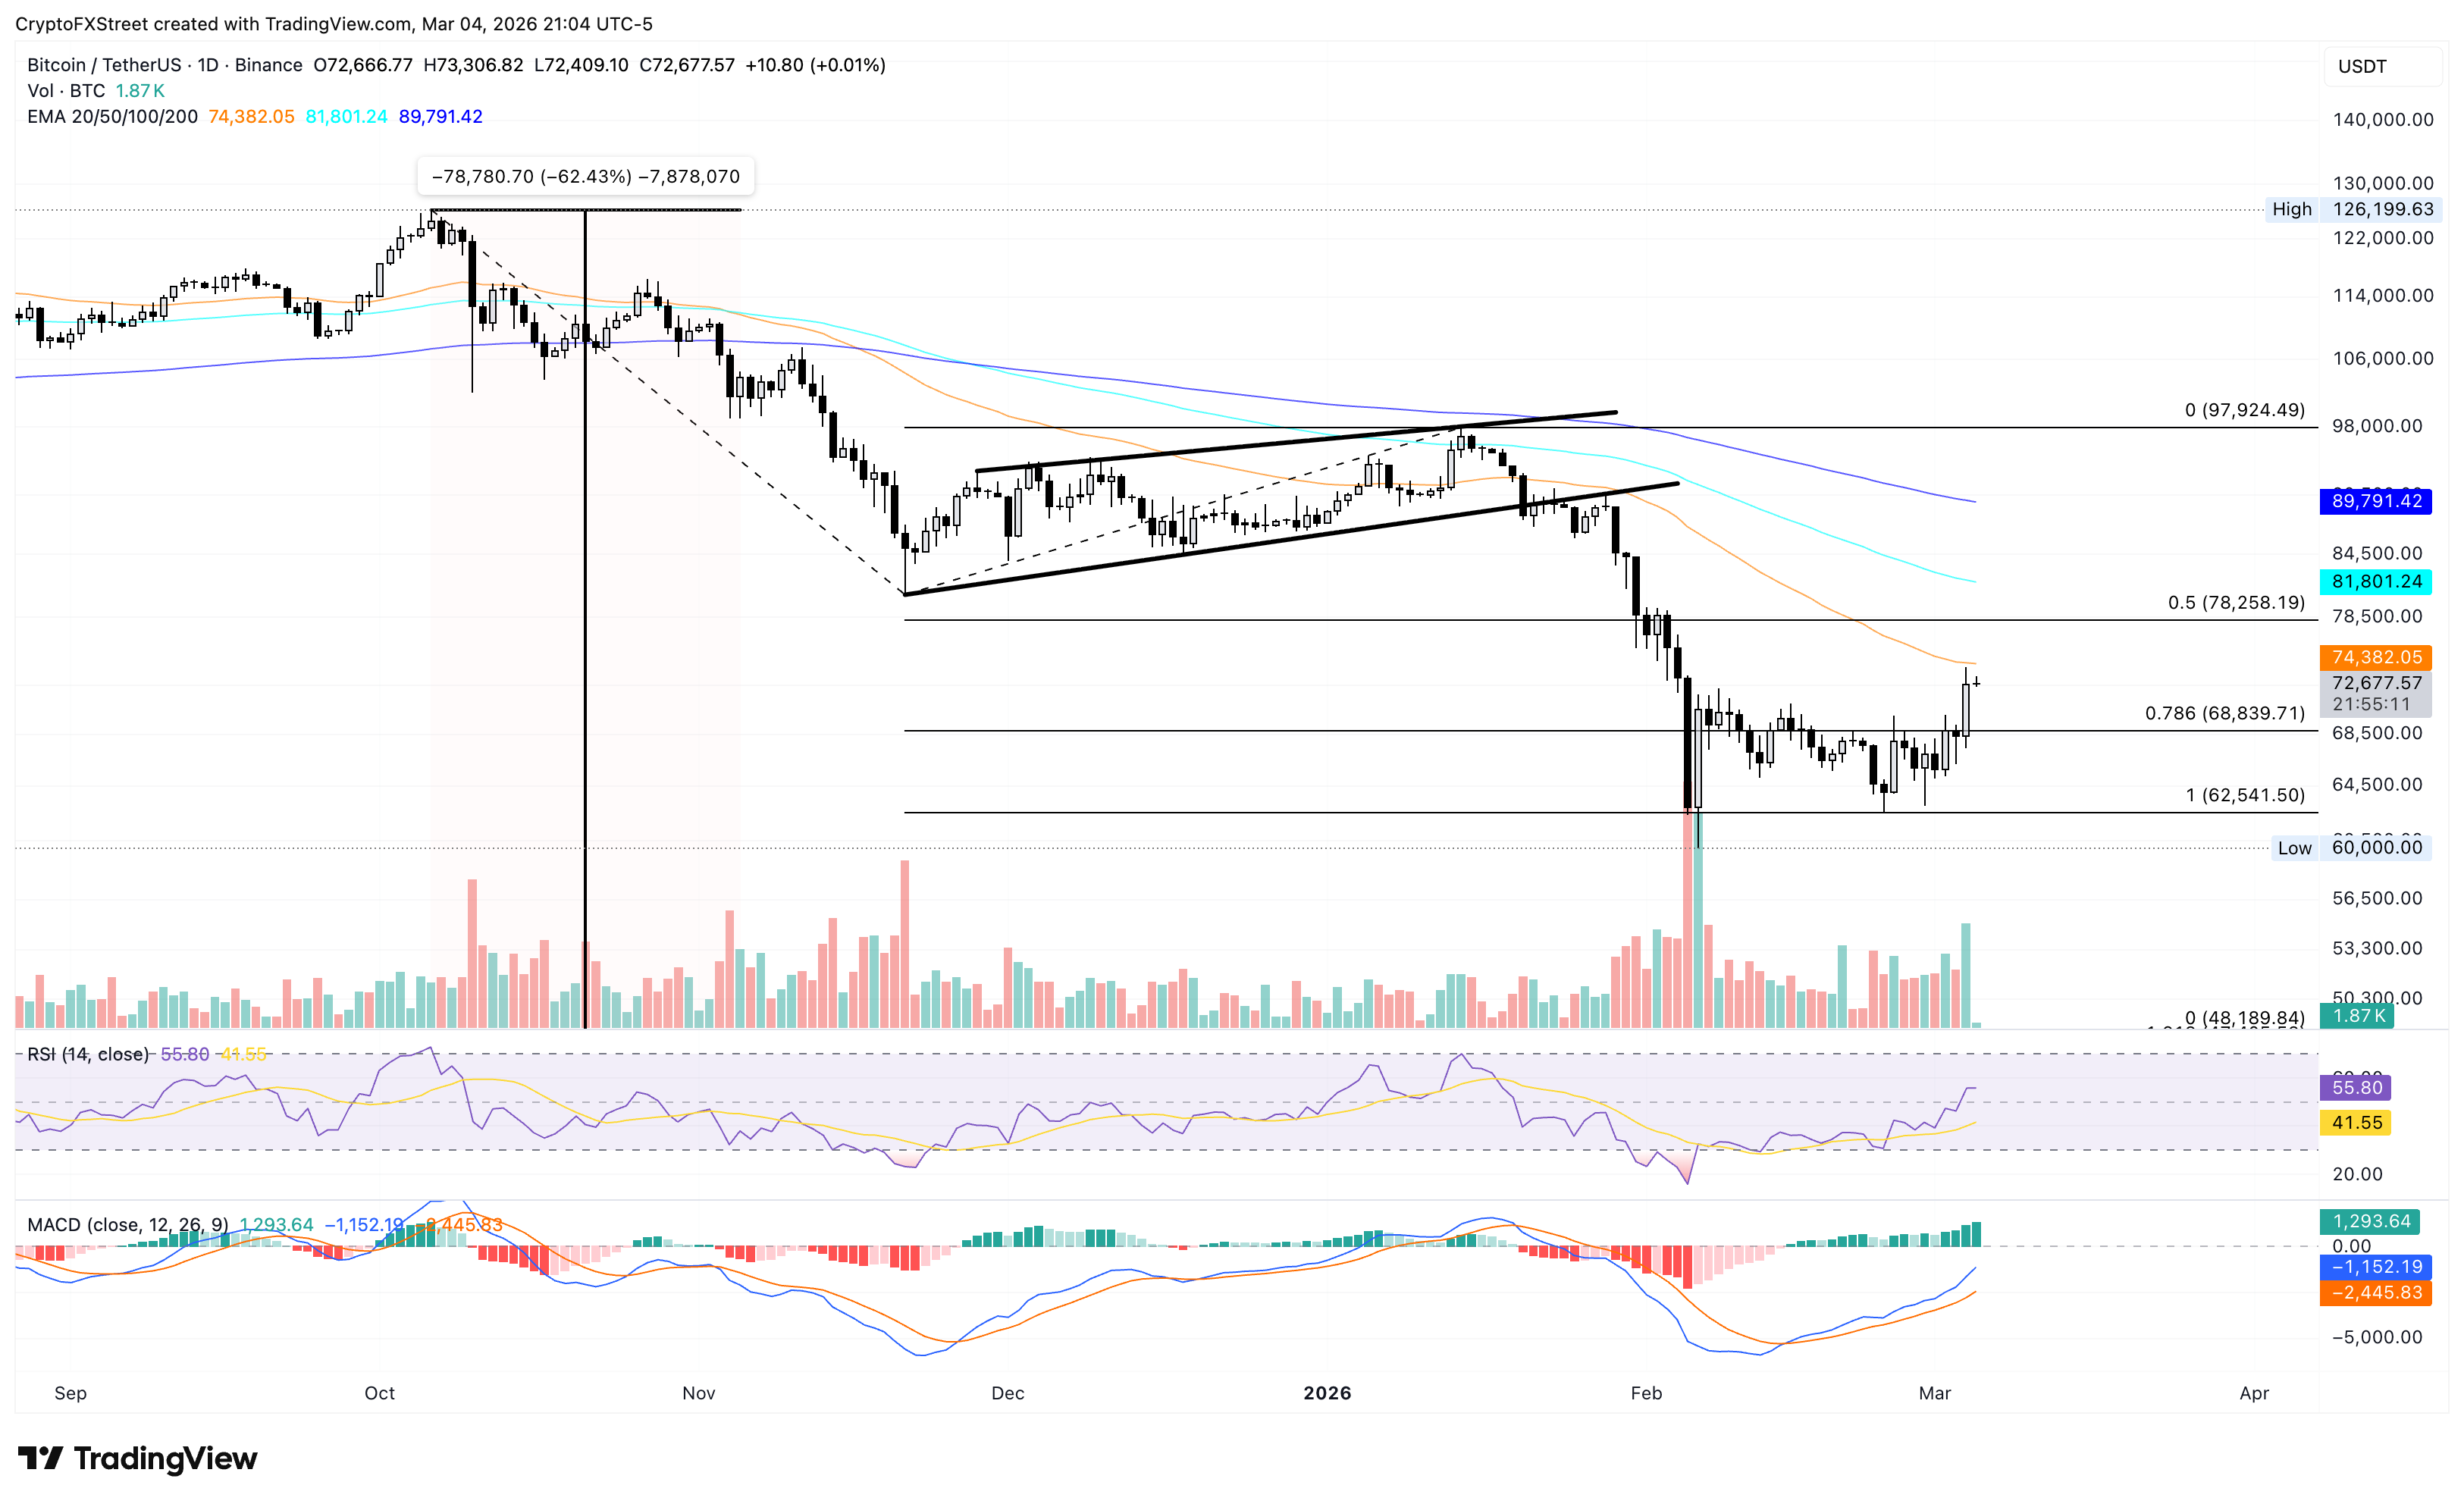
If BTC clears the 50-day EMA at $74,382, it could target the 50% trend-based Fibonacci retracement level at $78,258, measured from the October 6 high of $126,199 to the November 5 low of $80,600. A decisive close above this level could extend the recovery to the 100-day EMA at $81,801.
On the flip side, the breakout area near the 78.6% trend-based Fibonacci retracement level at $68,839 could serve as a support zone.
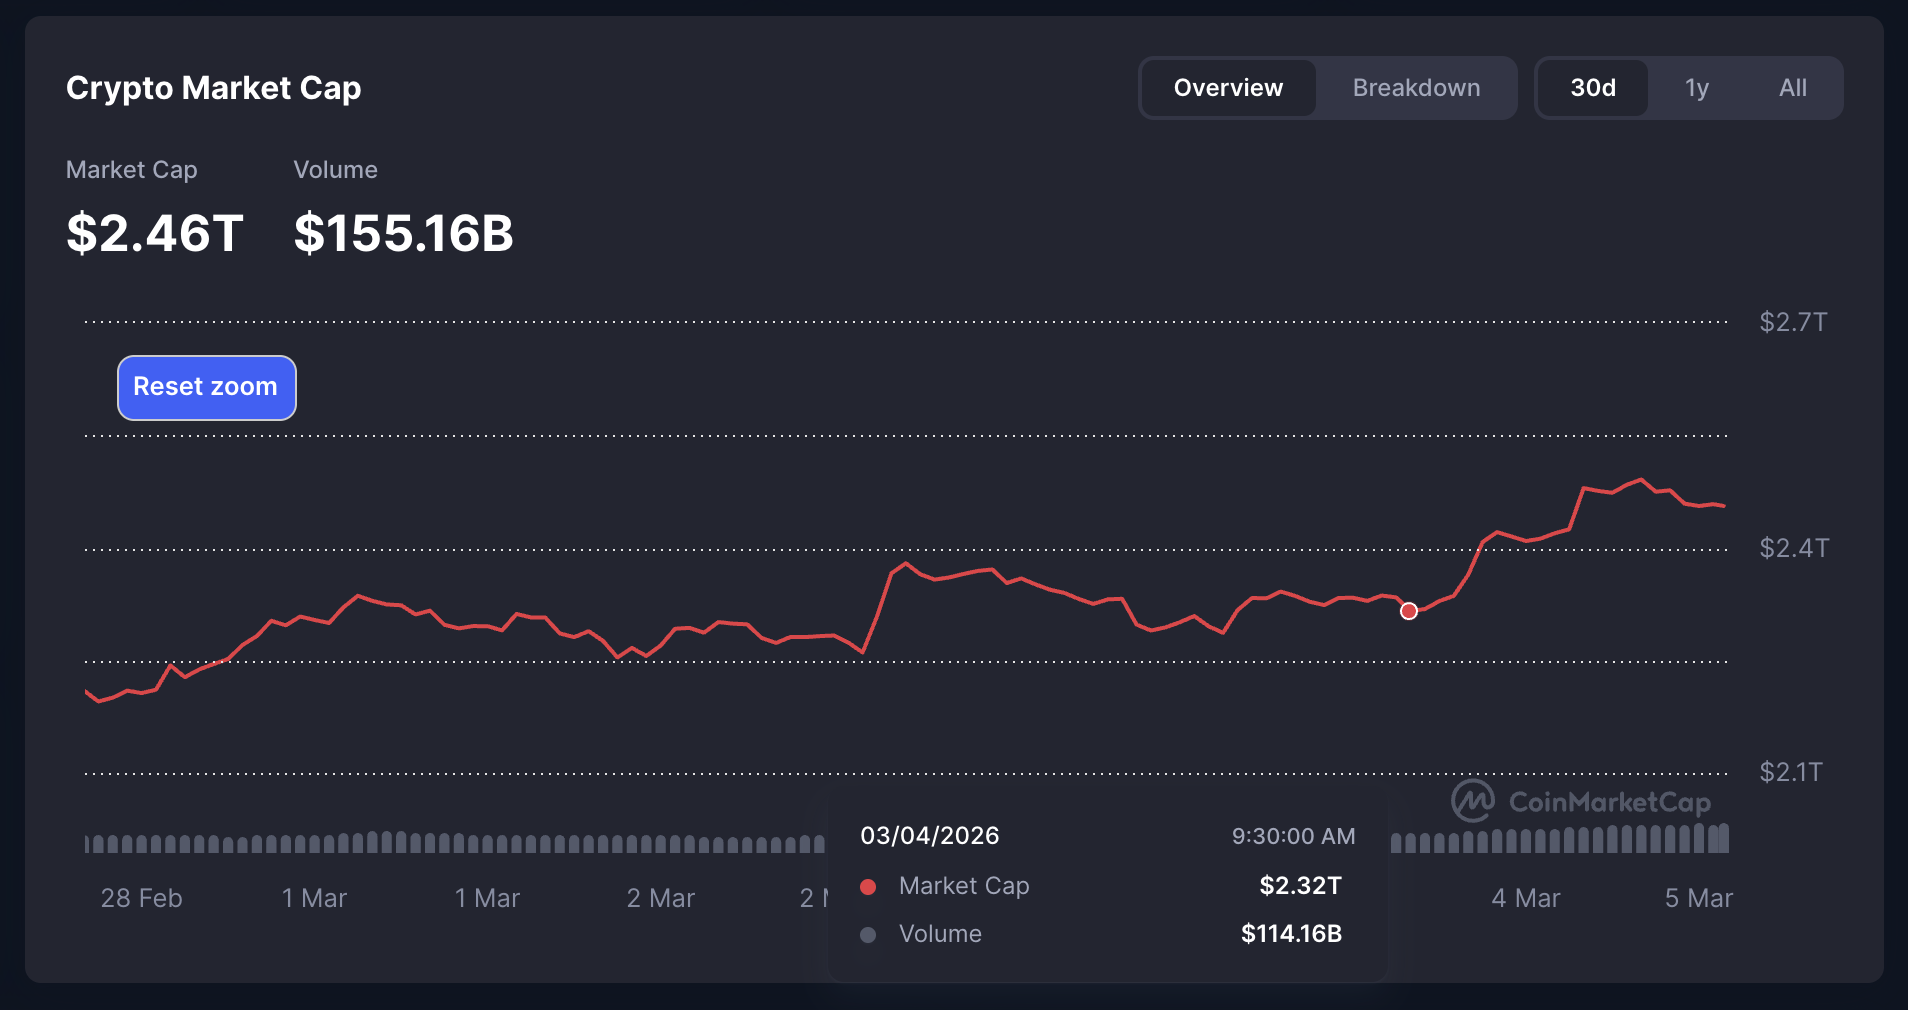
The rebound in Bitcoin drove a broader market recovery, resulting in renewed risk-off sentiment. At the time of writing, the total crypto market capitalization stands at $2.43 trillion on Thursday, up over 5% from $2.32 trillion the previous day.
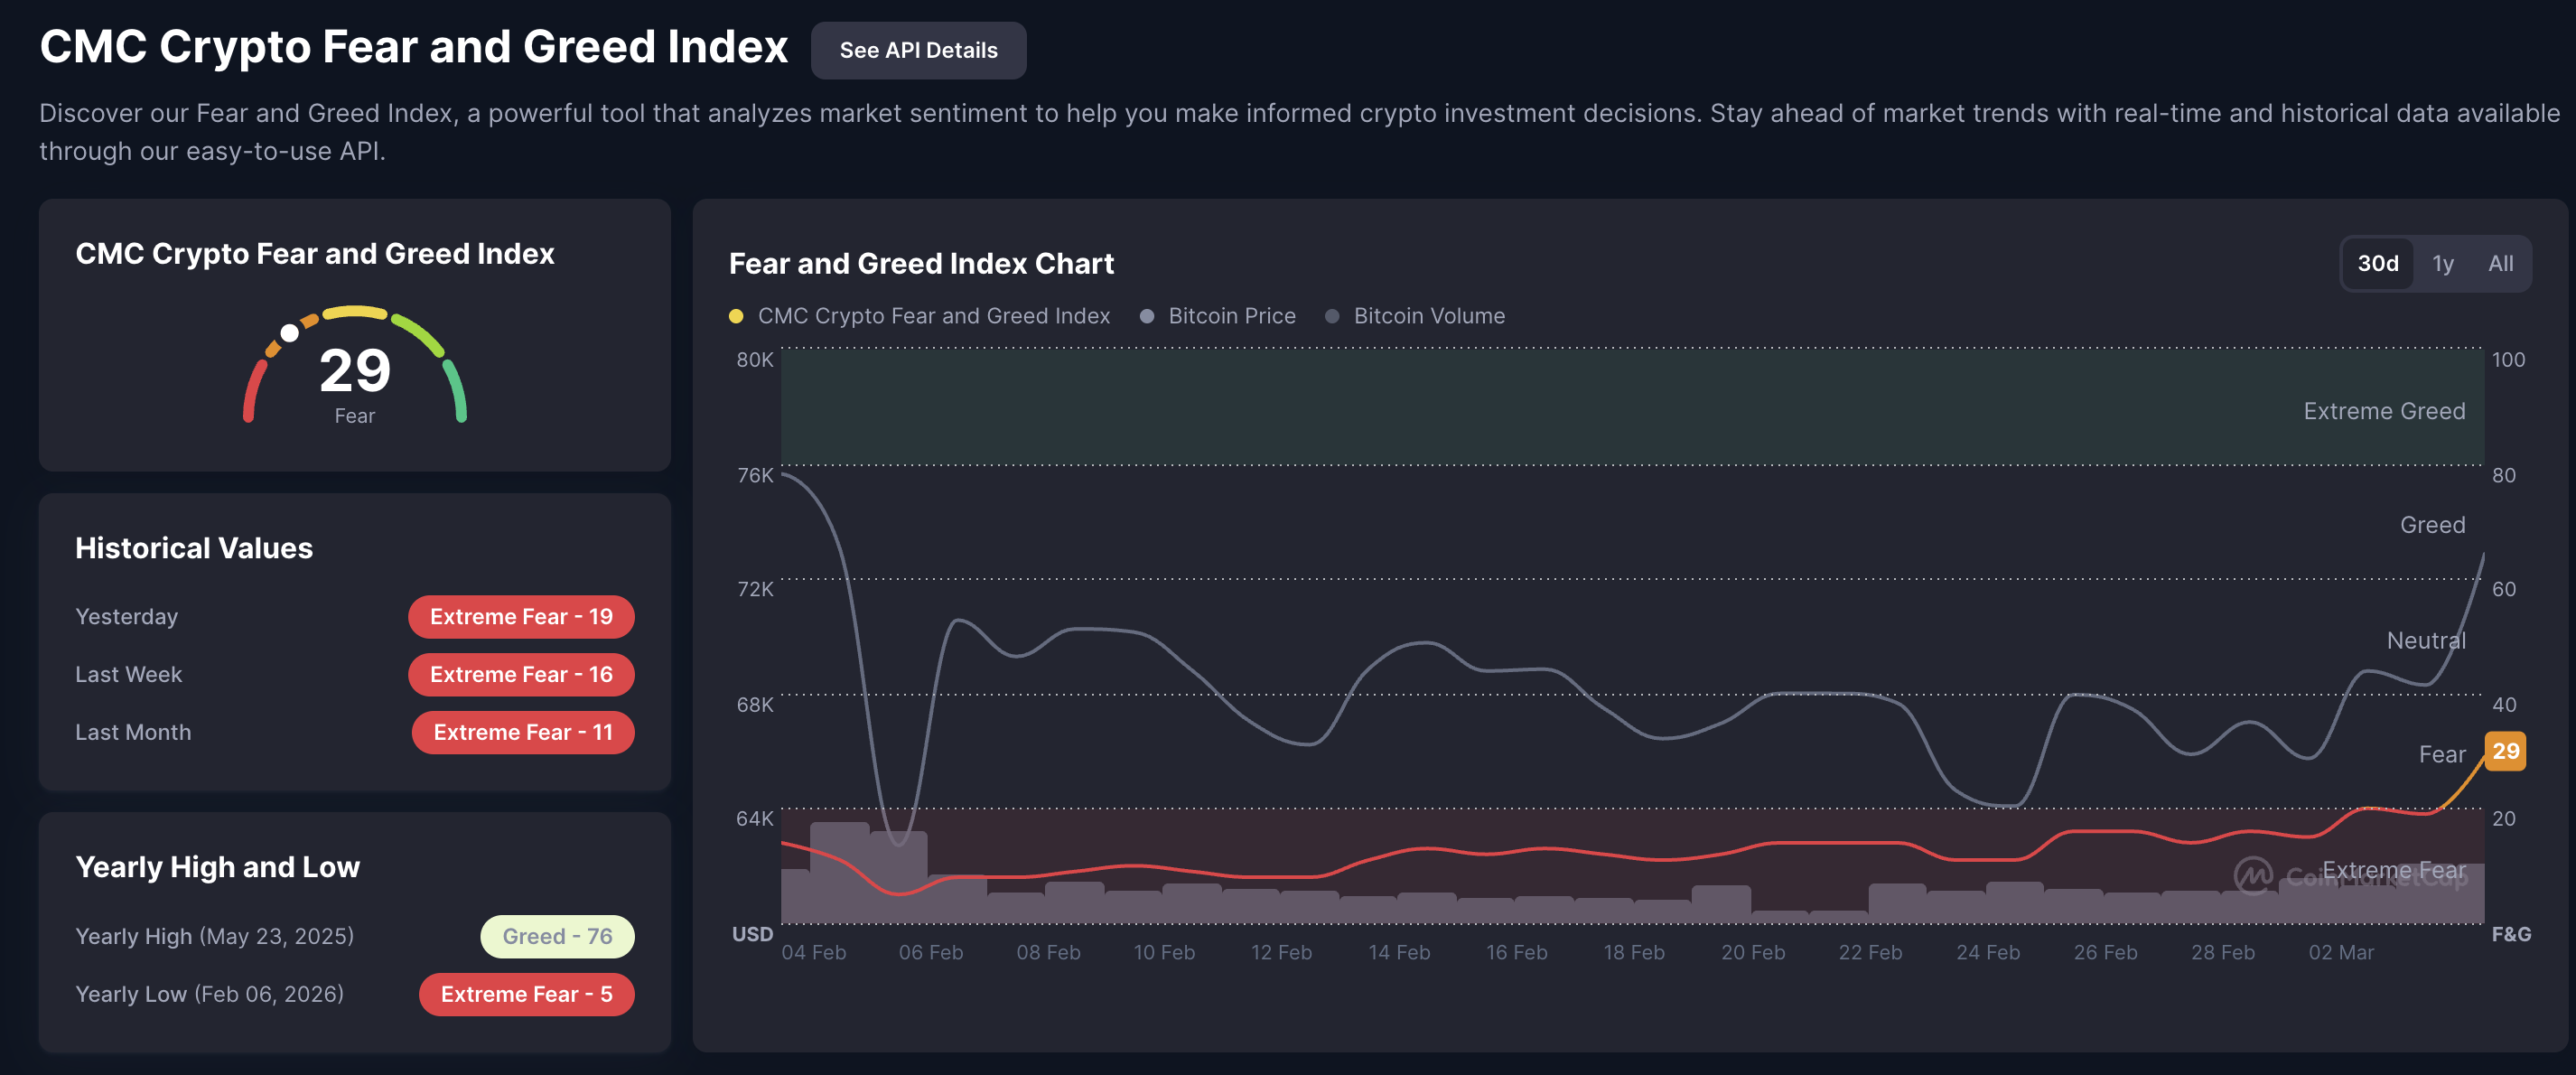
Meanwhile, CoinMarketCap’s Crypto Fear and Greed Index shows a sharp recovery to 29, from 19 on Wednesday, suggesting that bears are losing grip. Still, values below 40 suggest fear in the market, and the neutral zone ranges from 40 to 60. To signal a bull market, the index must cross above 60, indicating renewed investor greed.
Decred, Zcash, and Dogecoin lead the broader market recovery
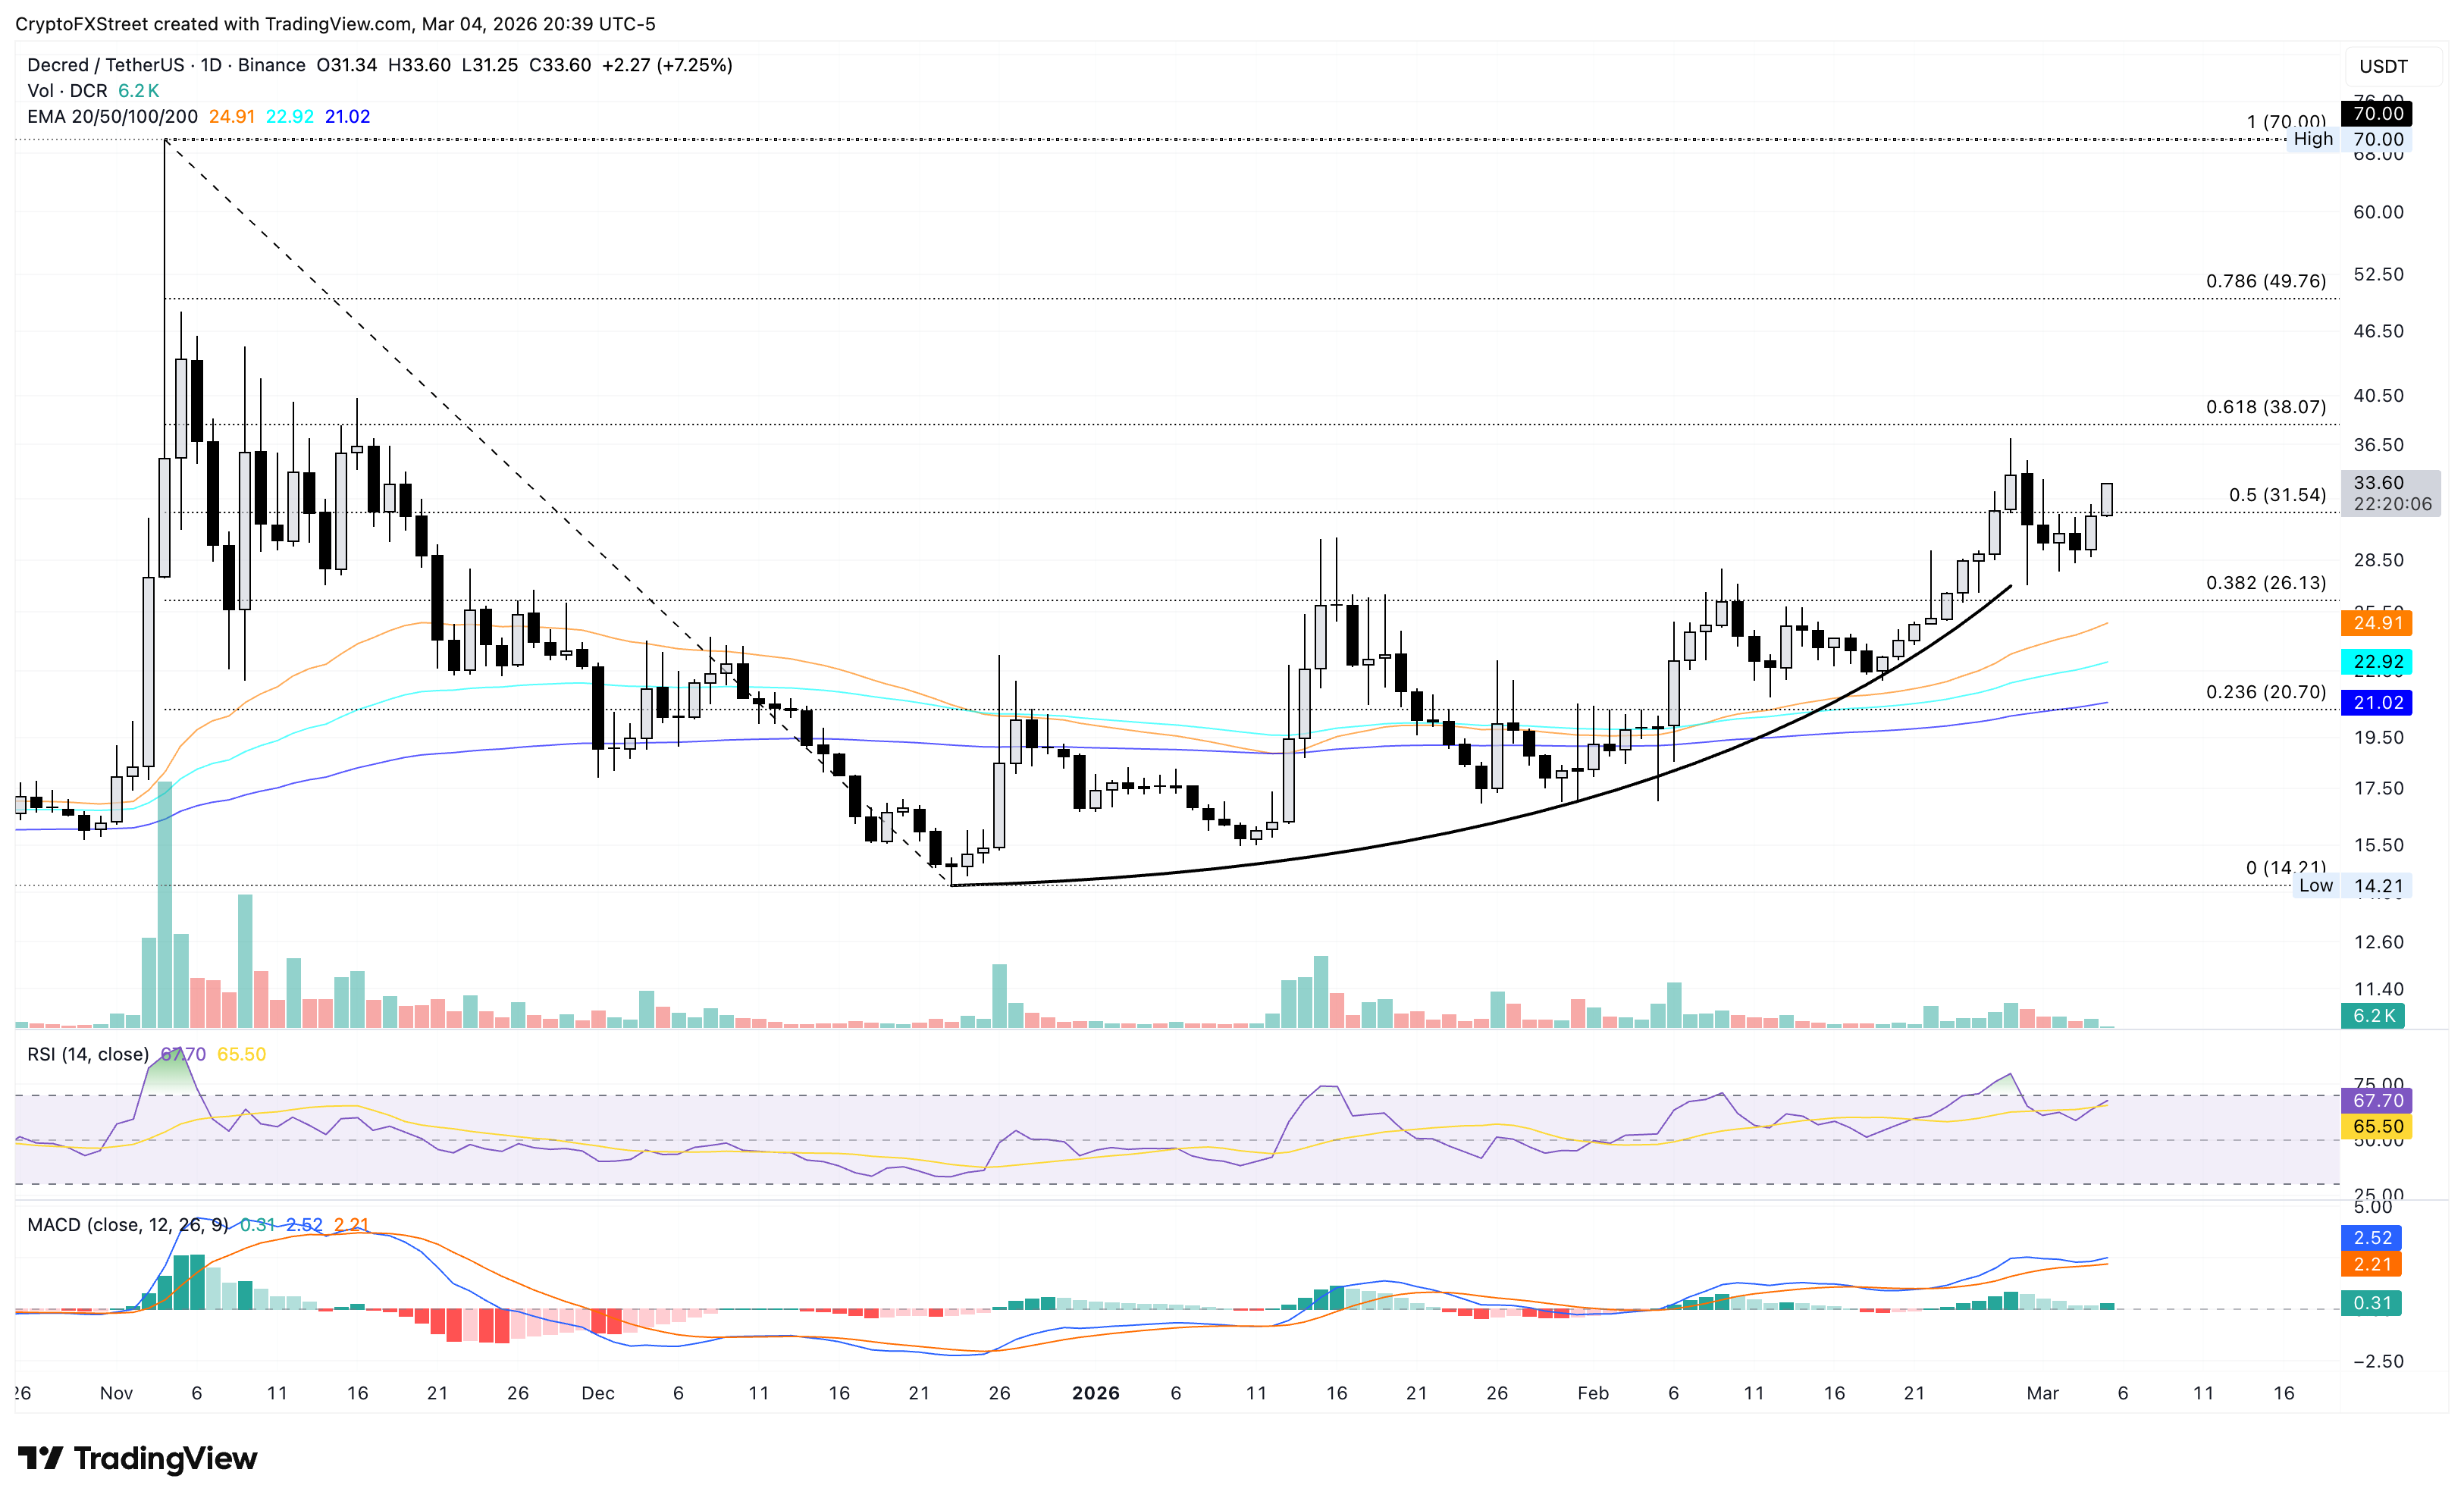
Decred is up 7% at press time on Thursday, building gains over the 7% rise from the previous day. The near-term bias is mildly bullish as DCR holds well above the upward-sloping 50-, 100-, and 200-day EMAs.
The privacy coin trades above the 50% retracement level at $31.54, measured from the November 4 high of $70.00 to the December 23 low of $14.21. A decisive close above this level could target the 61.8% Fibonacci retracement level at $38.07.
The MACD stands above its signal line on the daily chart and remains in positive territory, with a modestly positive histogram, suggesting sustained bullish momentum. The RSI at 66 on the same chart stays below overbought territory, indicating persistent buying pressure without an immediate exhaustion signal.
On the downside, initial support is seen at the 38.2% Fibonacci retracement level at $26.13. However, a deeper pullback would expose the 50-day EMA at $24.88.
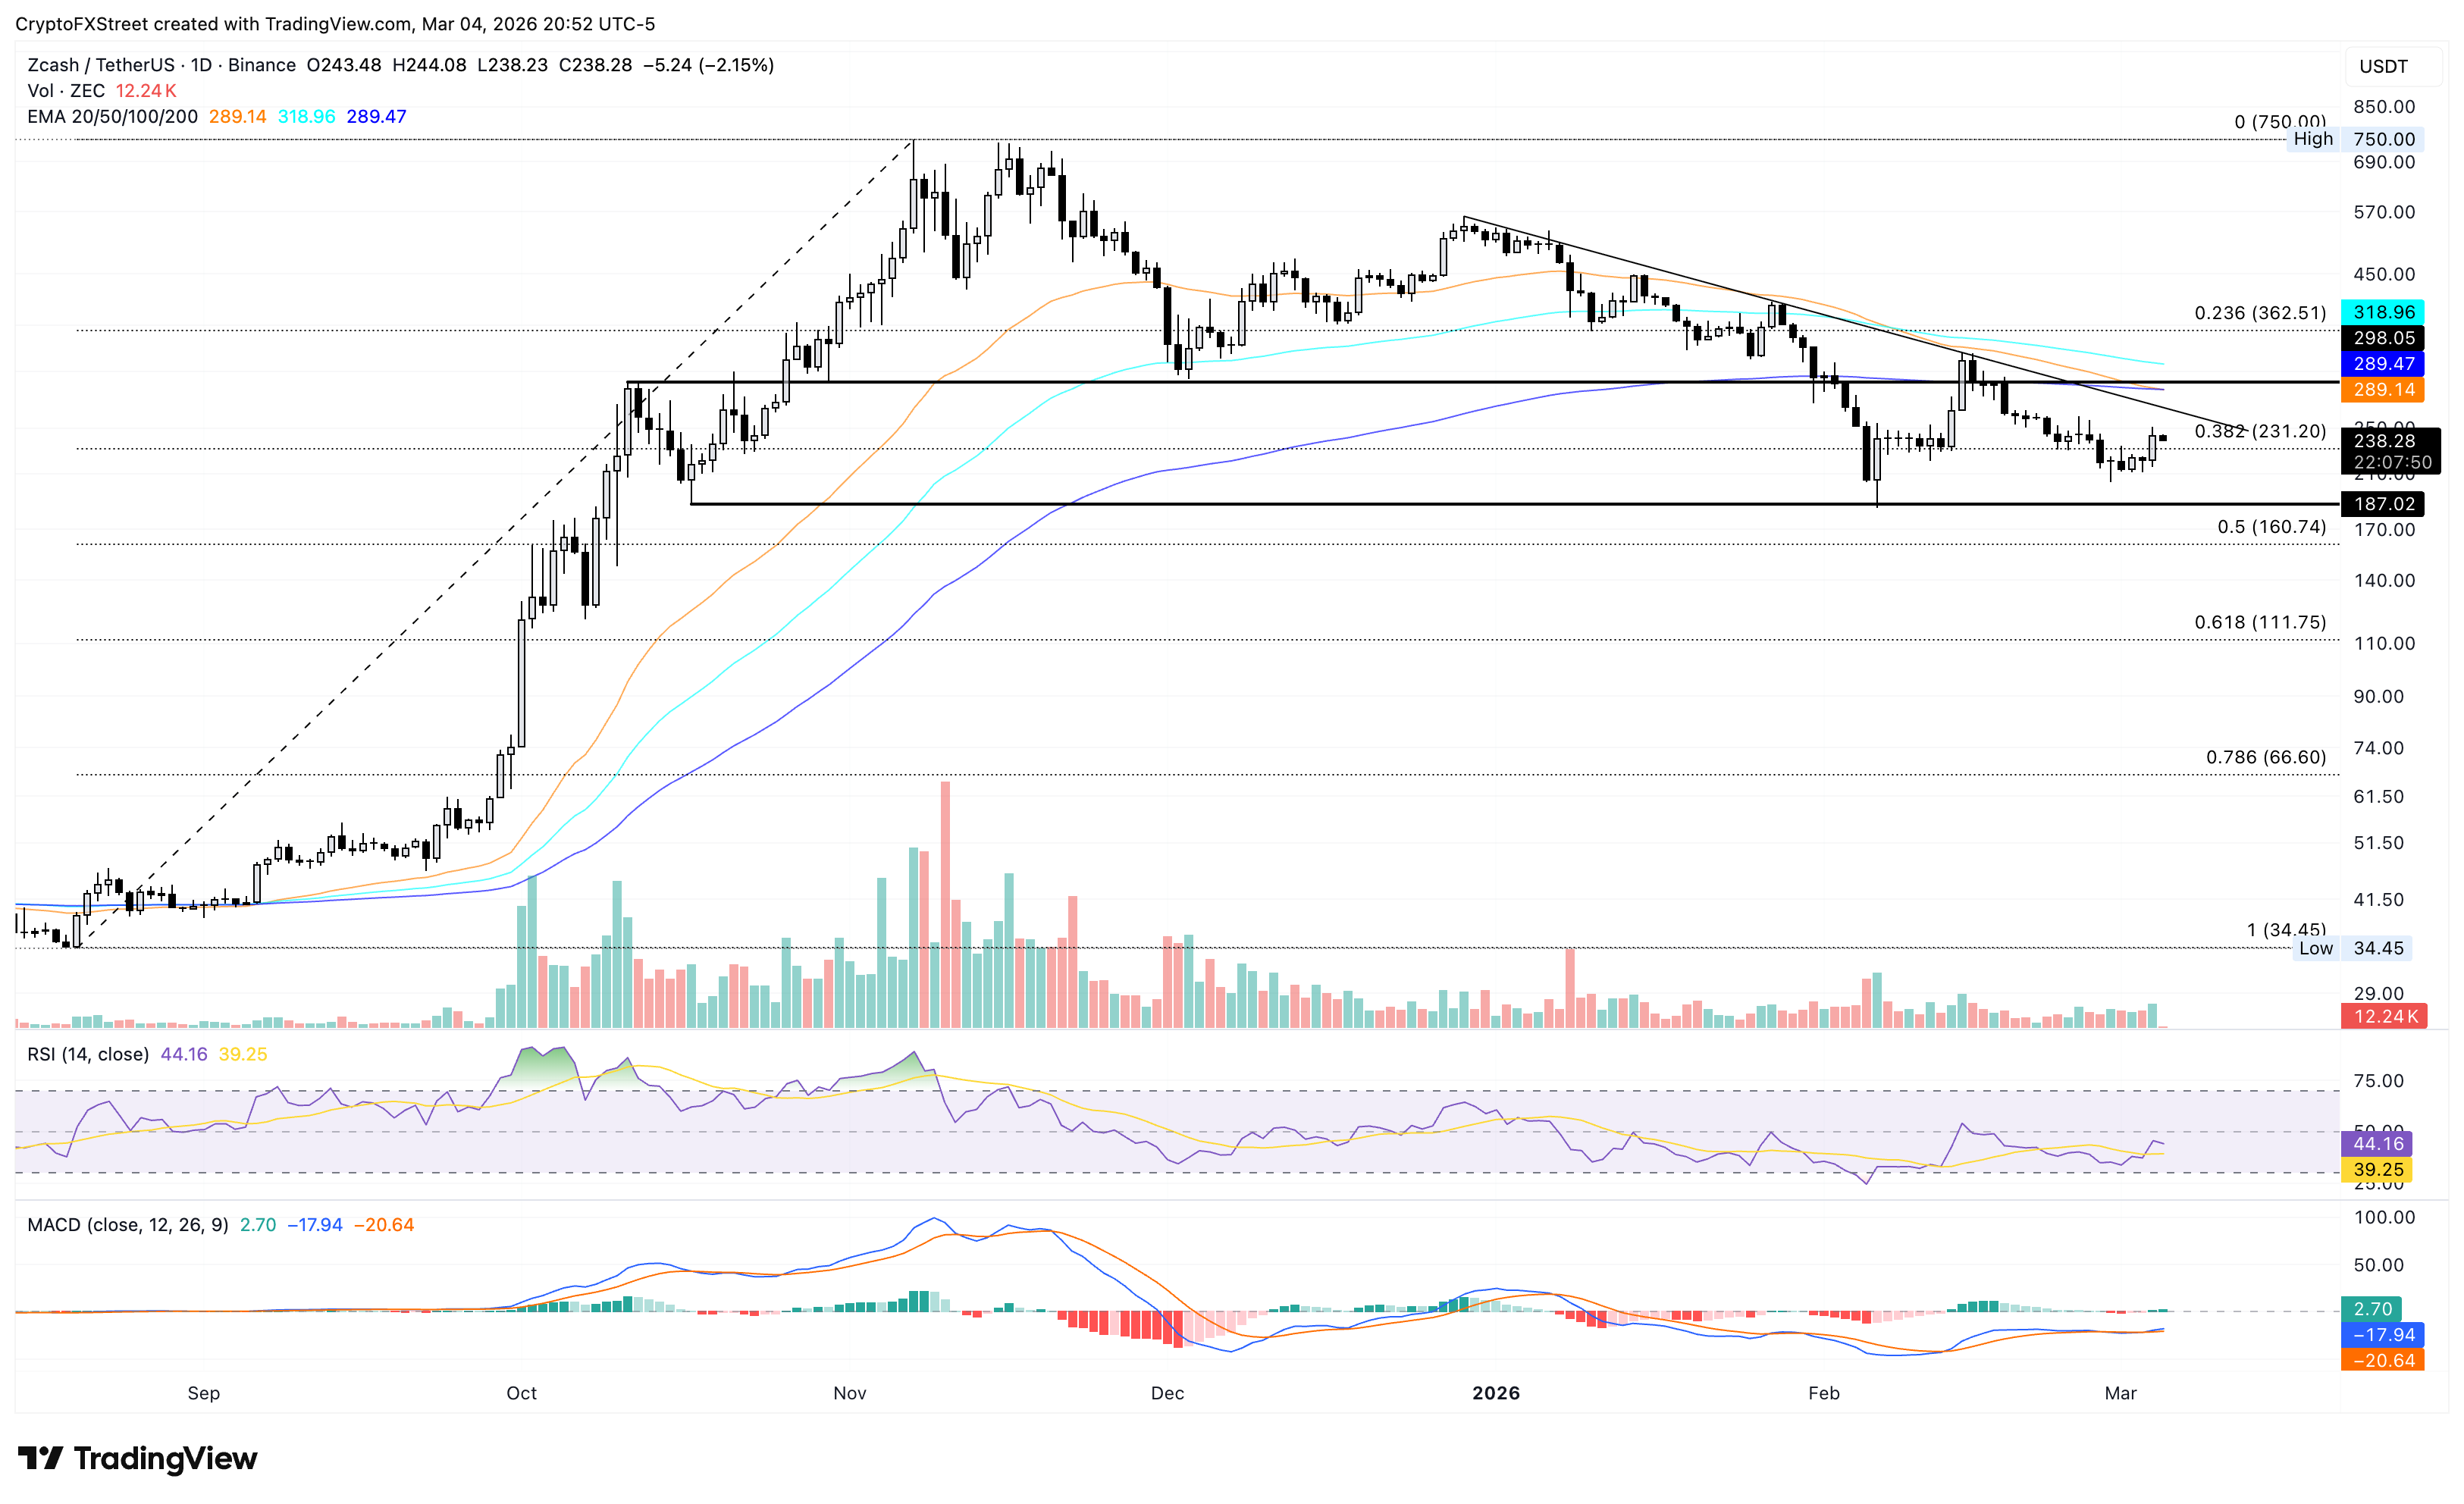
Meanwhile, Zcash is down 2% at press time on Thursday, following a 10% hike on Wednesday. The declining 50-day EMA merges with the 200-day EMA, signaling a high likelihood of a Death Cross, suggesting Wednesday’s rebound as a short-term recovery in a prevailing downward trend.
A descending trendline near $266, followed by the 200-day EMA at $289, could serve as resistance levels.
The MACD rises from its signal line on the daily chart but remains close to the zero mark, suggesting only modest upside momentum, while the RSI at 44 signals subdued buying pressure after recovering from oversold territory.
On the downside, immediate support aligns with the $200 psychological level.
On the other hand, Dogecoin also faces downside pressure near the $0.1000, which capped the 10% gains on Wednesday. At the time of writing, DOGE is down 2% on Thursday, while the downward-sloping 50- and 200-day EMAs serve as overhead resistances keeping the short-term recoveries in check.
To reinstate a fresh uptrend, DOGE should surpass the 50-day EMA at $0.1066, which could extend the upside to the December 31 low at $0.1161 and the 100-day EMA at $0.1240.
The MACD line is marginally above the signal line and hovering just above the zero line, suggesting only modest bullish momentum. The RSI at 47 is just below the midline, reinforcing a neutral bias.
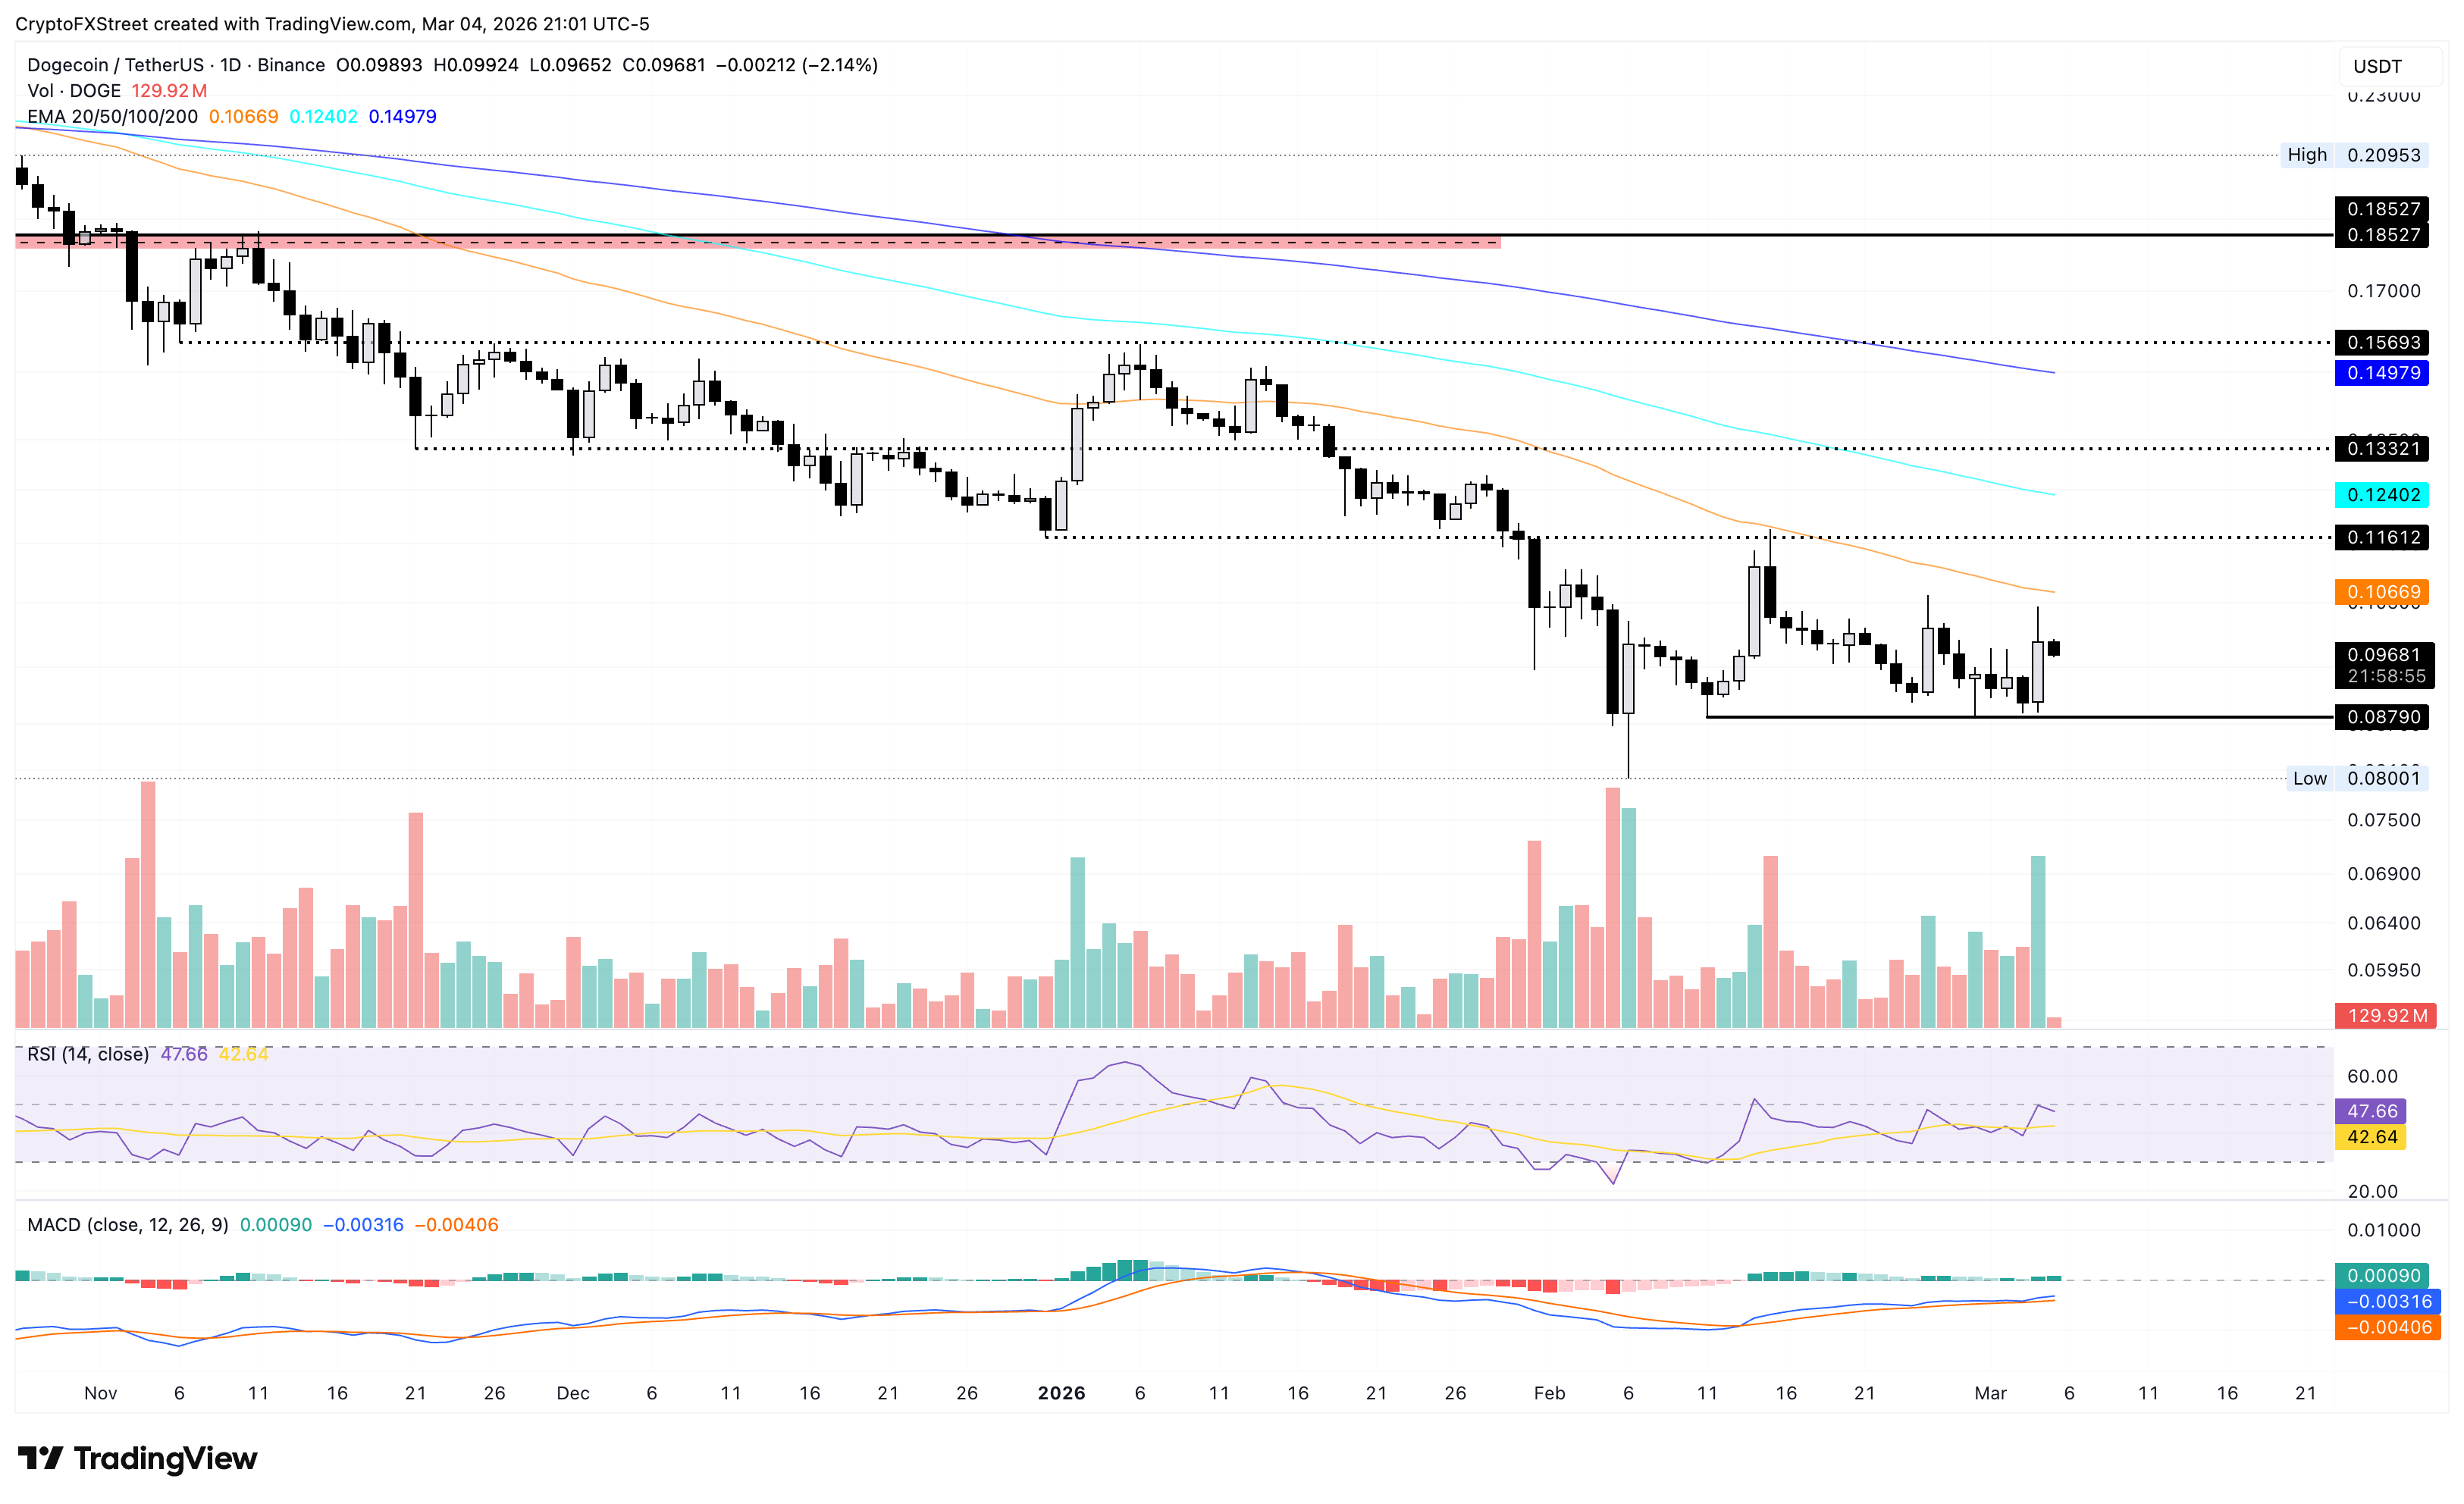
On the downside, the recent swing low near $0.0879 could serve as immediate support.
(The technical analysis of this story was written with the help of an AI tool.)
Artigos Recomendados


