

Crypto Today: Bitcoin, Ethereum, XRP stabilize as risk appetite improves
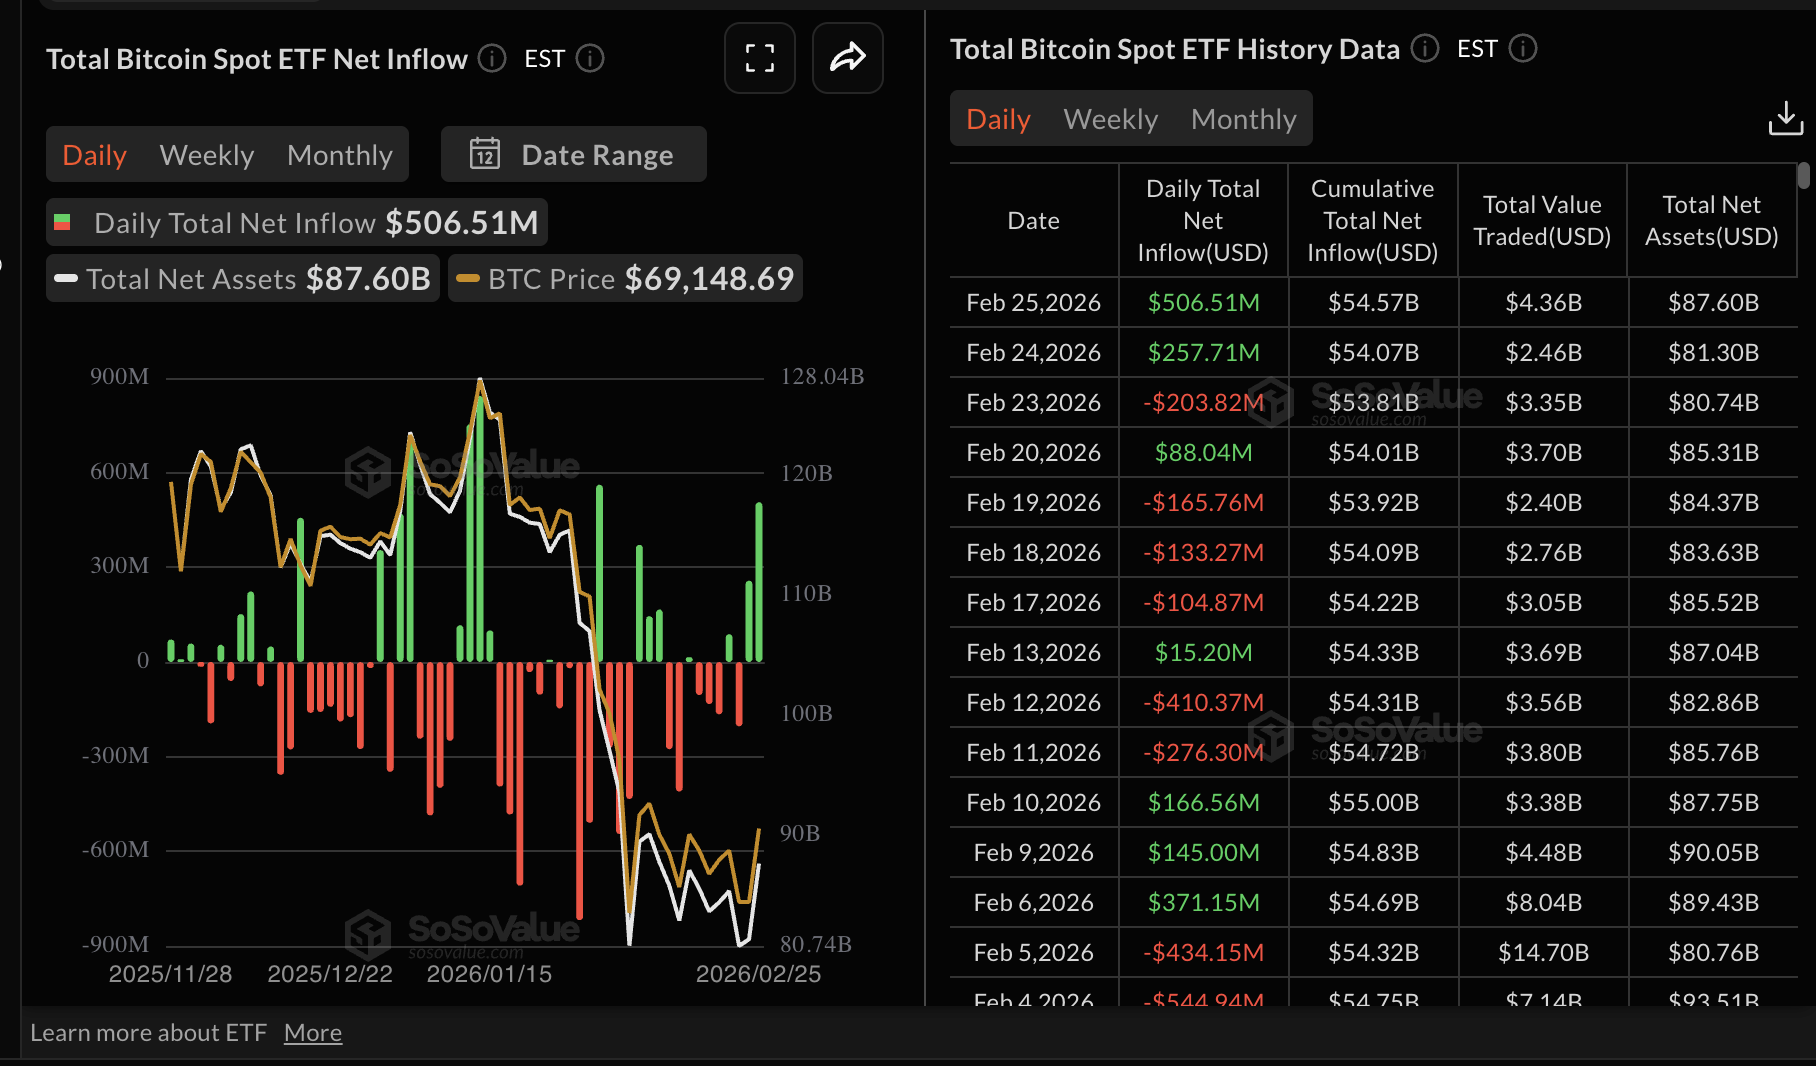
- Bitcoin holds above $68,000, supported by Wednesday’s $507 million in ETF inflows.
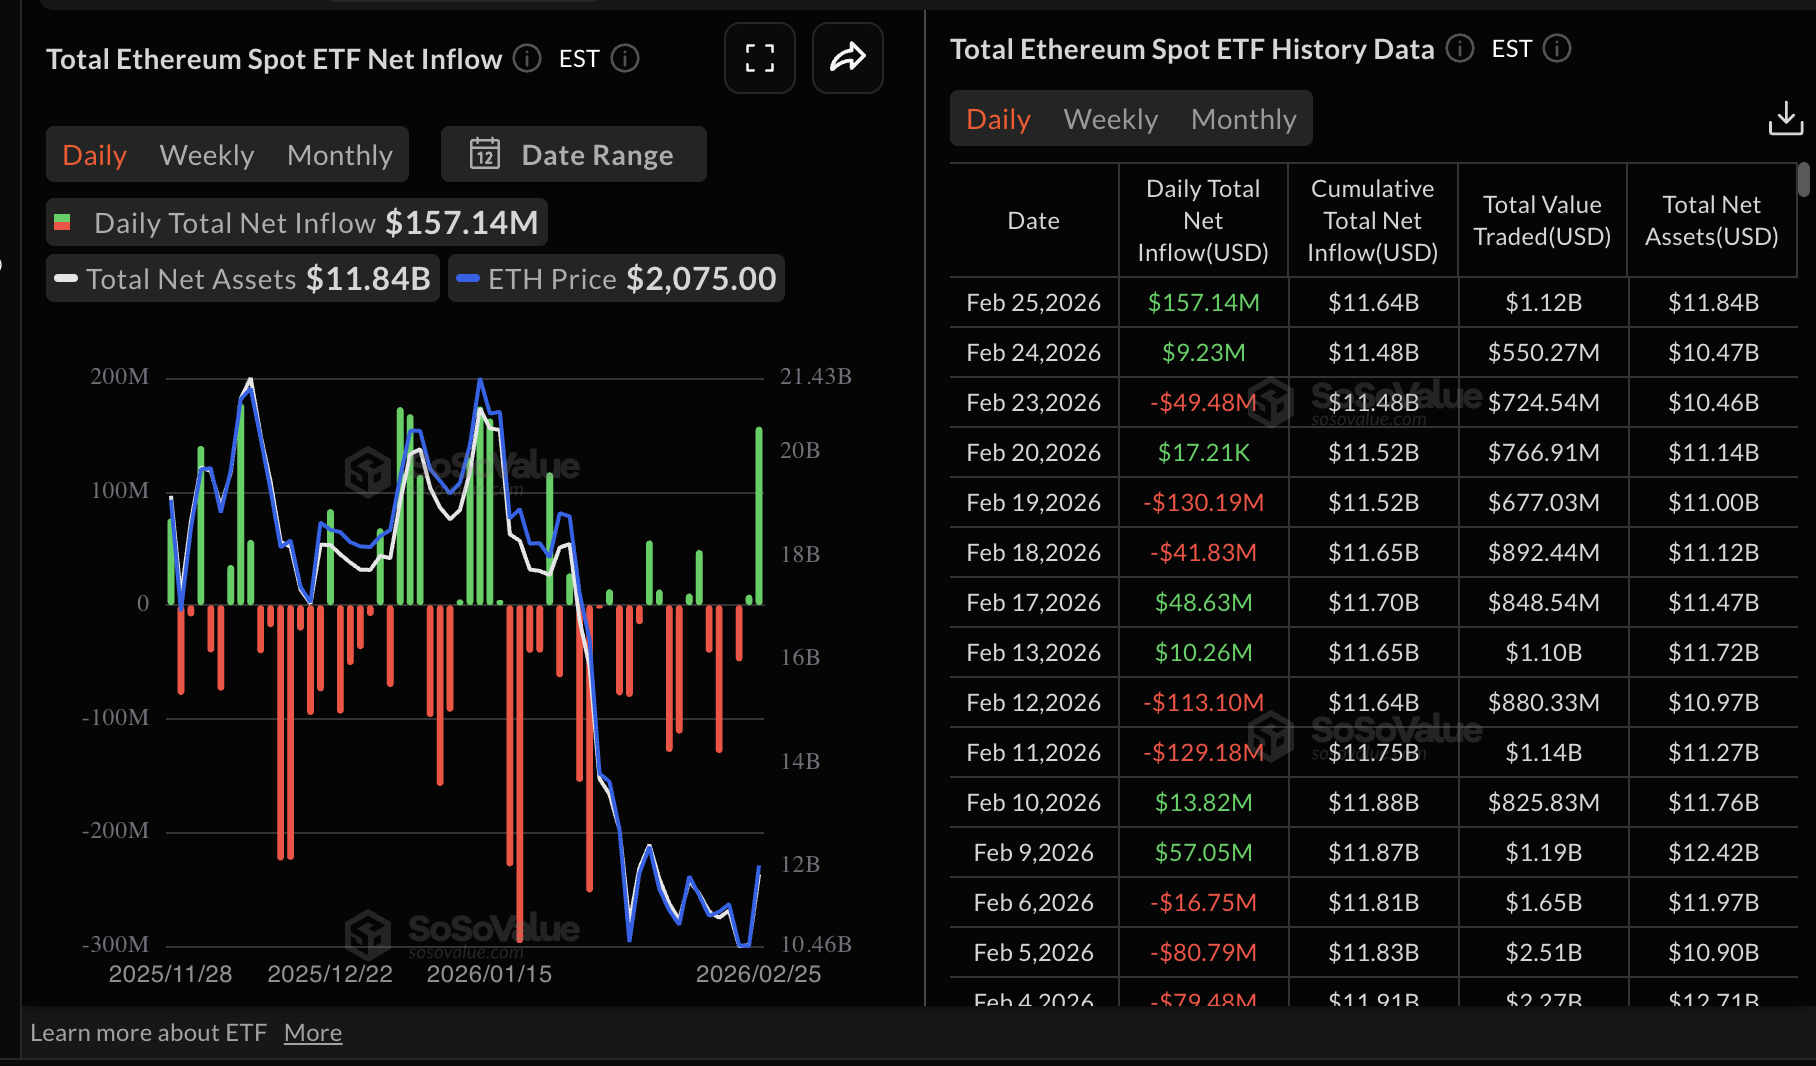
- Ethereum remains above $2,000 after rising from weekly lows at $1,800, supported by a steady return of institutional investors.
- XRP extends its recovery to around $1.45 amid mild ETF inflows and a strengthening bullish technical outlook.
Bitcoin (BTC) steadies above $68,000 at the time of writing on Thursday, reflecting positive sentiment across the crypto market. Altcoins, including Ethereum (ETH) and Ripple (XRP), are stabilizing above key levels at $2,000 and $1.45, respectively.
The turnaround in crypto prices comes amid a steady resurgence of interest in Exchange-Traded Funds (ETFs). Extended inflows could boost interest in risk assets and increase the odds of a breakout in Bitcoin's price above the psychological $70,000 threshold.
Bitcoin, Ethereum, XRP rise amid renewed risk appetite
Inflows into Bitcoin spot ETFs surged to approximately $507 million on Wednesday, building on Tuesday’s $258 million. BlackRock’s IBIT ETF led with inflows of $297 million, followed by Grayscale’s GBTC with $102 million. Cumulative inflows currently stand at $54.57 billion, with total assets under management averaging $867.6 billion.
Steady ETF inflows reinforce bullish sentiment, prompting investors to increase their exposure while anticipating steady price increases.
Ethereum spot ETFs also recorded inflows of $157 million on Wednesday, up from approximately $9 million the previous day. Fidelity’s FETH attracted nearly $62 million in inflows, followed by Grayscale’s ETHE and BlackRock’s ETHA with roughly $34 million and $31 million, respectively.
Meanwhile, XRP recorded modest spot ETF inflows of $3.09 million on Wednesday, a marginal increase from $3.04 million the previous day. Cumulative inflows have increased to $1.24 billion, lifting the total assets under management above $1 billion.
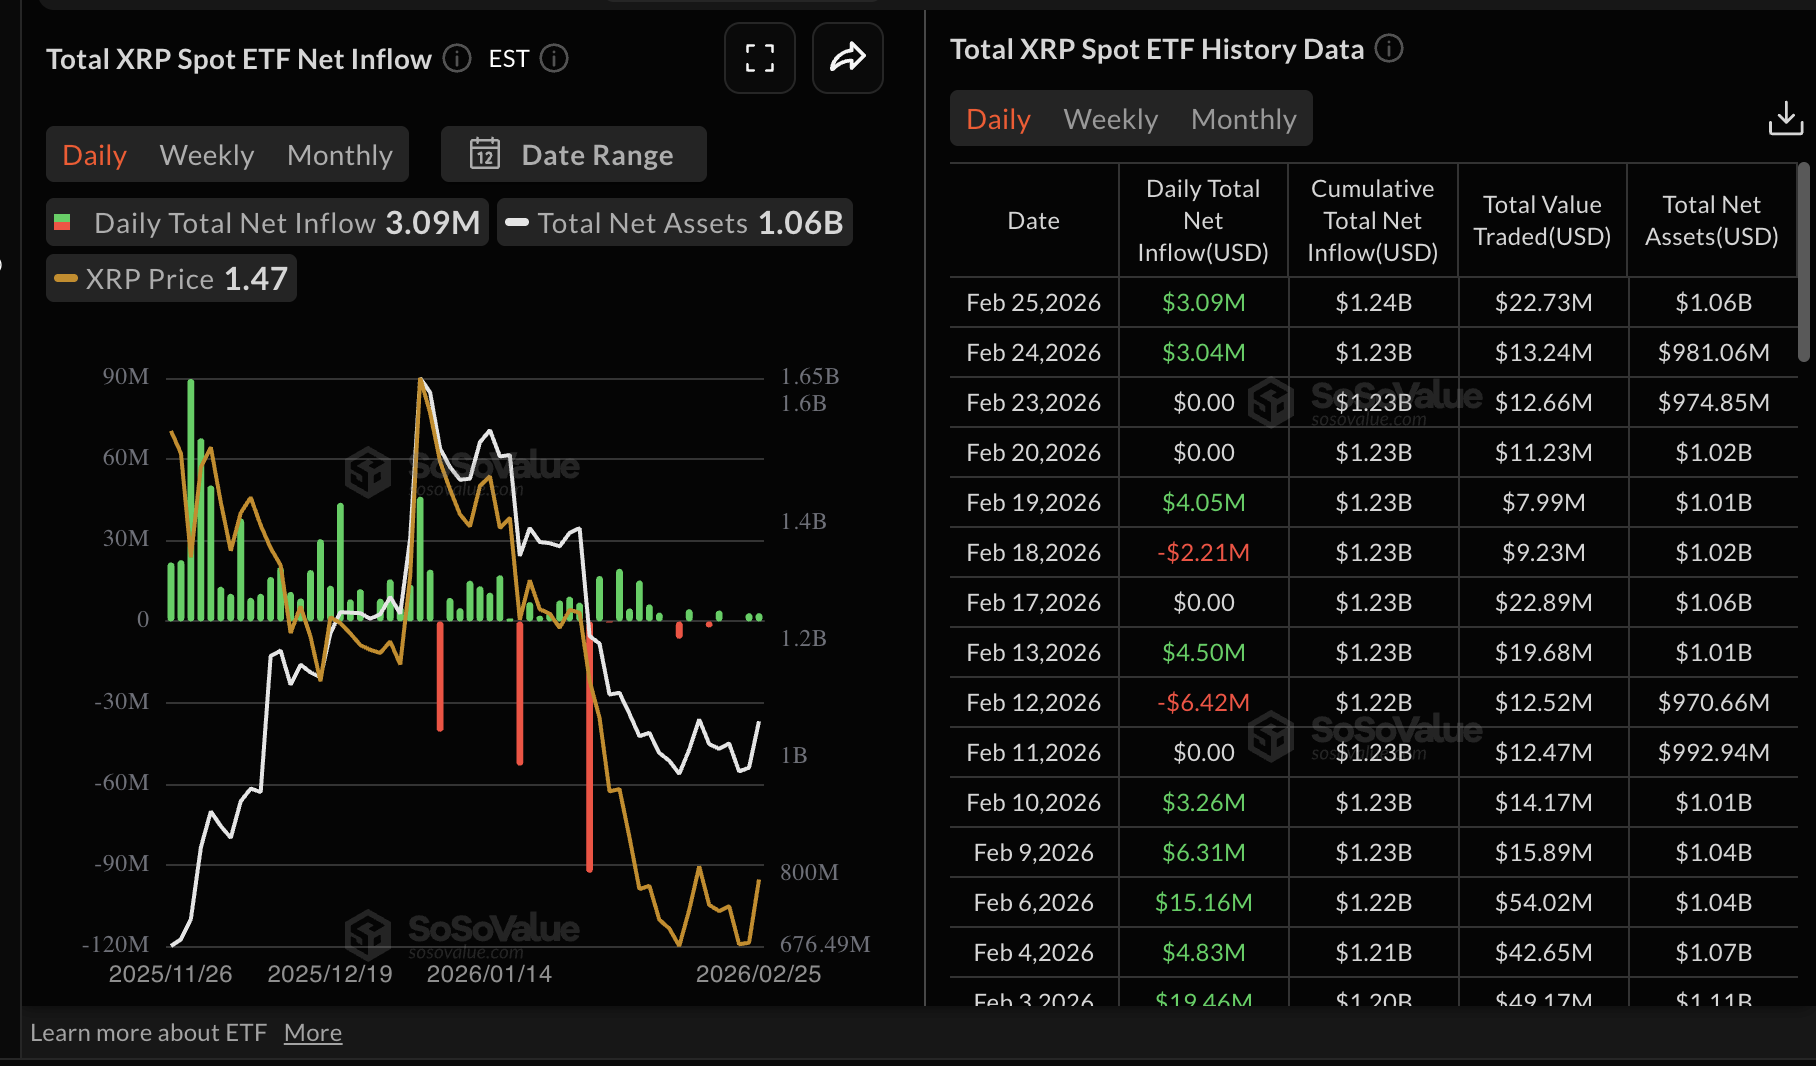
Chart of the day: Bitcoin tests short-term breakout strength
Bitcoin is hovering above $68,000 as the near-term trend turns cautiously bullish. The Moving Average Convergence Divergence (MACD) line remains above its signal line on the daily chart, confirming emerging upside pressure.
Similarly, the Relative Strength Index (RSI) hovers in the low‑40s on the same chart, still below the 50 midline but rising from oversold territory, suggesting fading bearish momentum rather than strong buying conviction.
-1772100967419-1772100967421.png)
Meanwhile, initial resistance emerges at the $70,600 region, aligning with recent daily highs, followed by $72,271, where a recovery attempt stalled on February 8. A daily close above the latter would expose the 50-day Exponential Moving Average (EMA) at $76,180, reinforcing that area as a broader supply band.
Still, immediate support is seen around $65,631, guarding the more important $62,510 floor that contained the prior downswing on Tuesday.
Altcoins technical outlook: Ethereum, XRP rebound gains traction
The leading smart contract token, Ethereum, holds above the pivotal $2,000 level, signaling a mildly bullish outlook as price holds well above weekly lows of $1,800.
The MACD line holds above its signal on the daily chart, with modestly expanding green histogram bars that suggest growing bullish momentum.
At the same time, the RSI around 46 holds below neutral, but has advanced from oversold territory, hinting at fading bearish pressure rather than fresh selling.
Meanwhile, the ETH price remains capped beneath the broader descending resistance trend line drawn from the all-time highs at $4,956, keeping the recovery corrective within a dominant long-term downtrend.
Initial resistance emerges near $2,150, coinciding with Wednesday's high. A break above this area would expose the next resistance around the 50-day EMA at $2,379.
On the downside, immediate support sits at $2,000, with a daily close below opening the way toward Monday's high at $1,958, and the recent base around $1,800.
-1772100936086-1772100936087.png)
As for XRP, the price is teetering around $1.45, up from the weekly low of $1.31. With the MACD line staying above its signal line on the daily chart and the green histogram bars expanding, the path of least resistance could remain upward toward $1.54, where attempts at recovery failed on February 6.
The RSI has recovered toward 46 from oversold territory on the same chart, hinting at improving, though still modest, bullish momentum within a dominant downtrend. A decisive break above that supply zone could see XRP close the gap to test the 50-day EMA at $1.63 and the 100-day EMA at $1.84.
-1772100913223-1772100913225.png)
On the downside, initial support is aligned at $1.42, the intraday low, ahead of the weekly low at $1.31. As long as price trades above this support range, the near-term tone may remain tentatively bullish.
Crypto ETF FAQs
An Exchange-Traded Fund (ETF) is an investment vehicle or an index that tracks the price of an underlying asset. ETFs can not only track a single asset, but a group of assets and sectors. For example, a Bitcoin ETF tracks Bitcoin’s price. ETF is a tool used by investors to gain exposure to a certain asset.
Yes. The first Bitcoin futures ETF in the US was approved by the US Securities & Exchange Commission in October 2021. A total of seven Bitcoin futures ETFs have been approved, with more than 20 still waiting for the regulator’s permission. The SEC says that the cryptocurrency industry is new and subject to manipulation, which is why it has been delaying crypto-related futures ETFs for the last few years.
Yes. The SEC approved in January 2024 the listing and trading of several Bitcoin spot Exchange-Traded Funds, opening the door to institutional capital and mainstream investors to trade the main crypto currency. The decision was hailed by the industry as a game changer.
The main advantage of crypto ETFs is the possibility of gaining exposure to a cryptocurrency without ownership, reducing the risk and cost of holding the asset. Other pros are a lower learning curve and higher security for investors since ETFs take charge of securing the underlying asset holdings. As for the main drawbacks, the main one is that as an investor you can’t have direct ownership of the asset, or, as they say in crypto, “not your keys, not your coins.” Other disadvantages are higher costs associated with holding crypto since ETFs charge fees for active management. Finally, even though investing in ETFs reduces the risk of holding an asset, price swings in the underlying cryptocurrency are likely to be reflected in the investment vehicle too.
(The technical analysis of this story was written with the help of an AI tool.)
Artigos Recomendados


