

Dogecoin, Shiba Inu, Pepe face renewed selling pressure amid bearish market sentiment
- Dogecoin remains vulnerable as it ticks higher after three straight days of downtrend.
- Shiba Inu marks the fourth consecutive day of losses, testing a key support formed last week.
- Pepe extends decline as retail demand wanes amid steady bearish momentum.
Meme coins, including Dogecoin (DOGE), Shiba Inu (SHIB), and Pepe (PEPE), are under pressure on Friday as the broader cryptocurrency market faces another wave of renewed selling. Fear grips market sentiment as the odds of a potential interest rate cut by the Federal Reserve (Fed) decline to nearly 50% ahead of the upcoming Federal Open Market Committee (FOMC) meeting in December.
Furthermore, both the derivatives market and technical outlook indicate a bearish incline in traders' sentiments and trend momentum, risking further losses in the meme coins.
Meme coins' demand fades as market volatility spurs
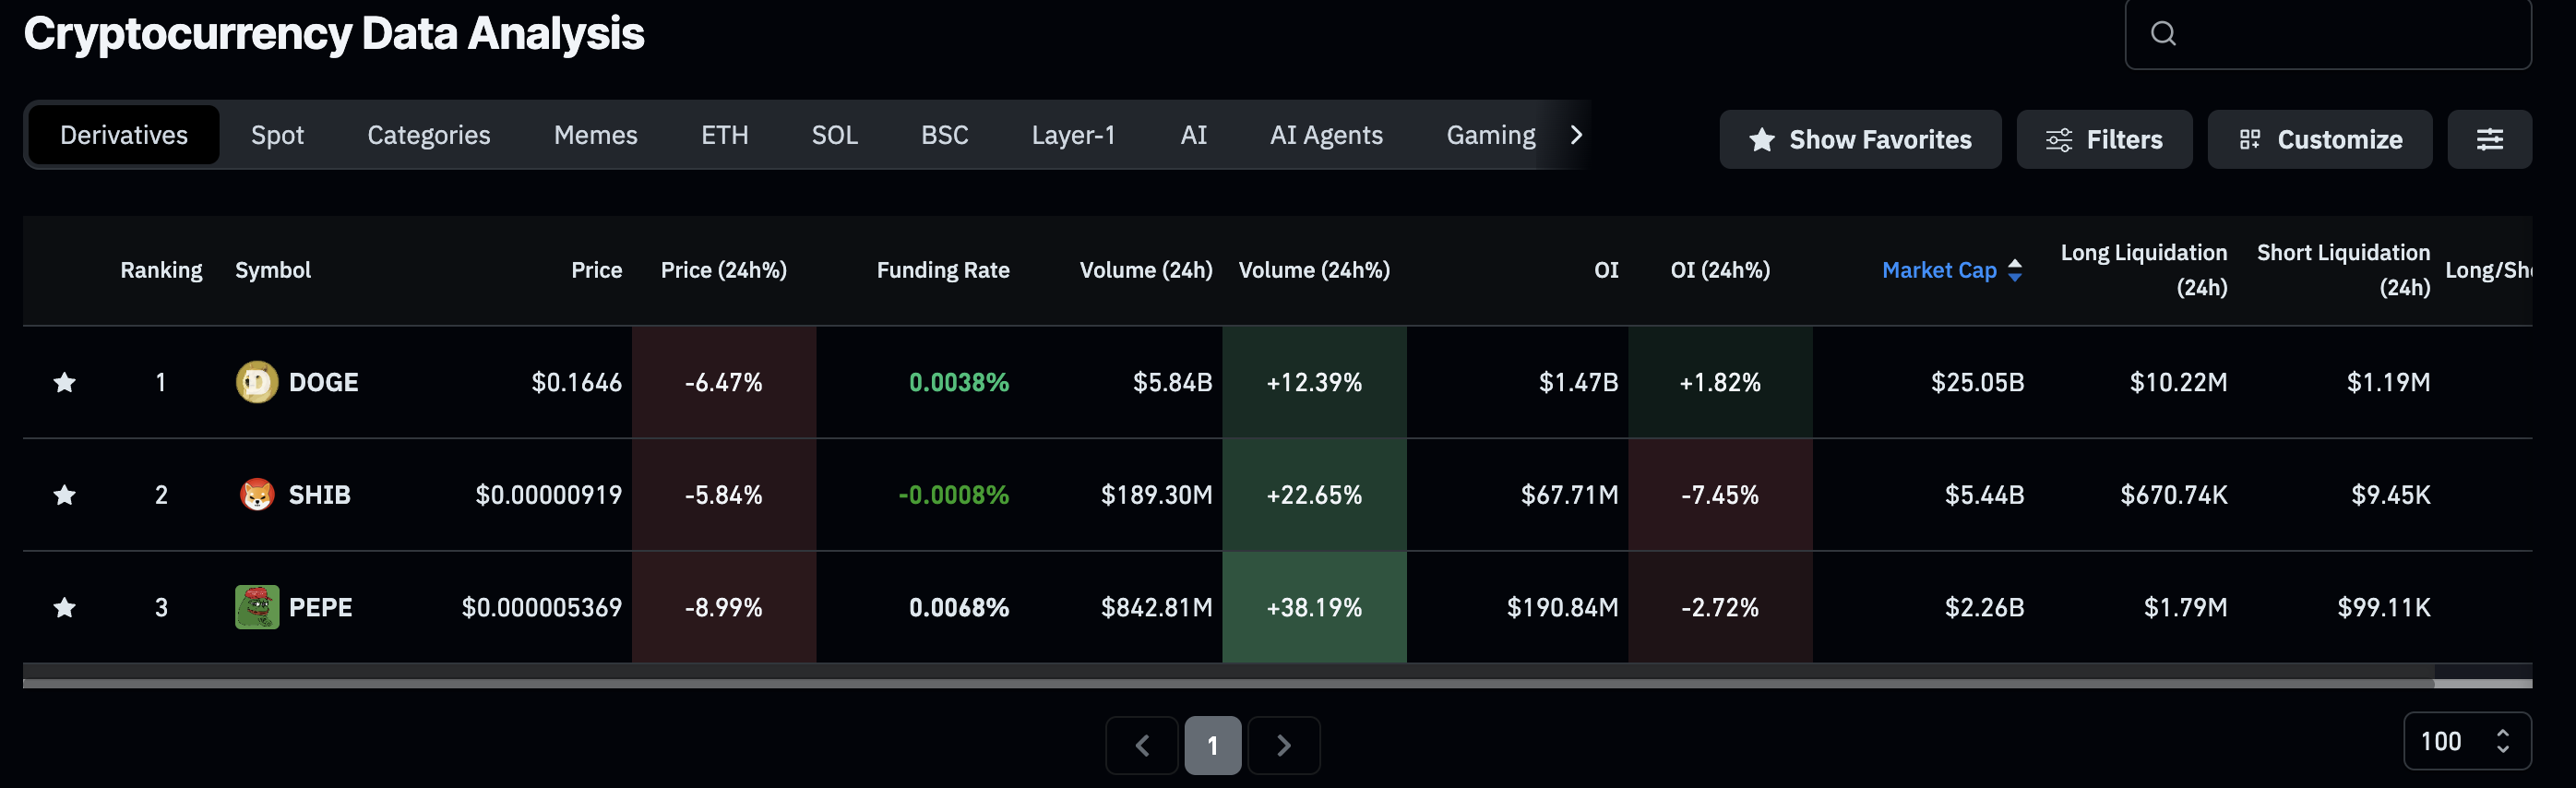
The top three meme coins by market capitalization – Dogecoin, Shiba Inu, and Pepe – are facing losses ranging from 5% to 8% in the last 24 hours. The sell-off in meme coins is triggered by a declining likelihood of a Fed rate cut in December, as the central bank remains uncertain about inflation and employment due to the lack of economic data releases during the government shutdown. "The household survey wasn't conducted in October, so we're going to get half the employment report. We'll get the jobs part, but we won't get the unemployment rate. And that'll just be for one month," said National Economic Council Director Kevin Hassett on Thursday.
According to the CME FedWatch Tool, the market currently prices in 52% odds that the Fed will reduce interest rates by 25 basis points (bps) at its December meeting, down from 62.9% on Thursday, as previously reported by FXStreet.

If the Fed keeps interest rates higher for longer, investors borrowing capital at the current interest rate of 3.75%-4.0% might become reluctant to invest in meme coins or the broader crypto market, as these are considered a high-risk asset class.
Amid such uncertain times, a shroud of risk-off sentiment covers the derivatives market. CoinGlass data shows that the futures Open Interest (OI) of SHIB and PEPE has decreased by roughly 7% and 3% in the last 24 hours, to $67.71 million and $190.84 million, respectively.
Meanwhile, Dogecoin sustains retail demand ahead of a potential Exchange Traded Fund (ETF) by Bitwise, which could be launched by the end of November if the US Securities and Exchange Commission (SEC) does not intervene. The DOGE futures OI is up nearly 2% in the same time frame at $1.47 billion.
Dogecoin extends the post-retest correction
Dogecoin trades below $0.17000 at press time on Friday, following a near 4% drop the previous day. The meme coin risks further correction to the April 7 low of $0.12986, as it performs a breakout–retest–continuation of the $0.18000 zone.
If DOGE slips below $0.12986, the bears could threaten the $0.10000 psychological mark, targeting the October 10 low of $0.95000.
The technical indicators on the daily chart display mixed signals as the Moving Average Convergence Divergence (MACD) retraces towards the signal line. If the blue line falls below the red line, the indicator will flash a sell signal, marking a renewed bearish momentum.
On the other hand, the Relative Strength Index (RSI) at 38 holds above the previous week’s low while DOGE retests the prices from early November, indicating a bullish RSI divergence.
Furthermore, DOGE maintains a declining trend as it trades below the 50-day, 100-day, and 200-day Exponential Moving Averages (EMAs), which signals a strong bearish trend in motion.

If DOGE holds above the $0.15000 round figure, a resurgence in buying pressure with a potential ETF in the pipeline could drive it to a test of the $0.18000 resistance zone.
Shiba Inu risks losing the bottom formed last week
Shiba Inu extends a declining trend below the $0.00001000 psychological level, marking its fourth consecutive bearish candle on the daily chart. SHIB approaches the S1 Pivot Point at $0.00000879, a price level that helped in a bounce back last week.
If SHIB fails to avoid a daily close below this level, it could extend the downfall to the S2 Pivot Point at $0.00000759.
Similar to DOGE, the momentum indicators remain mixed, as the RSI at 39 flashes a bullish divergence, while the MACD is on the verge of a bearish crossover.
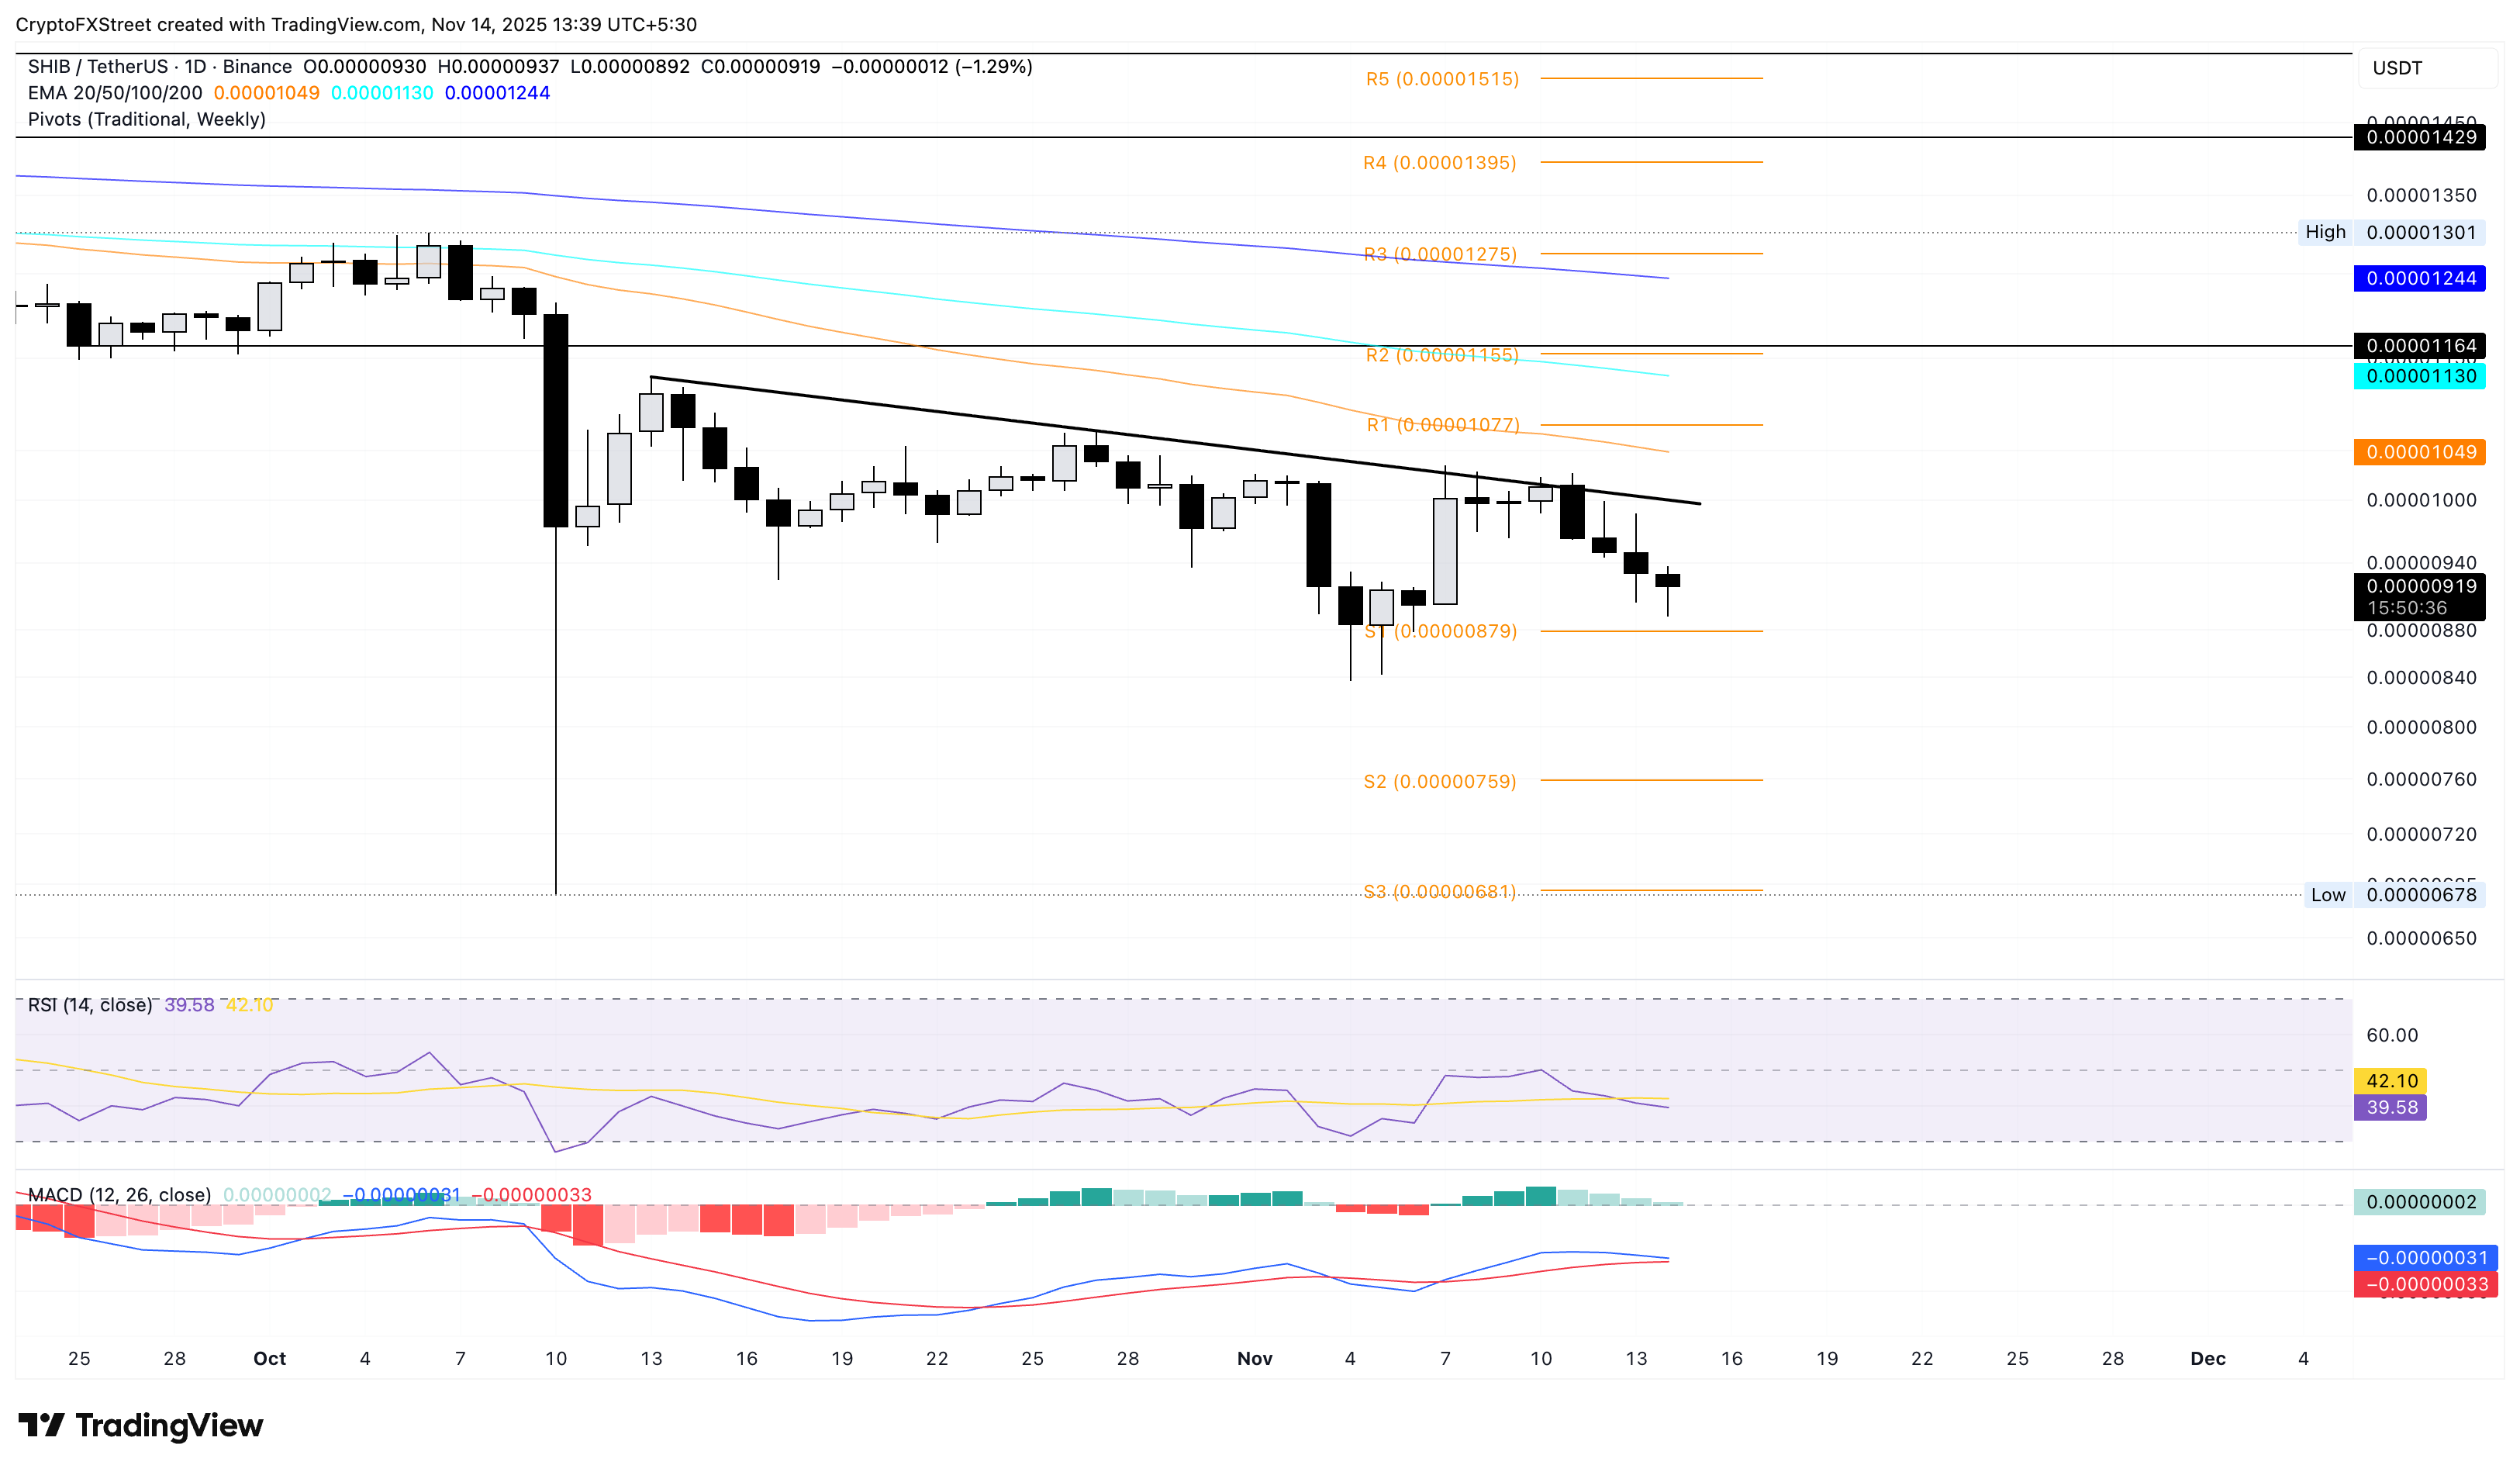
If SHIB rebounds from $0.00000759, it could test a local resistance trendline near the $0.00001000 mark.
Pepe edges closer to a nosedive
Pepe is down nearly 1% at press time on Friday, extending the 5% loss from the previous day. Similar to Dogecoin, the frog-themed meme coin mimics a breakout-retest-continuation throwback from the $0.00000650 zone.
The S1 Pivot Point at $0.00000528 holds PEPE, absorbing the incoming supply. However, if bears successfully close the day below this level, an extension to the S2 Pivot Point at $0.00000449 coule be possible.
The technical indicators present a similar trend situation to DOGE and SHIB, with the RSI at 33 oscillating towards the oversold zone, accompanied by a bullish RSI divergence. Meanwhile, MACD risks crossing below the signal line, which could confirm a renewed bearish momentum.
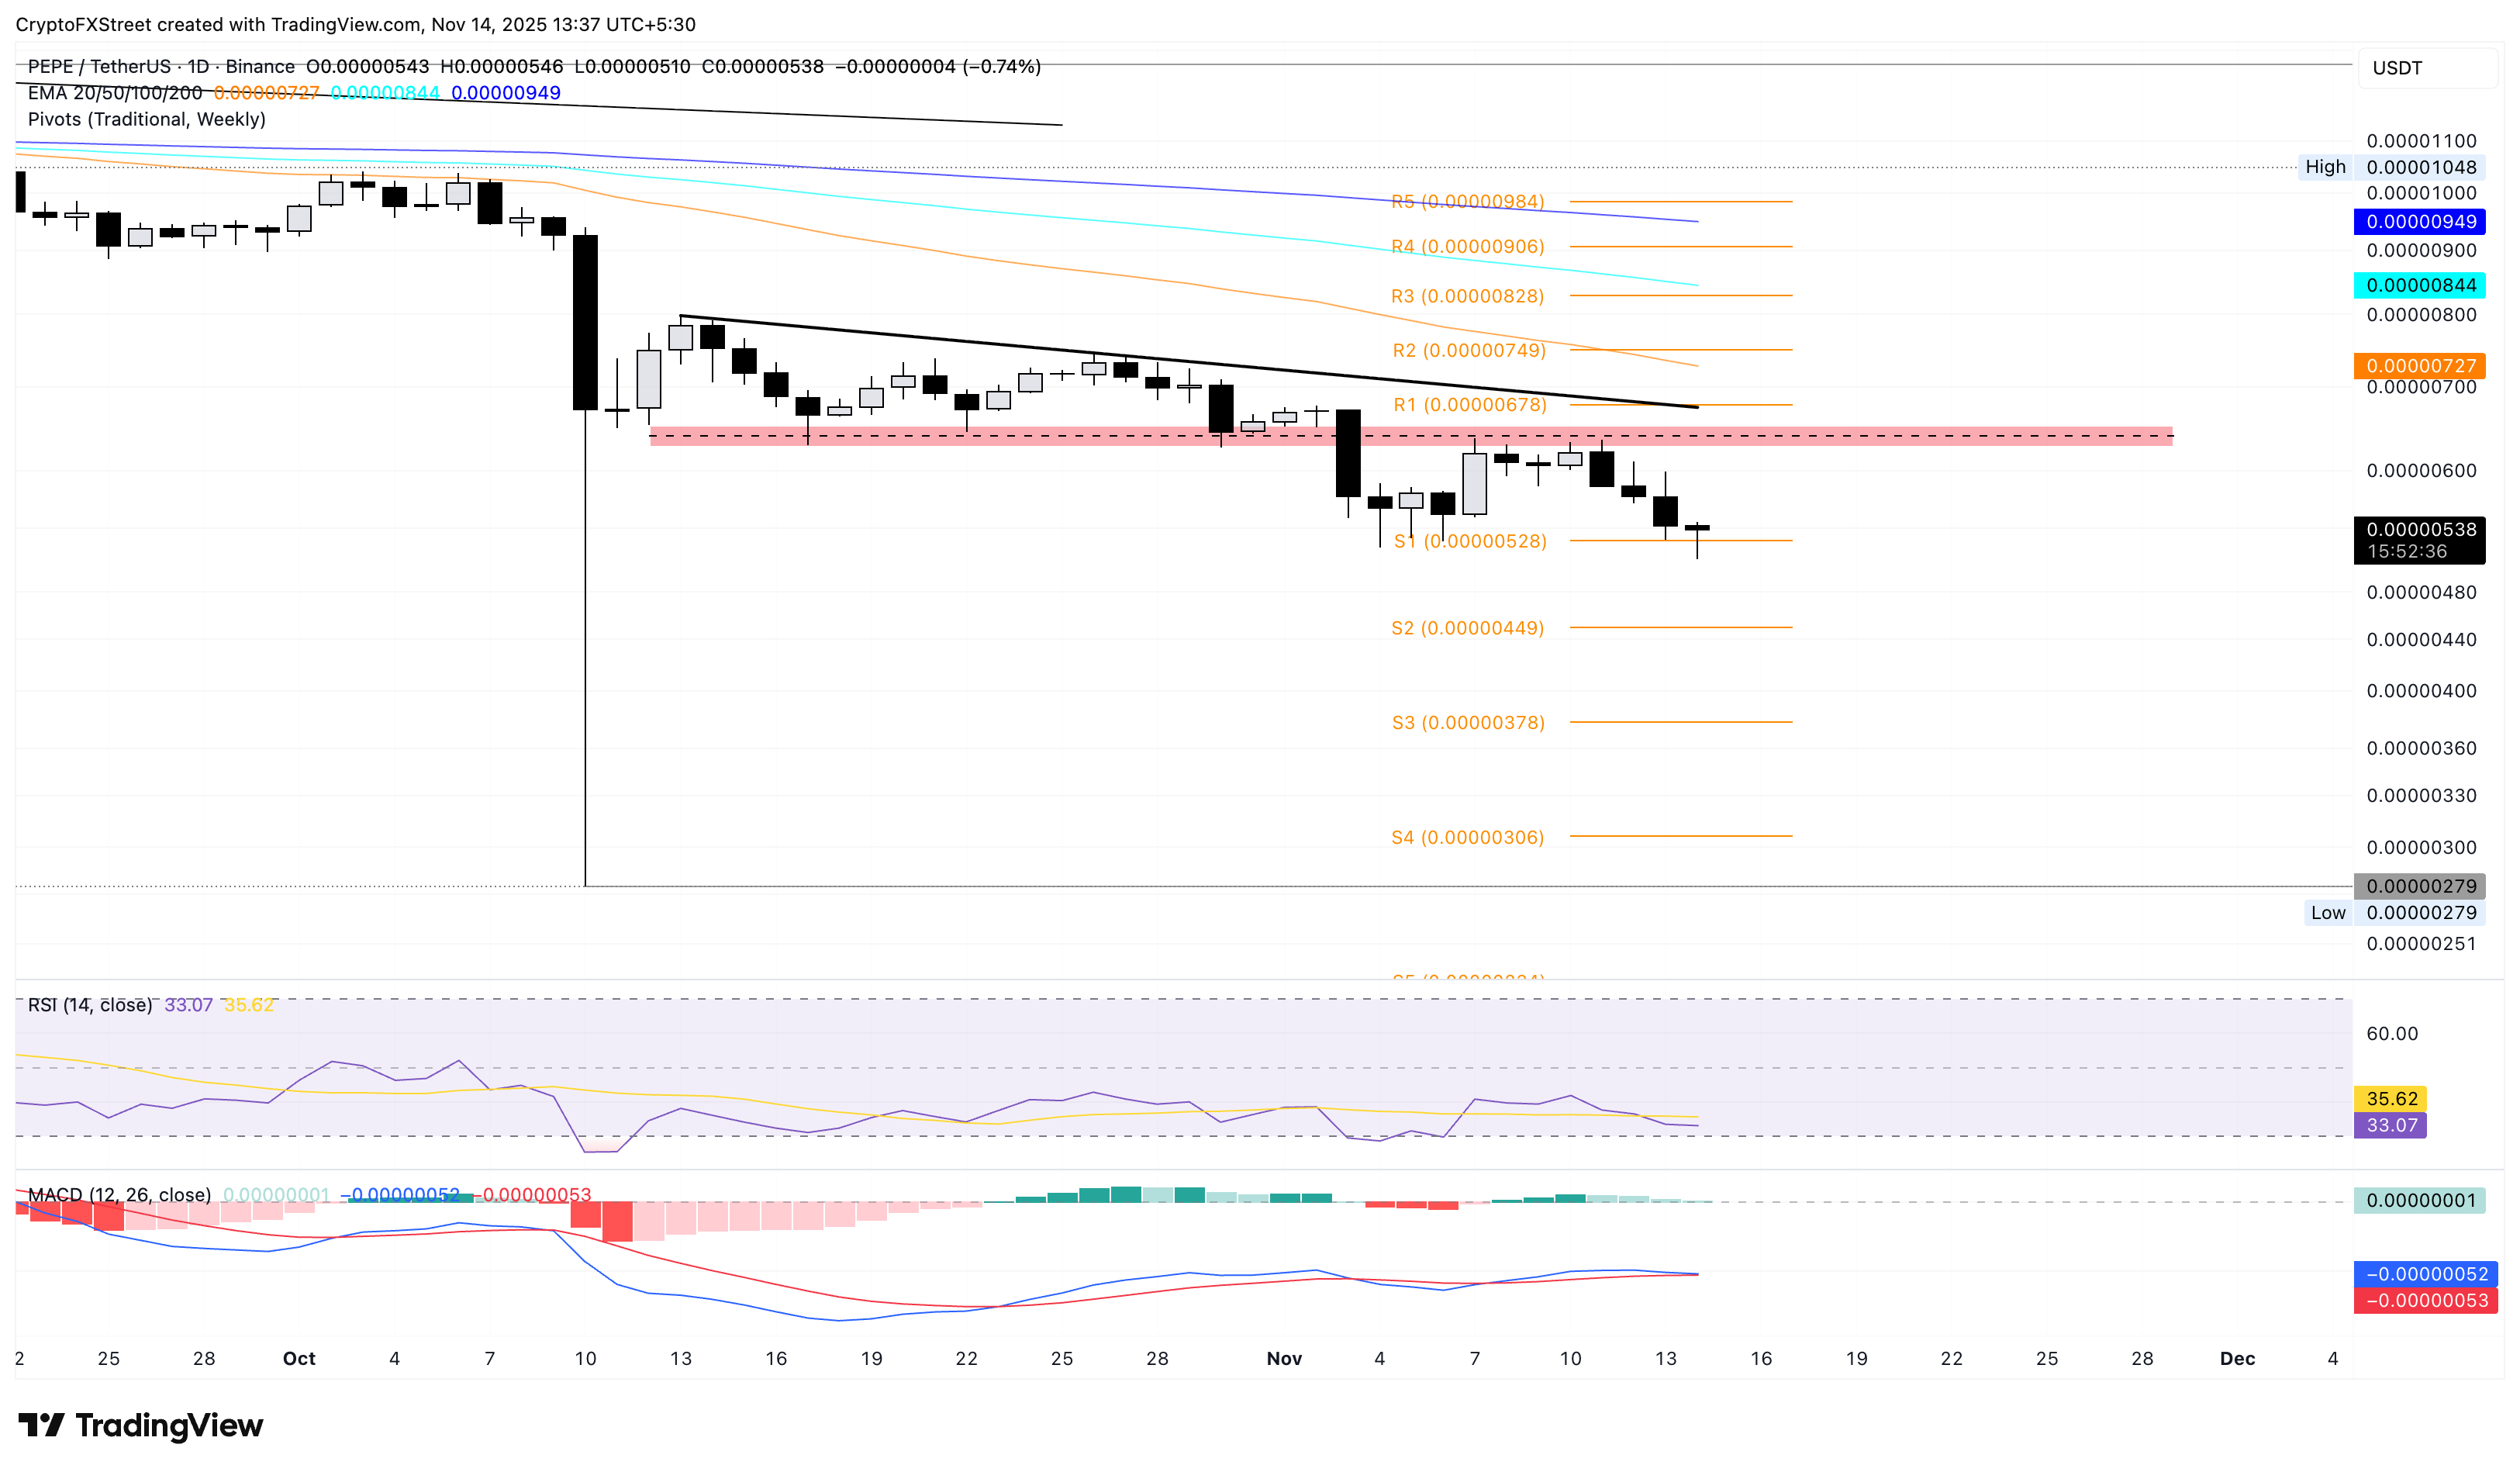
On the upside, a potential uprise in PEPE prices could face the $0.00000650 supply zone.
Artigos Recomendados


