
Gold Price Forecast: XAU/USD approaches resistance at $3,340
- Gold has reversed course and is trading higher for the second day in a row.
- Investors' optimism about a positive outcome of the US-China talks is fading.
- XAU/USD is likely to face resistance at $3,340 and $3,370.
Gold (XAU/USD) has reversed course durub¡ng the European trading session on Tuesday, and is showing moderate gains, approaching resistance at $3,340 as the Dollar gives away gains with optimism about the outcome of the US-China meeting wearing off.
seems
A mild enthusiasm on the back of the positive comments from President Trump and US representatives regarding the developments of the negotiation seems to have faded, as the meeting extends for the second day. The US Dollar is giving away gains with investors turning more cautious, boosting demand for safe havens like Gold.
Investors are trimming their US Dollar longs, increasingly cautious about the outcome of the negotiations between the world’s two major economies, amid the lack of progress on trade deals. So far, only the UK has reached a rather modest one, while the clock ticks closer to the July 9 deadline.
Technical analysis: XAU/USD bearish trend is losing momentum
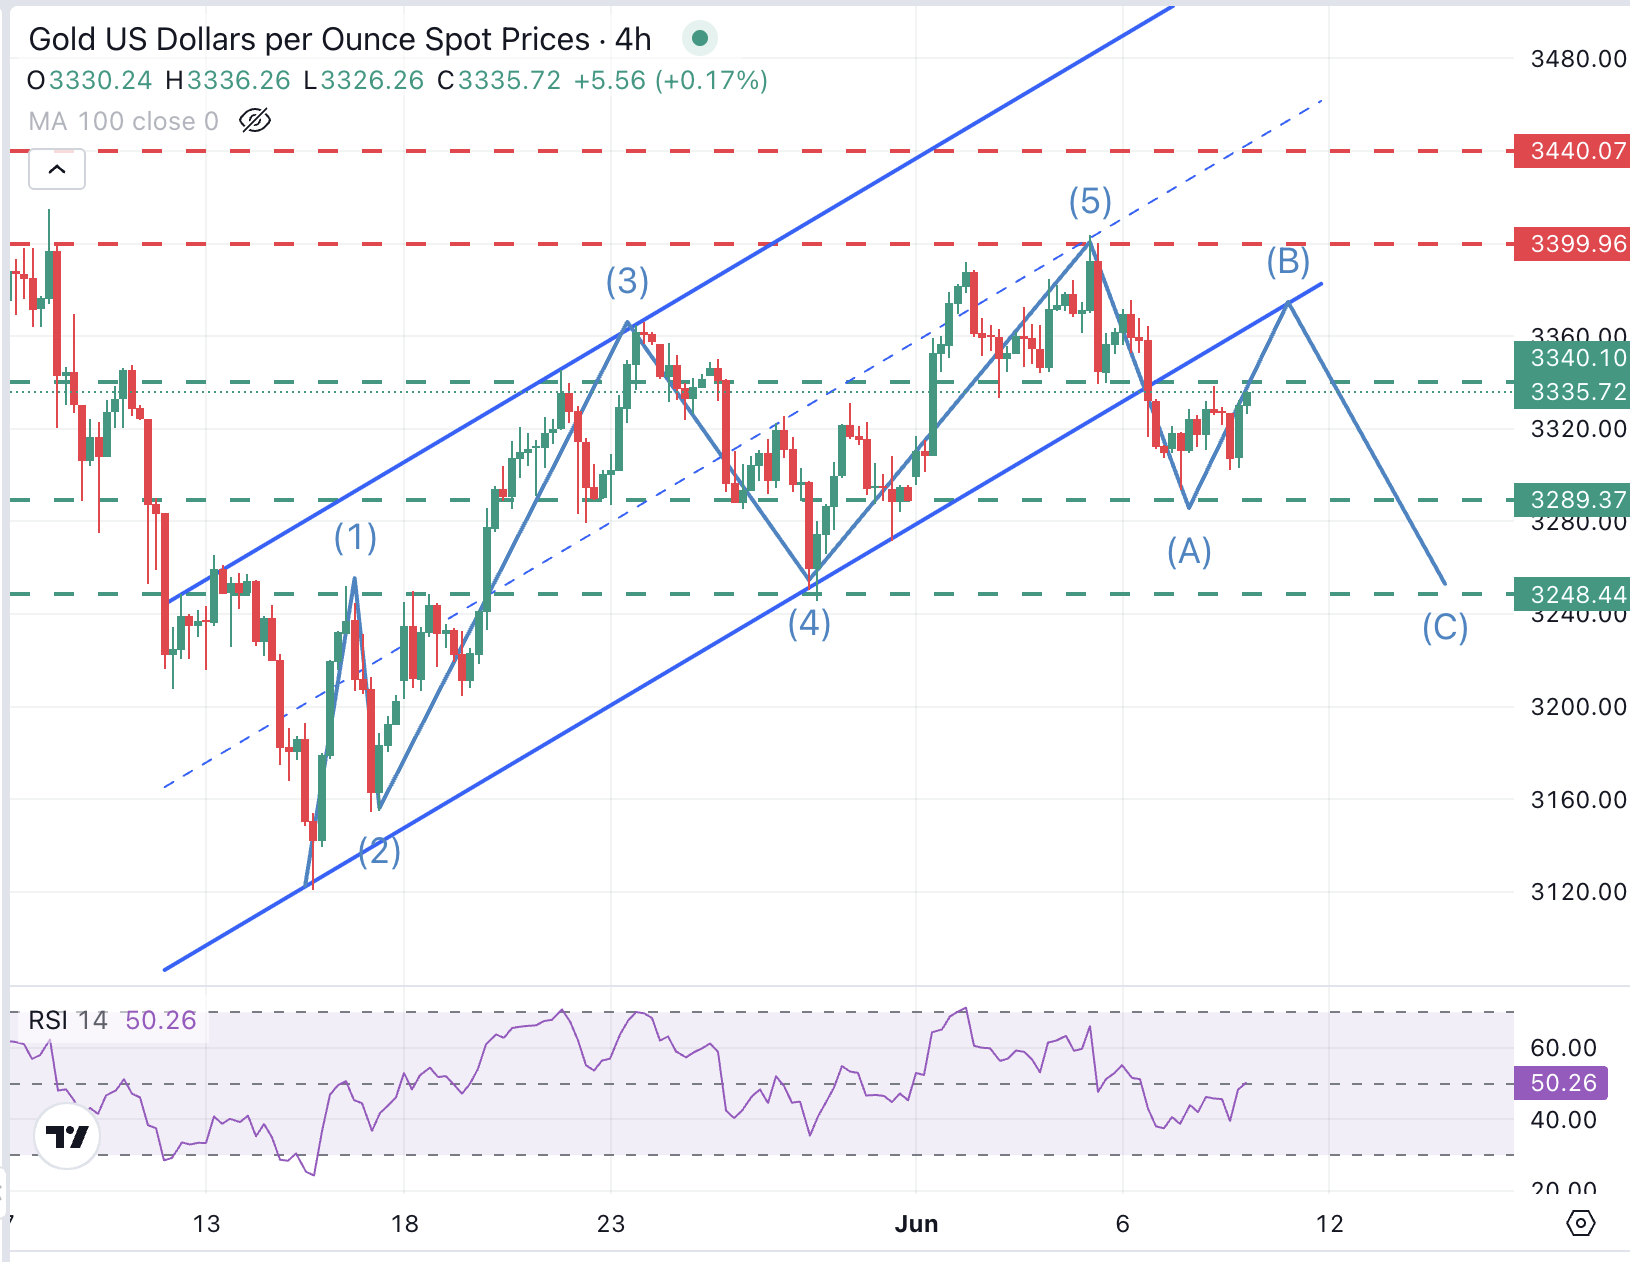
The broader trend remains negative, with the precious metal correcting lower following a rally from May 15 lows. Intraday charts, however, show a bullish reaction from $3,290, which looks likely to extend beyond the previous support, now turned resistance at $3,340.,
Elliott Wave analysts would say that the pair has confirmed the completion of a bullish cycle and is on a three-wave correction. In this case, we would be on the A-B leg, which might extend to the reverse trendline, now at $3,370, before extending lower.
On the downside, supports are at the June 9 low, $3,290, and the May 15 and 19 highs, and May 29 lows at $3,245.
XAU/USD 4-Hour Chart
US Dollar PRICE Today
The table below shows the percentage change of US Dollar (USD) against listed major currencies today. US Dollar was the strongest against the British Pound.
| USD | EUR | GBP | JPY | CAD | AUD | NZD | CHF | |
|---|---|---|---|---|---|---|---|---|
| USD | 0.00% | 0.34% | 0.01% | -0.00% | 0.05% | 0.00% | -0.06% | |
| EUR | -0.00% | 0.35% | 0.00% | 0.03% | 0.07% | 0.00% | -0.04% | |
| GBP | -0.34% | -0.35% | -0.41% | -0.33% | -0.28% | -0.35% | -0.38% | |
| JPY | -0.01% | 0.00% | 0.41% | 0.00% | -0.01% | -0.10% | -0.16% | |
| CAD | 0.00% | -0.03% | 0.33% | -0.00% | 0.03% | -0.02% | -0.06% | |
| AUD | -0.05% | -0.07% | 0.28% | 0.00% | -0.03% | -0.04% | -0.12% | |
| NZD | 0.00% | -0.00% | 0.35% | 0.10% | 0.02% | 0.04% | -0.04% | |
| CHF | 0.06% | 0.04% | 0.38% | 0.16% | 0.06% | 0.12% | 0.04% |
The heat map shows percentage changes of major currencies against each other. The base currency is picked from the left column, while the quote currency is picked from the top row. For example, if you pick the US Dollar from the left column and move along the horizontal line to the Japanese Yen, the percentage change displayed in the box will represent USD (base)/JPY (quote).
resistance
Artigos Recomendados


