

Silver Price Forecast: XAG/USD falls but clings to $31.00
- Silver prices decline as a risk-on mood and weak Chinese economic data weigh on the precious metal.
- Momentum favors buyers, but caution is warranted with the RSI showing signs of weakening.
- Key resistance lies at $31.63, with bulls aiming for $32.00 and the year-to-date high of $32.95. A break below $31.00 could target support at $30.76 and $30.12.
Silver's price dropped during the North American session on Monday, courtesy of a broad risk-on mood. China’s economy remains weak despite government efforts to stimulate consumer spending. Therefore, the XAG/USD trades at $31.25, down by over 0.88%.
XAG/USD Price Forecast: Technical outlook
After edging higher for two consecutive days, the XAG/USD has retreated somewhat, yet it remains above the $31.00 figure.
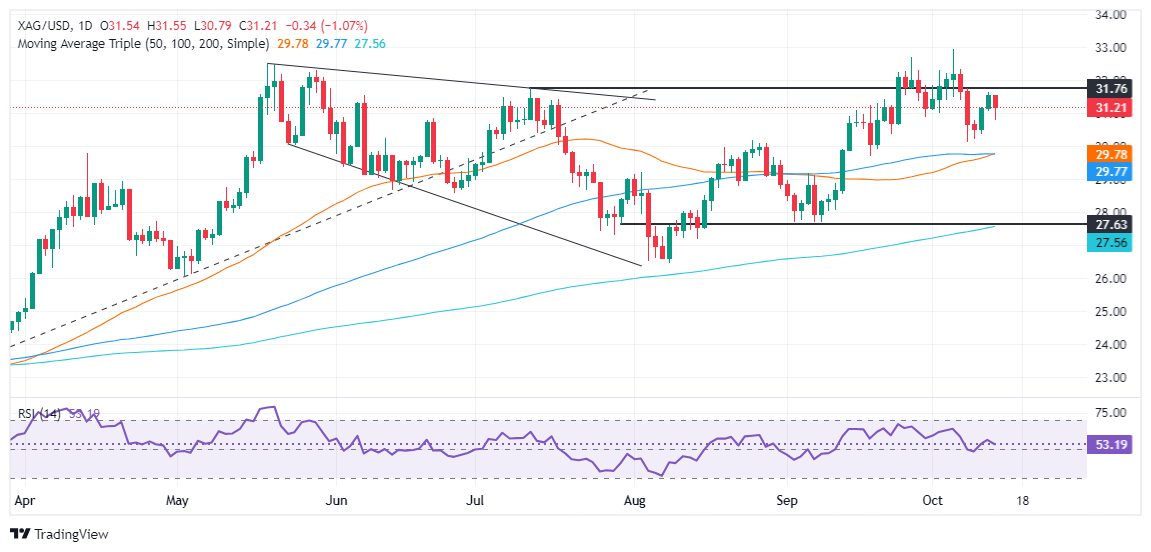
Momentum favors buyers in the near term, as shown by the Relative Strength Index (RSI), though caution is warranted, as RSI peaked below the latest two troughs.
For XAG/USD to resume its uptrend, bulls must clear the October 11 high at $31.63. If surpassed, the next stop would be the $32.00 figure, followed by the May 29 high at $32.29 and the May 20 at $32.50. Up next would be the year-to-date (YTD) high at $32.95.
Conversely, if sellers move in, the first support would be the $31.00 mark, followed by today’s low of $30.76. Once surpassed, the next stop would be the October 8 low of $30.12, followed by the confluence of the 50-100-day moving averages (DMAs) at $29.75/74.
XAG/USD Price Action – Daily Chart
Silver FAQs
Silver is a precious metal highly traded among investors. It has been historically used as a store of value and a medium of exchange. Although less popular than Gold, traders may turn to Silver to diversify their investment portfolio, for its intrinsic value or as a potential hedge during high-inflation periods. Investors can buy physical Silver, in coins or in bars, or trade it through vehicles such as Exchange Traded Funds, which track its price on international markets.
Silver prices can move due to a wide range of factors. Geopolitical instability or fears of a deep recession can make Silver price escalate due to its safe-haven status, although to a lesser extent than Gold's. As a yieldless asset, Silver tends to rise with lower interest rates. Its moves also depend on how the US Dollar (USD) behaves as the asset is priced in dollars (XAG/USD). A strong Dollar tends to keep the price of Silver at bay, whereas a weaker Dollar is likely to propel prices up. Other factors such as investment demand, mining supply – Silver is much more abundant than Gold – and recycling rates can also affect prices.
Silver is widely used in industry, particularly in sectors such as electronics or solar energy, as it has one of the highest electric conductivity of all metals – more than Copper and Gold. A surge in demand can increase prices, while a decline tends to lower them. Dynamics in the US, Chinese and Indian economies can also contribute to price swings: for the US and particularly China, their big industrial sectors use Silver in various processes; in India, consumers’ demand for the precious metal for jewellery also plays a key role in setting prices.
Silver prices tend to follow Gold's moves. When Gold prices rise, Silver typically follows suit, as their status as safe-haven assets is similar. The Gold/Silver ratio, which shows the number of ounces of Silver needed to equal the value of one ounce of Gold, may help to determine the relative valuation between both metals. Some investors may consider a high ratio as an indicator that Silver is undervalued, or Gold is overvalued. On the contrary, a low ratio might suggest that Gold is undervalued relative to Silver.
Artigos Recomendados


