EUR/CHF Price Analysis: Pullback possible amid mixed signals

Fonte Fxstreet
  • EUR/CHF touches 50-week SMA and recoils
  • RSI on daily chart indicates possibility of a pullback. 
  • Symmetrical Triangle has formed on 4-hour chart with breakout likely. 

EUR/CHF has rebounded from the 0.9254 December 2023 lows and rallied up to resistance from a key barrier in the form of the 50-week Simple Moving Average (SMA). The pair is probably still in a long-term downtrend despite recent strength. 
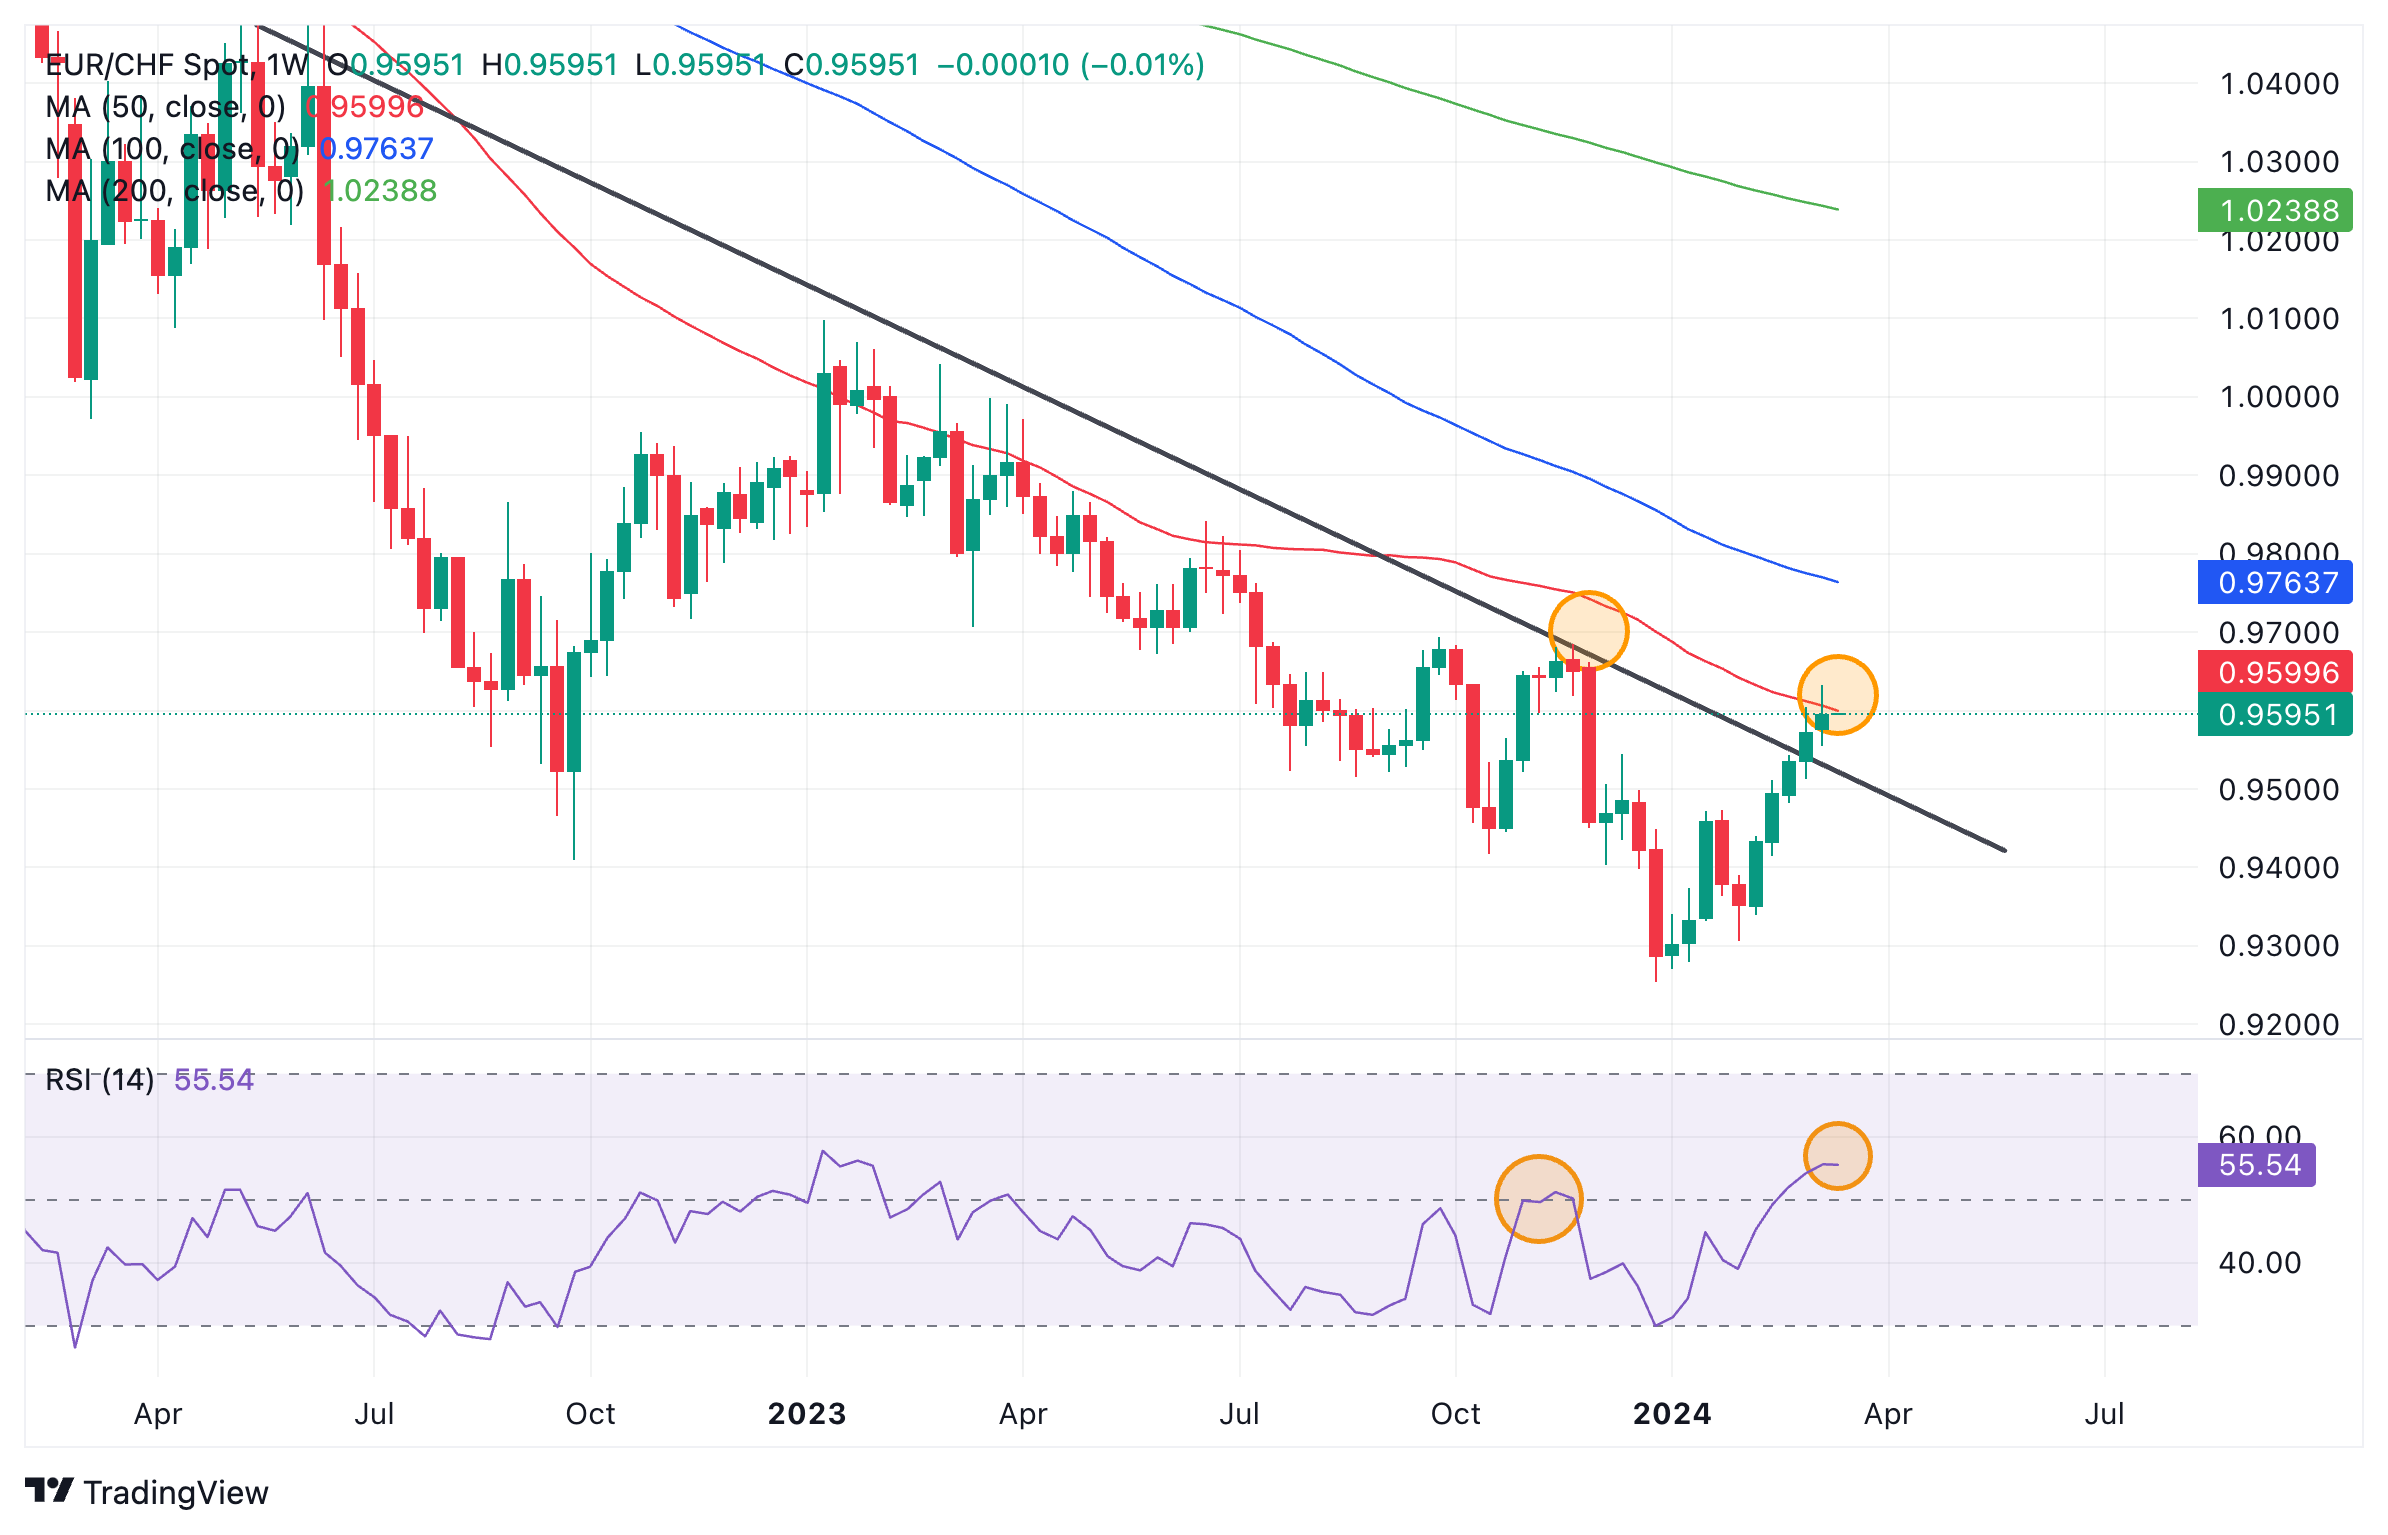
Euro to Swiss Franc: Weekly chart

The price has respected the red 50-week SMA on the multiple prior occasions it touched it during its downtrend. This reinforces the level’s strength as a resistance point. It probably indicates the price is about to pullback. There is a good chance it could correct back to the level of the trendline at around 0.9500 for a retest.  

The pair is converging with the Relative Strength Indicator (RSI), a momentum study. This is a bullish sign. The most recent peak in price was accompanied by a relatively higher peak in RSI when compared to the previous peak in price (circled). This is convergence and suggests underlying strength. 

A further bullish sign is that the pair has broken above the trendline. 
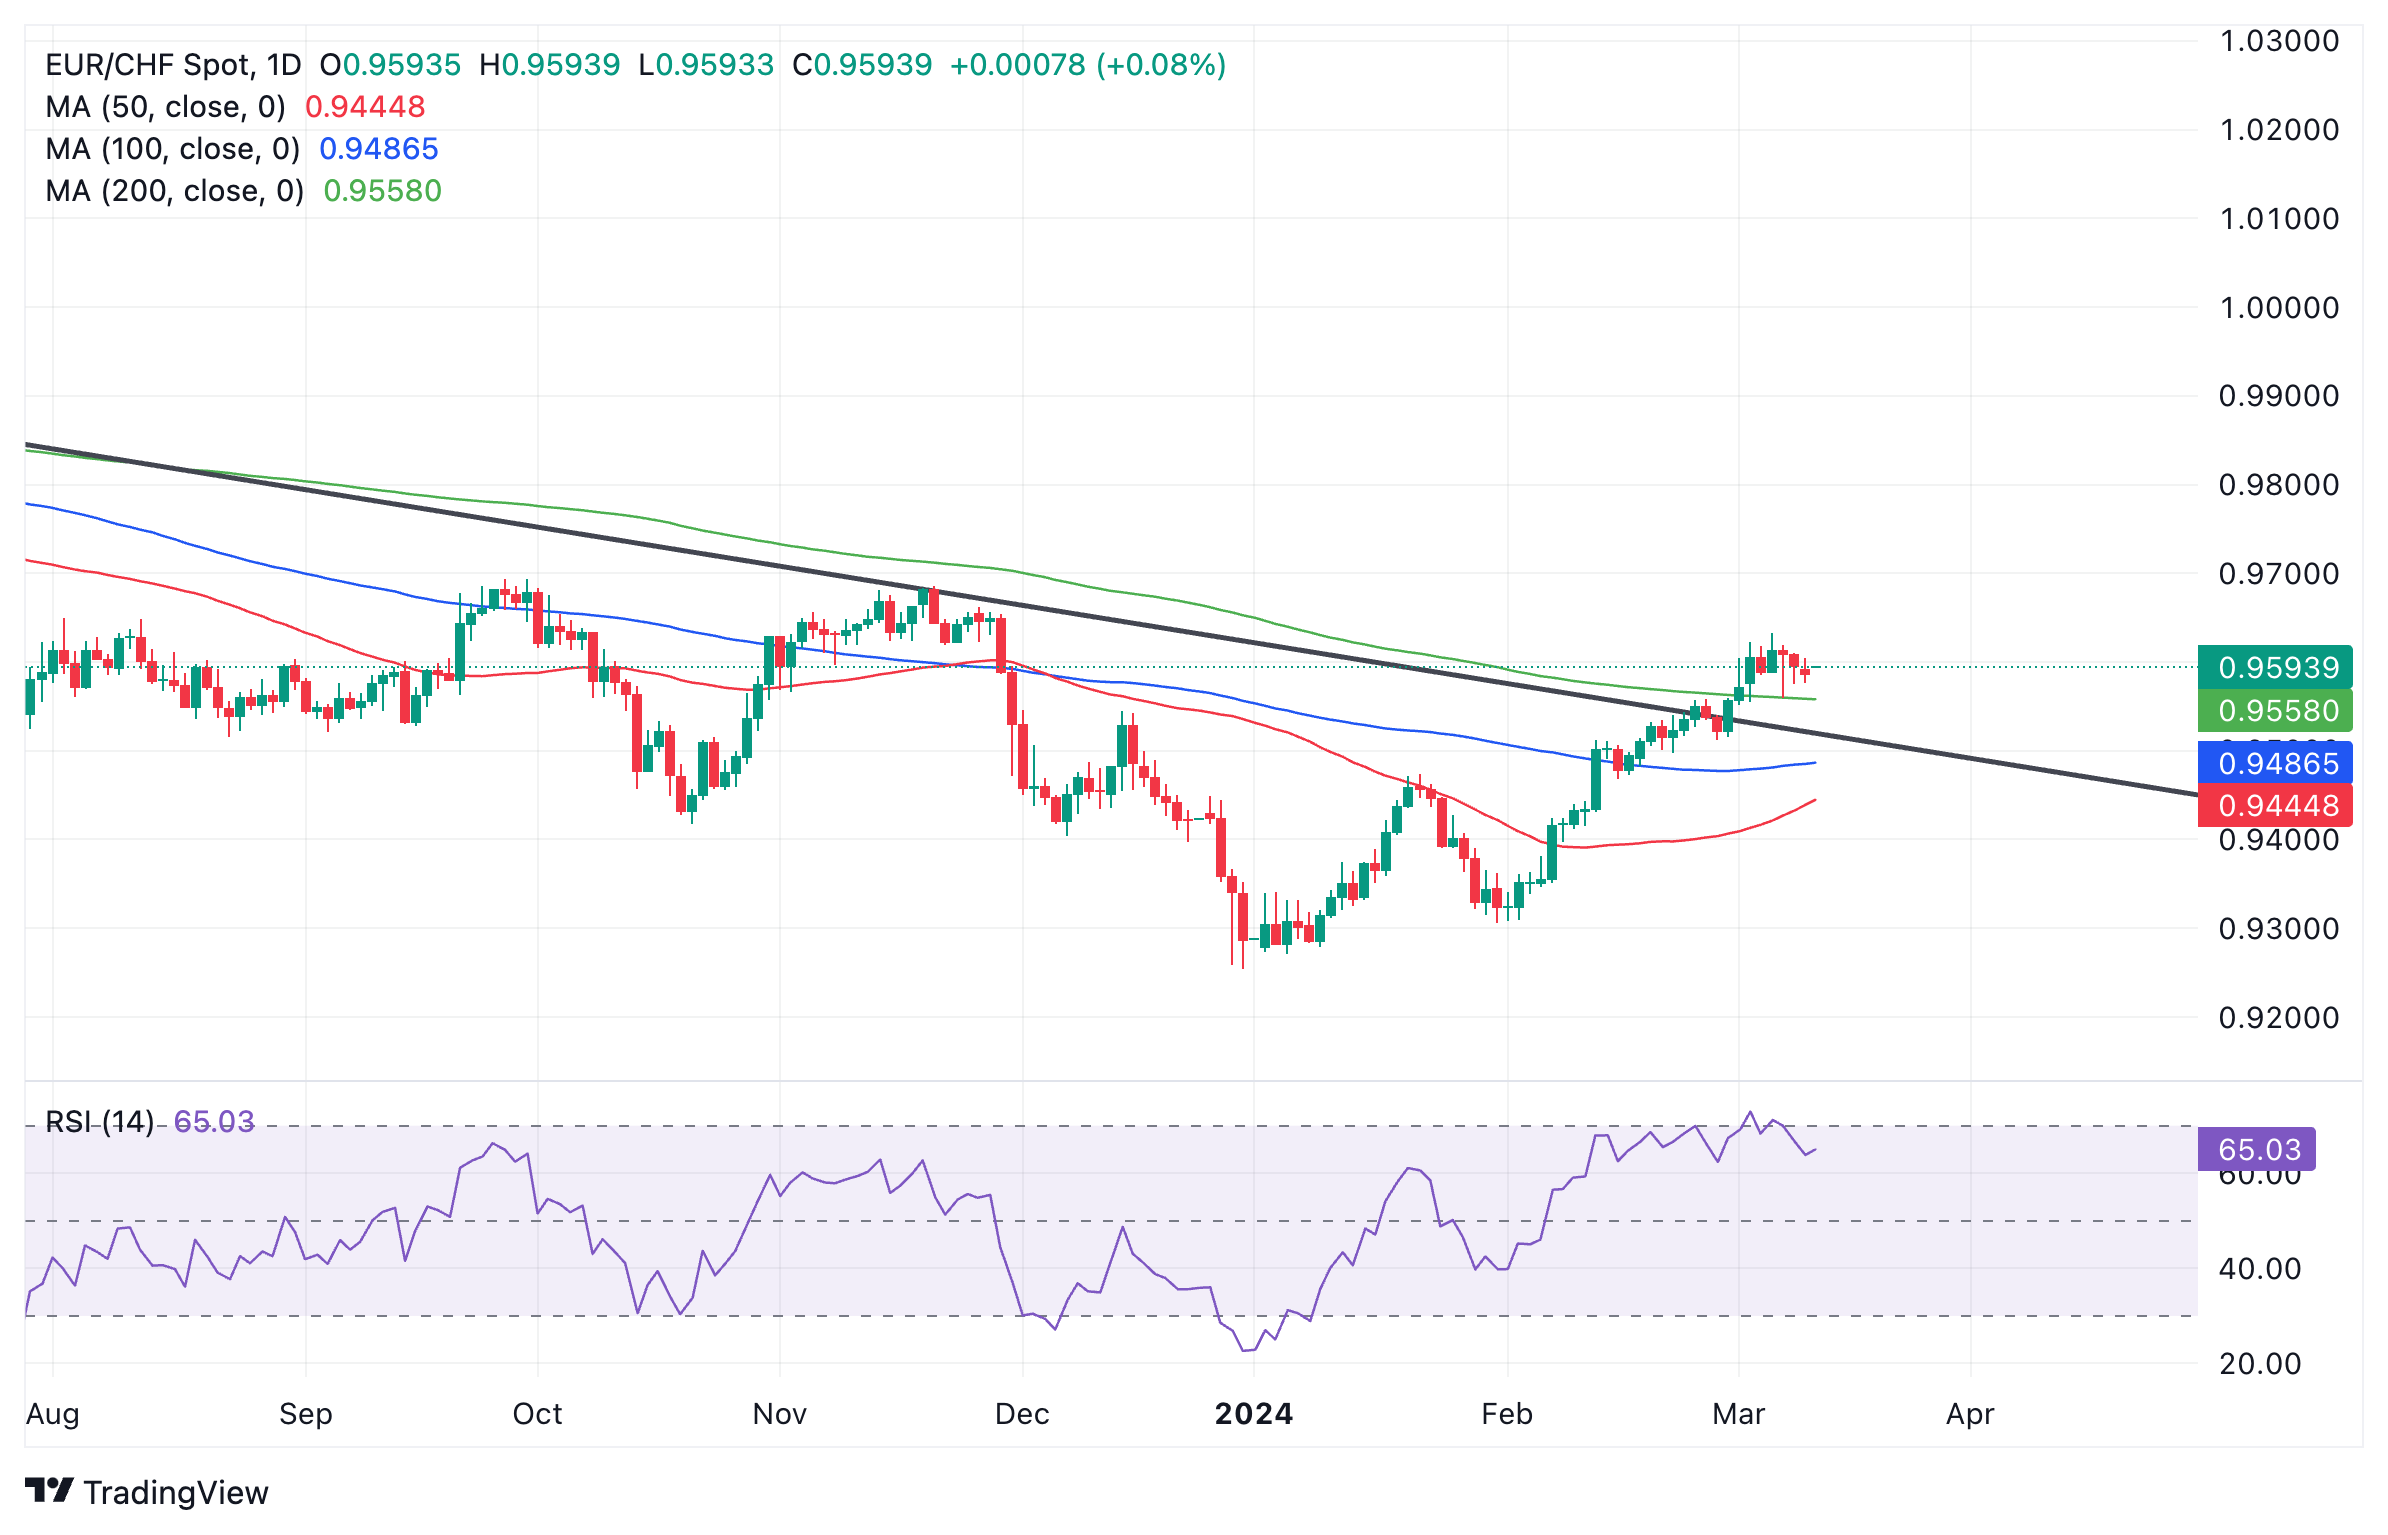
Euro to Swiss Franc: Daily chart

EUR/CHF has just exited overbought extremes on the RSI on the daily chart. This is interpreted as a signal to sell long positions and open short positions. It suggests the pair could pullback down, at least to the level of the trendline at about 0.9500. 

The pair has broken above all the key Moving Averages and the 200-day SMA is acting support. EUR/CHF has also moved above the previous higher low of the downtrend. These are both signs indicating that it is probably in a bullish intermediate trend, favoring bulls on that time horizon. 
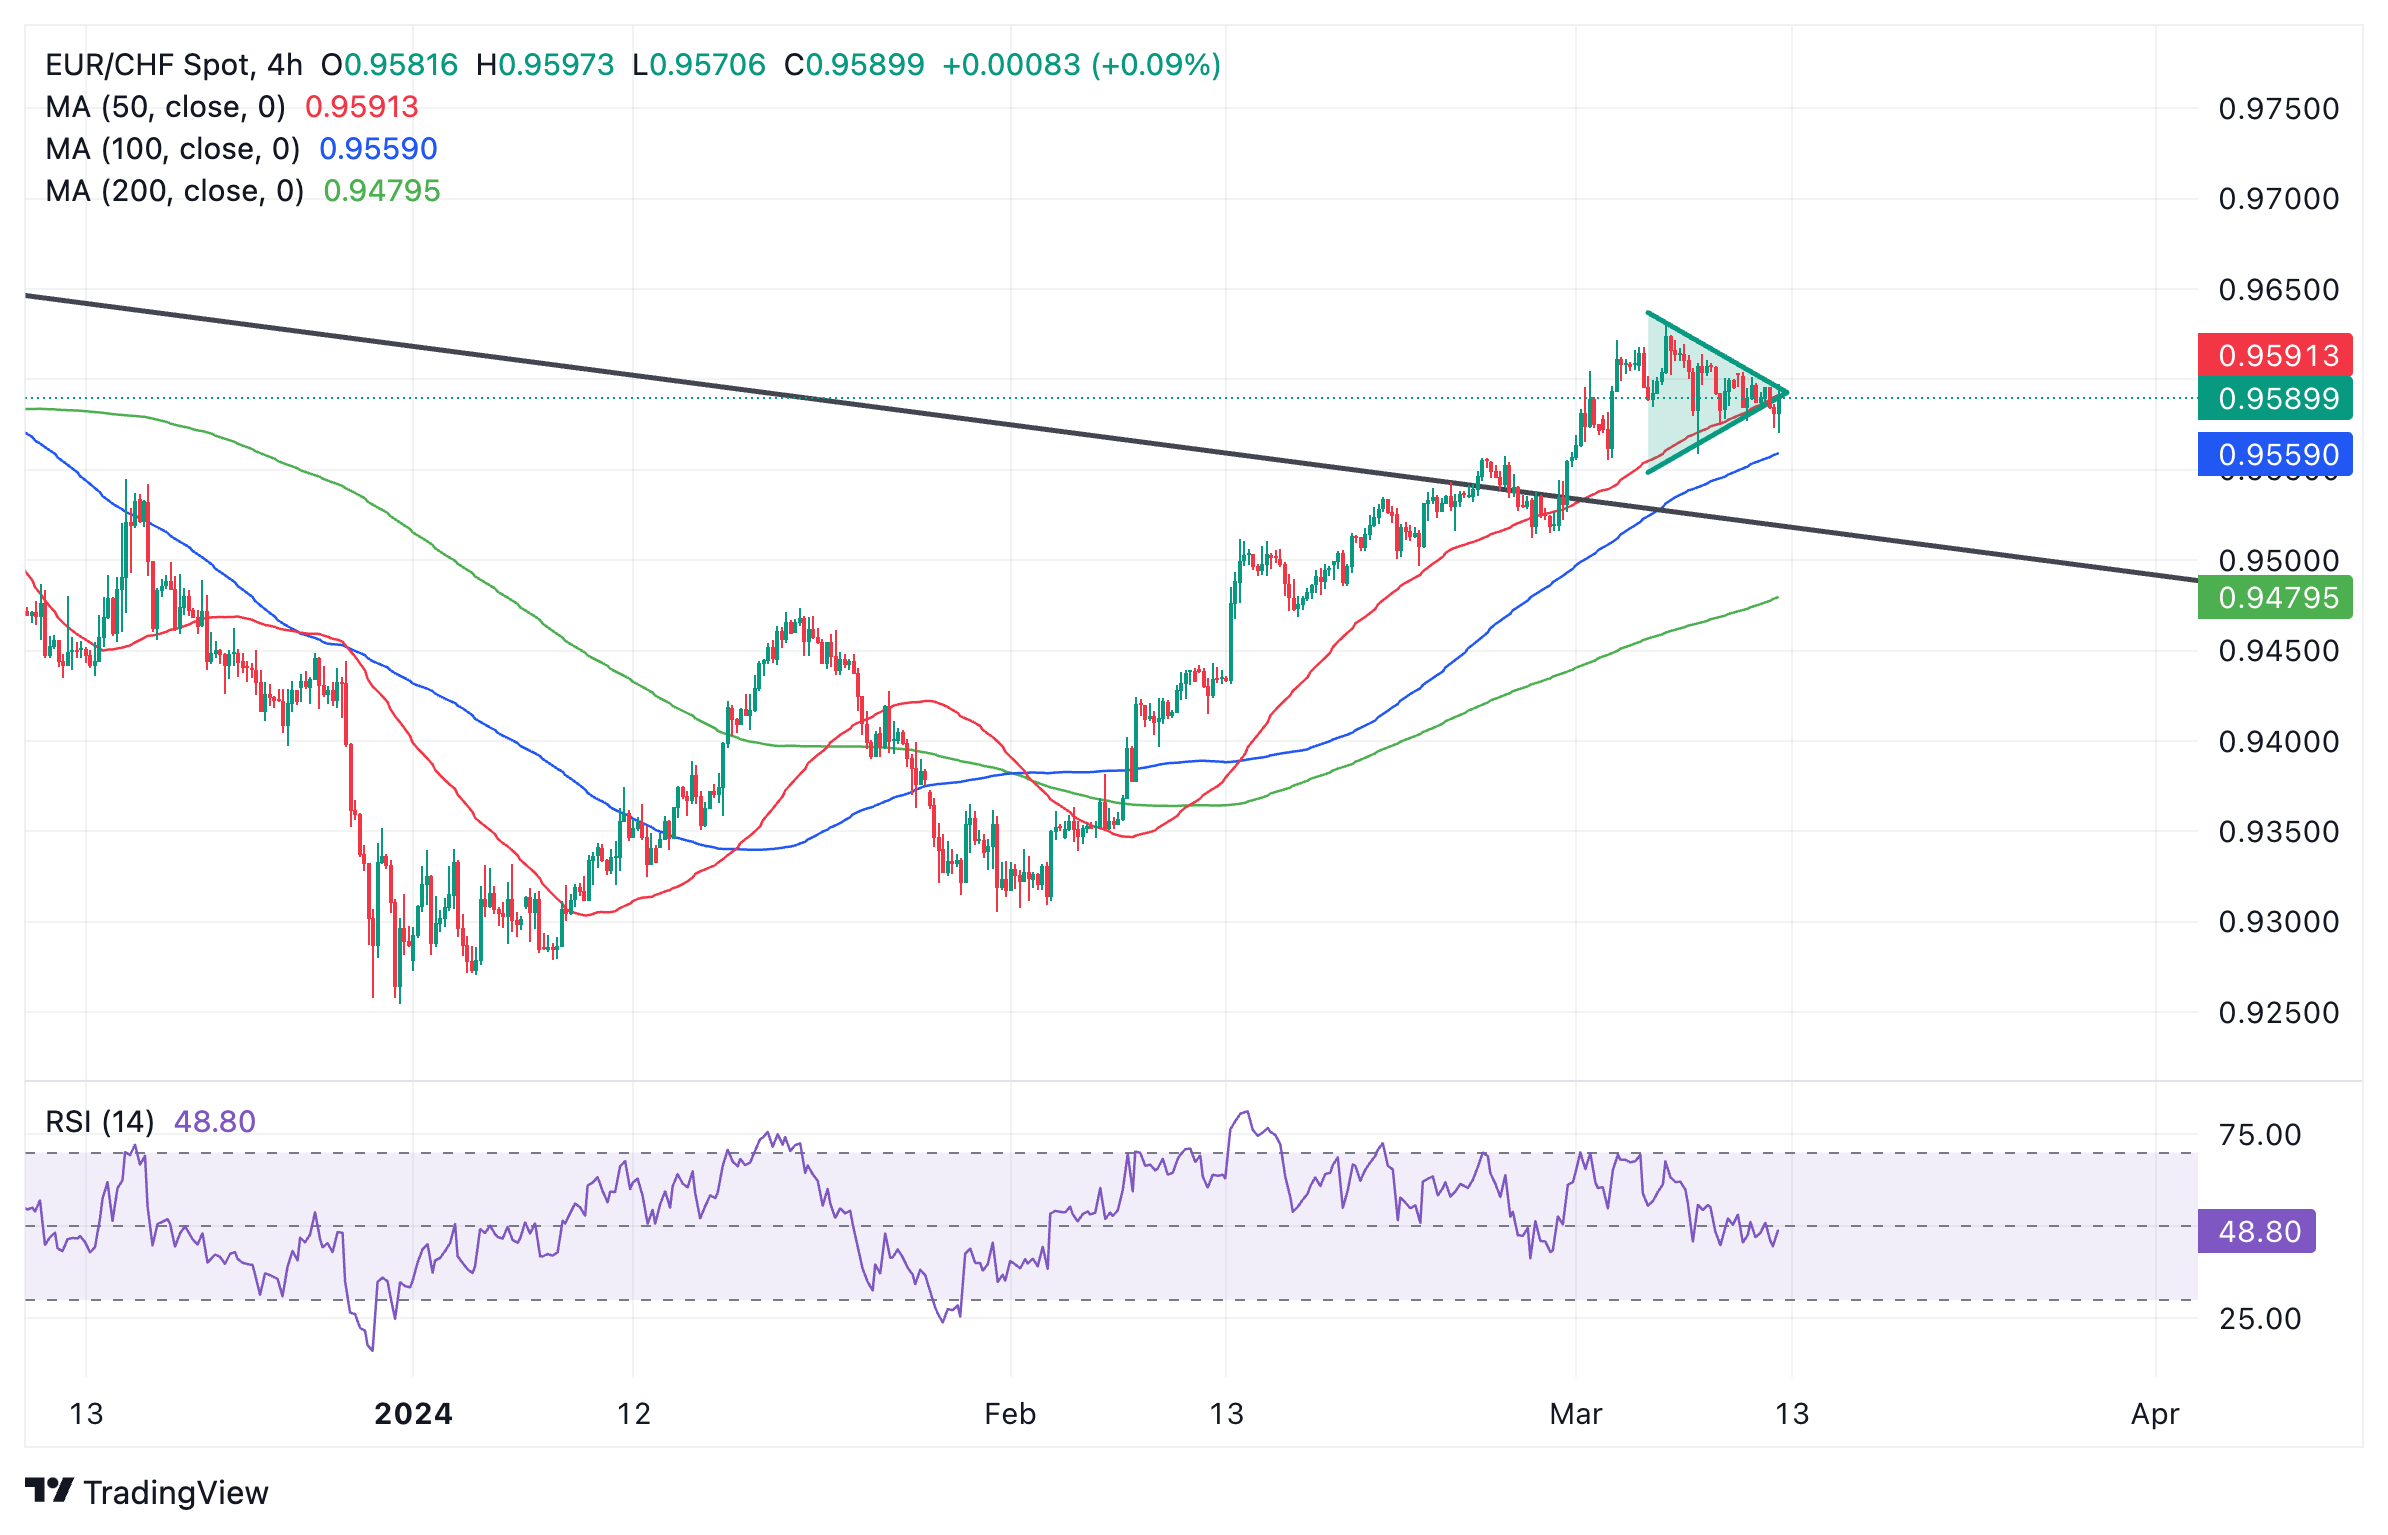
Euro to Swiss Franc: 4-hour chart

EUR/CHF has formed a Symmetrical Triangle on the 4-hour chart suggesting indecision. The pattern has equal chances of it breaking out in either direction, however, some analysts hold that the odds slightly favor a breakout in the direction of the trend prior to the formation of the triangle, which in this case is bullish. 

Should price breakout higher it will probably not rise very much higher before capitulating since triangles are usually the penultimate moves in trends.

The RSI has declined visibly during the formation of the triangle, however, suggesting underlying weakness and a chance price could break lower. 

The 4-hour chart is used to assess the short-term trend. The series of rising peaks and troughs since the December 2023 lows indicates the pair is in a short-term uptrend.


Isenção de responsabilidade: Apenas para fins informativos. O desempenho passado não é indicativo de resultados futuros.
placeholder
Ibovespa sobe 0,77% e fecha em 155 mil pontos, um novo recordeO Ibovespa emplacou sua 14ª sessão consecutiva de alta nesta segunda-feira (10), impulsionado pelo viés positivo no exterior, e renovou suas máximas históricas.
Autor  Pedro Augusto Prazeres
11 Mês 11 Dia Ter
O Ibovespa emplacou sua 14ª sessão consecutiva de alta nesta segunda-feira (10), impulsionado pelo viés positivo no exterior, e renovou suas máximas históricas.
placeholder
Dólar cai para R$ 5,27, mínima de 17 meses; Ouro recua em realização de lucros, mas se mantém acima de US$ 4.100O dólar fechou em forte baixa pela quinta sessão consecutiva no Brasil nesta terça-feira (11), atingindo seu menor valor em quase um ano e meio. A moeda americana à vista caiu 0,62%, aos R$ 5,2746, a menor cotação de fechamento desde 6 de junho de 2024. No ano, a divisa já acumula uma queda de 14,64%.
Autor  Pedro Augusto Prazeres
11 Mês 12 Dia Qua
O dólar fechou em forte baixa pela quinta sessão consecutiva no Brasil nesta terça-feira (11), atingindo seu menor valor em quase um ano e meio. A moeda americana à vista caiu 0,62%, aos R$ 5,2746, a menor cotação de fechamento desde 6 de junho de 2024. No ano, a divisa já acumula uma queda de 14,64%.
placeholder
RBRR11 avança em incorporação do PULV11; RECT11 tem salto de 165% no lucro com venda de ativosO fundo imobiliário RBR Rendimento High Grade (RBRR11), da RBR Asset, reportou um lucro de R$ 13,4 milhões em seu relatório gerencial de setembro. Com base nesse resultado, o fundo anunciou a distribuição de R$ 0,80 por cota.
Autor  Pedro Augusto Prazeres
11 Mês 14 Dia Sex
O fundo imobiliário RBR Rendimento High Grade (RBRR11), da RBR Asset, reportou um lucro de R$ 13,4 milhões em seu relatório gerencial de setembro. Com base nesse resultado, o fundo anunciou a distribuição de R$ 0,80 por cota.
placeholder
Bitcoin (BTC) cai a US$ 80 mil e confirma "Cruz da Morte"; perdas realizadas superam nível do colapso da FTXO Bitcoin (BTC) pode ter confirmado sua entrada oficial em um mercado de baixa ("bear market") após o preço despencar para a região de US$ 80.000 nesta sexta-feira (21). Essa visão pessimista é reforçada por uma convergência rara de indicadores técnicos negativos.
Autor  Pedro Augusto Prazeres
8 horas atrás
O Bitcoin (BTC) pode ter confirmado sua entrada oficial em um mercado de baixa ("bear market") após o preço despencar para a região de US$ 80.000 nesta sexta-feira (21). Essa visão pessimista é reforçada por uma convergência rara de indicadores técnicos negativos.
placeholder
Grupo Mateus (GMAT3) estende quedas; CVC (CVCB3) desaba 7,6% com dólar a R$ 5,40 e tensão políticaAs ações do Grupo Mateus (GMAT3) registraram queda pela sétima sessão consecutiva nesta sexta-feira (21). O movimento estende uma sequência negativa que já acumula perdas de cerca de 25% no período.
Autor  Pedro Augusto Prazeres
8 horas atrás
As ações do Grupo Mateus (GMAT3) registraram queda pela sétima sessão consecutiva nesta sexta-feira (21). O movimento estende uma sequência negativa que já acumula perdas de cerca de 25% no período.
Produtos relacionados
goTop
quote