
Australian Dollar steadies following mixed economic data from China
- The Australian Dollar declines due to risk aversion amid escalating Israel-Iran tensions.
- China’s Retail Sales climbed 6.4% YoY in May, against the market expectations of 5.0% rise.
- The Iranian Revolutionary Guard fired multiple missiles targeting Israeli military-industrial centers and fuel facilities.
The Australian Dollar (AUD) extends its losses against the US Dollar (USD) on Monday. The AUD/USD pair remains subdued for the second consecutive session due to escalating tensions in the Middle East. The AUD holds losses following the release of Chinese key economic data, given Australia and China are close trade partners.
China’s Retail Sales rose 6.4% year-over-year in May, surpassing the 5.0% expected and April’s 5.1% increase. Meanwhile, Industrial Production increased 5.8% YoY but below the 5.9% forecast and 6.1% prior.
Israel and Iran continue attacking each other despite international calls for diplomacy and de-escalation, per CNN. Iran fired multiple waves of ballistic missiles toward Israel. The Iranian Revolutionary Guard said their missiles successfully targeted Israeli military-industrial centers and fuel facilities.
According to local Officials, 224 people killed in Iran and 14 killed in Israel, while Iran's Ministry of Health said that at least 1,277 people have been injured since Israel launched the wave of attacks on Friday.
Iran informed mediators Qatar and Oman that Tehran "will not negotiate while under attack," according to an official briefed on the negotiations. The source said that “Reports Iran has approached Oman and Qatar with a request to engage the United States to broker a ceasefire with Israel and potentially renew nuclear negotiations are inaccurate.”
Australian Dollar declines as US Dollar appreciates amid rising geopolitical tensions
- The US Dollar Index (DXY), which measures the value of the US Dollar against six major currencies, is recovering losses and trading higher at around 98.10 at the time of writing. The US Michigan Consumer Sentiment will be eyed later on Friday.
- The University of Michigan (UoM) reported on Friday that the Consumer Sentiment Index climbed to 60.5 in June from 52.2 prior. This reading came in above the market consensus of 53.5.
- The US Producer Price Index (PPI) climbed 0.1% month-over-month in May, compared to a decline of 0.2% (revised from -0.5%). This reading came in softer than the expected 0.2% rise. Meanwhile, the core PPI, excluding food and energy, increased 0.1% MoM in May versus -0.2% prior (revised from -0.4%), below the consensus of 0.3%.
- The US Federal Reserve (Fed) is expected to keep its policy rate unchanged within the 4.25%–4.50% range in its upcoming decision on Wednesday. Traders now expect a 25 basis point rate cut by September.
- Reuters reported Thursday that President Trump expanded steel tariffs starting June 23 on imported “steel derivative products,” including household appliances, such as dishwashers, washing machines, refrigerators, etc. The tariffs were initially imposed at 25% in March and later doubled to 50% for most countries. This is the second time the scope of affected products has been expanded.
- President Trump posted on Truth Social on Wednesday that the trade deal with China is done and added that it is subject to his and Chinese President Xi Jinping's final approval. "We are getting a total of 55% tariffs, China is getting 10%. Relationship is excellent! Thank you for your attention to this matter."
- China will grant only six-month rare-earth export licenses for US automakers and manufacturers, which suggests that China wants to have control over critical minerals as leverage in future talks, per the Wall Street Journal (gated).
Australian Dollar holds losses below nine-day barrier near 0.6500
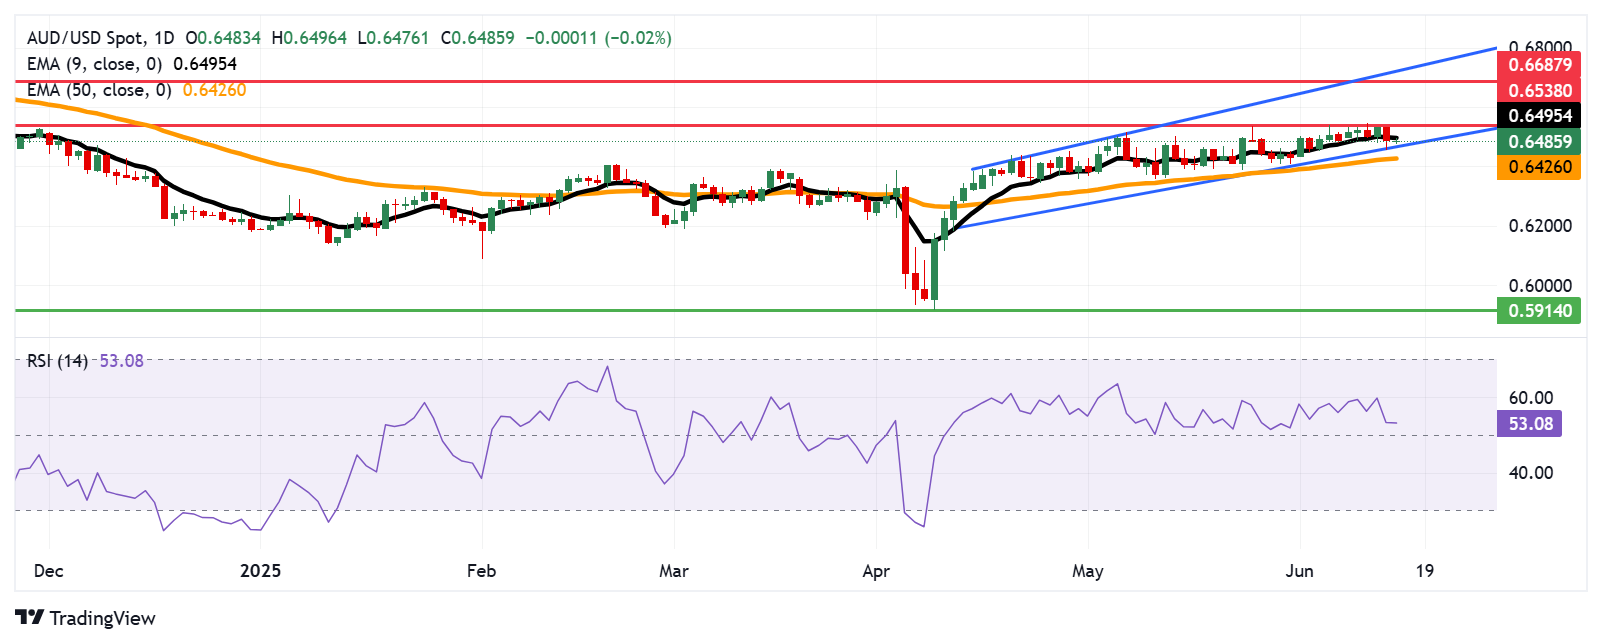
The AUD/USD pair is trading around 0.6480 on Monday. The bullish bias persists as the daily chart’s technical analysis indicates the pair remaining within the ascending channel. Additionally, the 14-day Relative Strength Index (RSI) is positioned slightly above the 50 mark, indicating a prevailing bullish outlook. However, the pair remains below the nine-day Exponential Moving Average (EMA), suggesting that short-term price momentum is weaker.
The immediate resistance appears at the nine-day EMA of 0.6495, followed by the seven-month high of 0.6538, which was reached on June 5. A break above this level could support the pair to target the eight-month high at 0.6687, followed by the upper boundary of the ascending channel around 0.6730.
On the downside, the AUD/USD pair may test the ascending channel’s lower boundary around the 0.6470. A break below the channel would indicate the weakening of the bullish bias and put downward pressure on the pair to test the 50-day EMA at 0.6425.
AUD/USD: Daily Chart
Australian Dollar PRICE Today
The table below shows the percentage change of Australian Dollar (AUD) against listed major currencies today. Australian Dollar was the weakest against the New Zealand Dollar.
| USD | EUR | GBP | JPY | CAD | AUD | NZD | CHF | |
|---|---|---|---|---|---|---|---|---|
| USD | 0.03% | 0.09% | -0.14% | 0.04% | -0.02% | -0.05% | 0.04% | |
| EUR | -0.03% | -0.06% | -0.20% | 0.02% | 0.07% | -0.08% | 0.02% | |
| GBP | -0.09% | 0.06% | -0.12% | 0.08% | 0.14% | 0.00% | 0.08% | |
| JPY | 0.14% | 0.20% | 0.12% | 0.19% | -0.18% | -0.27% | -0.22% | |
| CAD | -0.04% | -0.02% | -0.08% | -0.19% | 0.00% | -0.10% | -0.00% | |
| AUD | 0.02% | -0.07% | -0.14% | 0.18% | -0.01% | -0.15% | -0.05% | |
| NZD | 0.05% | 0.08% | -0.00% | 0.27% | 0.10% | 0.15% | 0.10% | |
| CHF | -0.04% | -0.02% | -0.08% | 0.22% | 0.00% | 0.05% | -0.10% |
The heat map shows percentage changes of major currencies against each other. The base currency is picked from the left column, while the quote currency is picked from the top row. For example, if you pick the Australian Dollar from the left column and move along the horizontal line to the US Dollar, the percentage change displayed in the box will represent AUD (base)/USD (quote).
Economic Indicator
Retail Sales (YoY)
The Retail Sales data, released by the National Bureau of Statistics of China on a monthly basis, measures the value of goods sold by retailers in China. Changes in Retail Sales are widely followed as an indicator of consumer spending. Percent changes reflect the rate of changes in such sales, with the YoY reading comparing sales values in the reference month with the same month a year earlier. Generally, a high reading is seen as bullish for the Renminbi (CNY), while a low reading is seen as bearish.
Read more.Last release: Mon Jun 16, 2025 02:00
Frequency: Monthly
Actual: 6.4%
Consensus: 5%
Previous: 5.1%
Source: National Bureau of Statistics of China
Artigos Recomendados


