
GBP/USD plunges as Israel-Iran conflict rattles markets, boosts US Dollar
- GBP/USD drops over 0.40%, pressured by weak UK data and BoE-Fed policy divergence favoring Dollar strength.
- Israel strikes Iranian nuclear and military sites; Iran retaliates with drone barrage, fueling global risk-off mood.
- US Dollar rallies on safe-haven flows and upbeat University of Michigan sentiment report for June.
GBP/USD tumbled over 0.40% on Friday as geopolitical tensions triggered a flow towards the Dollar haven status after Israel launched an attack on Iran, which escalated the Middle East conflict. The pair traded near 1.3550s after hitting a yearly peak of 1.3631.
Sterling drops from yearly high as war fears and strong US data lift haven demand
Israel's attacks targeted Iran's nuclear facilities, missile factories, and military commanders, according to Israeli officials. Iran media revealed that explosions were heard in Tehran and Natanz, the latter being crucial for the Iranian nuclear program.
Consequently, Iran retaliated against Israel and sent over 100 drones towards Israel.
Aside from geopolitics, the Greenback was boosted by the latest University of Michigan (UoM) Consumer Sentiment report in June, which showed that households are becoming more optimistic about the economy. The index rose from 52.2 to 60.5, while inflation expectations decreased for one year, from 6.6% to 5.1%, and for a five-year period, from 4.2% to 4.1%.
Across the pond, the UK’s economic docket was absent on Friday. Still, data during the week revealed that the economy is slowing. Manufacturing activity, employment, and economic growth figures paint a difficult scenario for Chancellor Rachel Reeves, who announced the spending review.
In the short term, the path of least resistance is that the GBP/USD might continue to edge lower due to risk aversion. Additionally, divergence among central banks would favor the US Dollar, as Federal Reserve (Fed) officials adopted a more neutral to restrictive stance.
Meanwhile, the swaps markets had priced in 50 basis points of easing of the Bank of England (BoE) towards the end of the year.
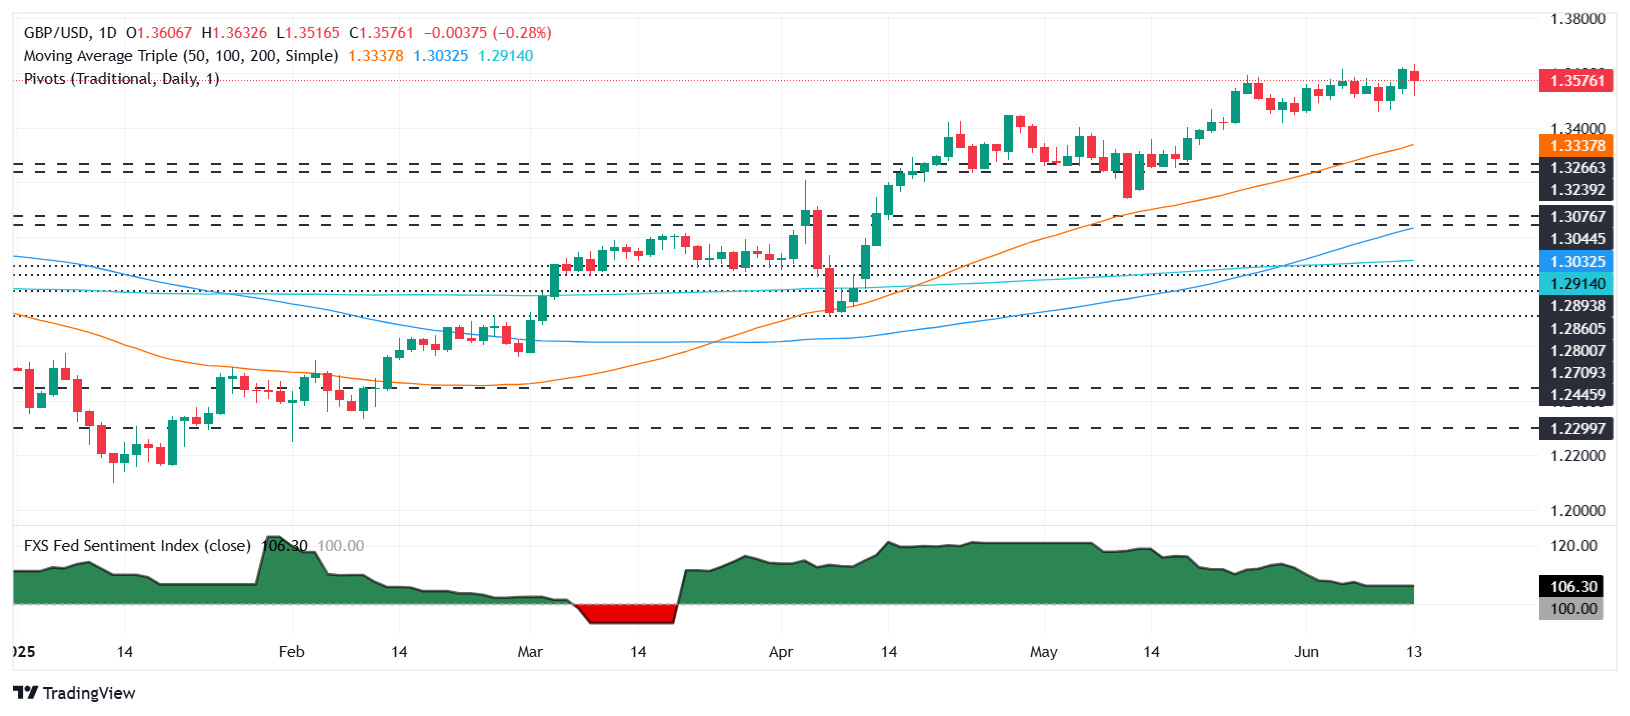
GBP/USD Price Forecast: Technical outlook
The GBP/USD could consolidate in the near term, despite the pair hitting a two-day low of 1.3515. However, buyers bought the dip, and had pushed the pair higher, with them targeting the 1.36 mark. The Relative Strength Index (RSI) remains bullish but is approaching its 50-neutral line, indicating that buyers are taking a breather.
IF GBP/USD clears 1.3600, the next resistance would be YTD high at 1.3631, followed by 1.37. Conversely, if the pair slumps below 1.3550, it would open the door to challenge 1.3500.
British Pound PRICE This week
The table below shows the percentage change of British Pound (GBP) against listed major currencies this week. British Pound was the strongest against the Australian Dollar.
| USD | EUR | GBP | JPY | CAD | AUD | NZD | CHF | |
|---|---|---|---|---|---|---|---|---|
| USD | -1.28% | -0.35% | -0.48% | -0.75% | -0.02% | -0.17% | -1.15% | |
| EUR | 1.28% | 0.93% | 0.80% | 0.52% | 1.29% | 1.12% | 0.12% | |
| GBP | 0.35% | -0.93% | -0.04% | -0.40% | 0.37% | 0.19% | -0.80% | |
| JPY | 0.48% | -0.80% | 0.04% | -0.27% | 0.41% | 0.26% | -0.79% | |
| CAD | 0.75% | -0.52% | 0.40% | 0.27% | 0.72% | 0.59% | -0.40% | |
| AUD | 0.02% | -1.29% | -0.37% | -0.41% | -0.72% | -0.17% | -1.15% | |
| NZD | 0.17% | -1.12% | -0.19% | -0.26% | -0.59% | 0.17% | -0.98% | |
| CHF | 1.15% | -0.12% | 0.80% | 0.79% | 0.40% | 1.15% | 0.98% |
The heat map shows percentage changes of major currencies against each other. The base currency is picked from the left column, while the quote currency is picked from the top row. For example, if you pick the British Pound from the left column and move along the horizontal line to the US Dollar, the percentage change displayed in the box will represent GBP (base)/USD (quote).
Artigos Recomendados


