
USD/INR Price Forecast: US Dollar bulls battle for control at 85.41
- USD/INR trades sideways near 85.41, pushing prices into a zone of consolidation.
- Moving averages are converging tightly, indicating low volatility and a potential breakout.
- Support between 84.23 and 83.69 is crucial for the long-term bullish structure to hold.
The Indian Rupee (INR) is showing signs of stability against the US Dollar (USD) on Thursday, with the USD/INR pair trading near 85.41. This level reflects consolidation within a broader correction range following the volatile price action in May.
The market is currently digesting gains after reaching an all-time high of 93.27 earlier in the month and is now anchored between defined Fibonacci levels and Simple Moving Averages (SMA).
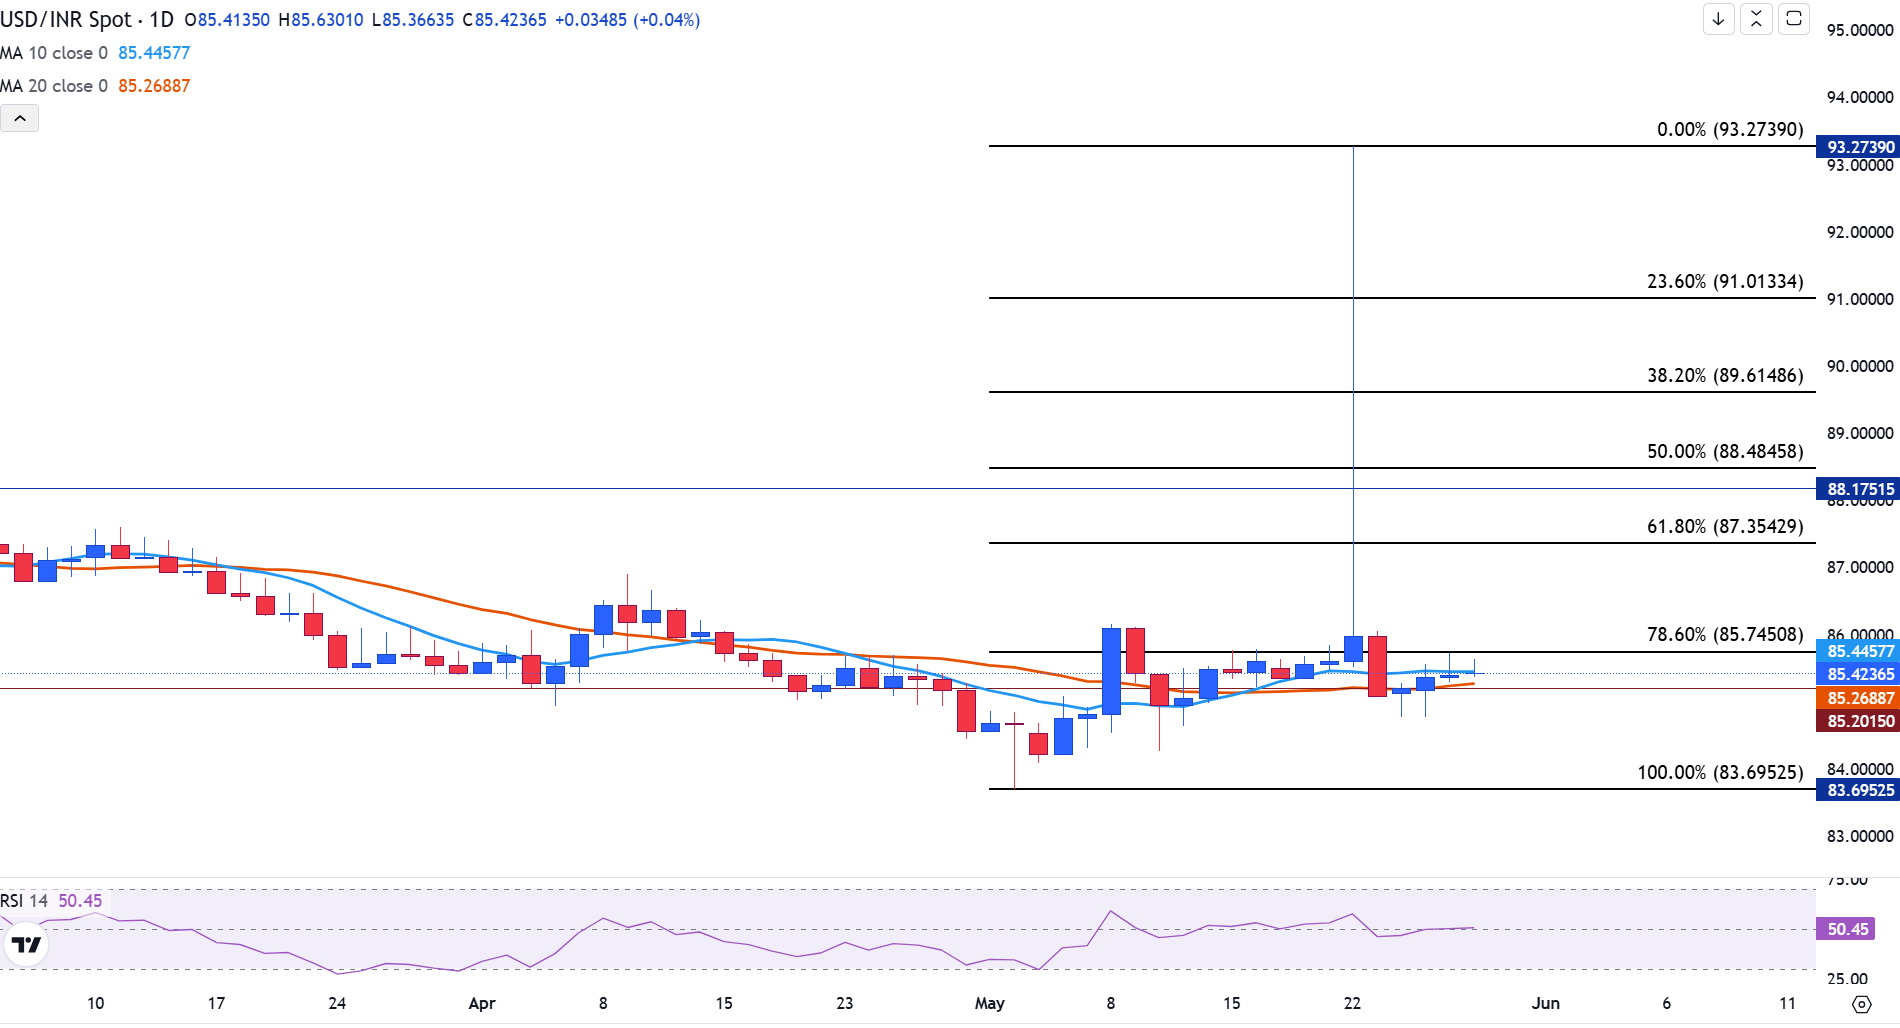
The USD/INR daily chart shows the pair trading sideways, hovering around 85.41, just beneath the critical 78.6% Fibonacci retracement level at 85.74, calculated from the May high of 93.27 to the low of 83.69.
The 10-day and 20-day SMAs, at 85.44 and 85.26, respectively, are converging tightly, signaling a lack of directional conviction. The Relative Strength Index (RSI) at 50 reflects neutrality.
USD/INR daily chart
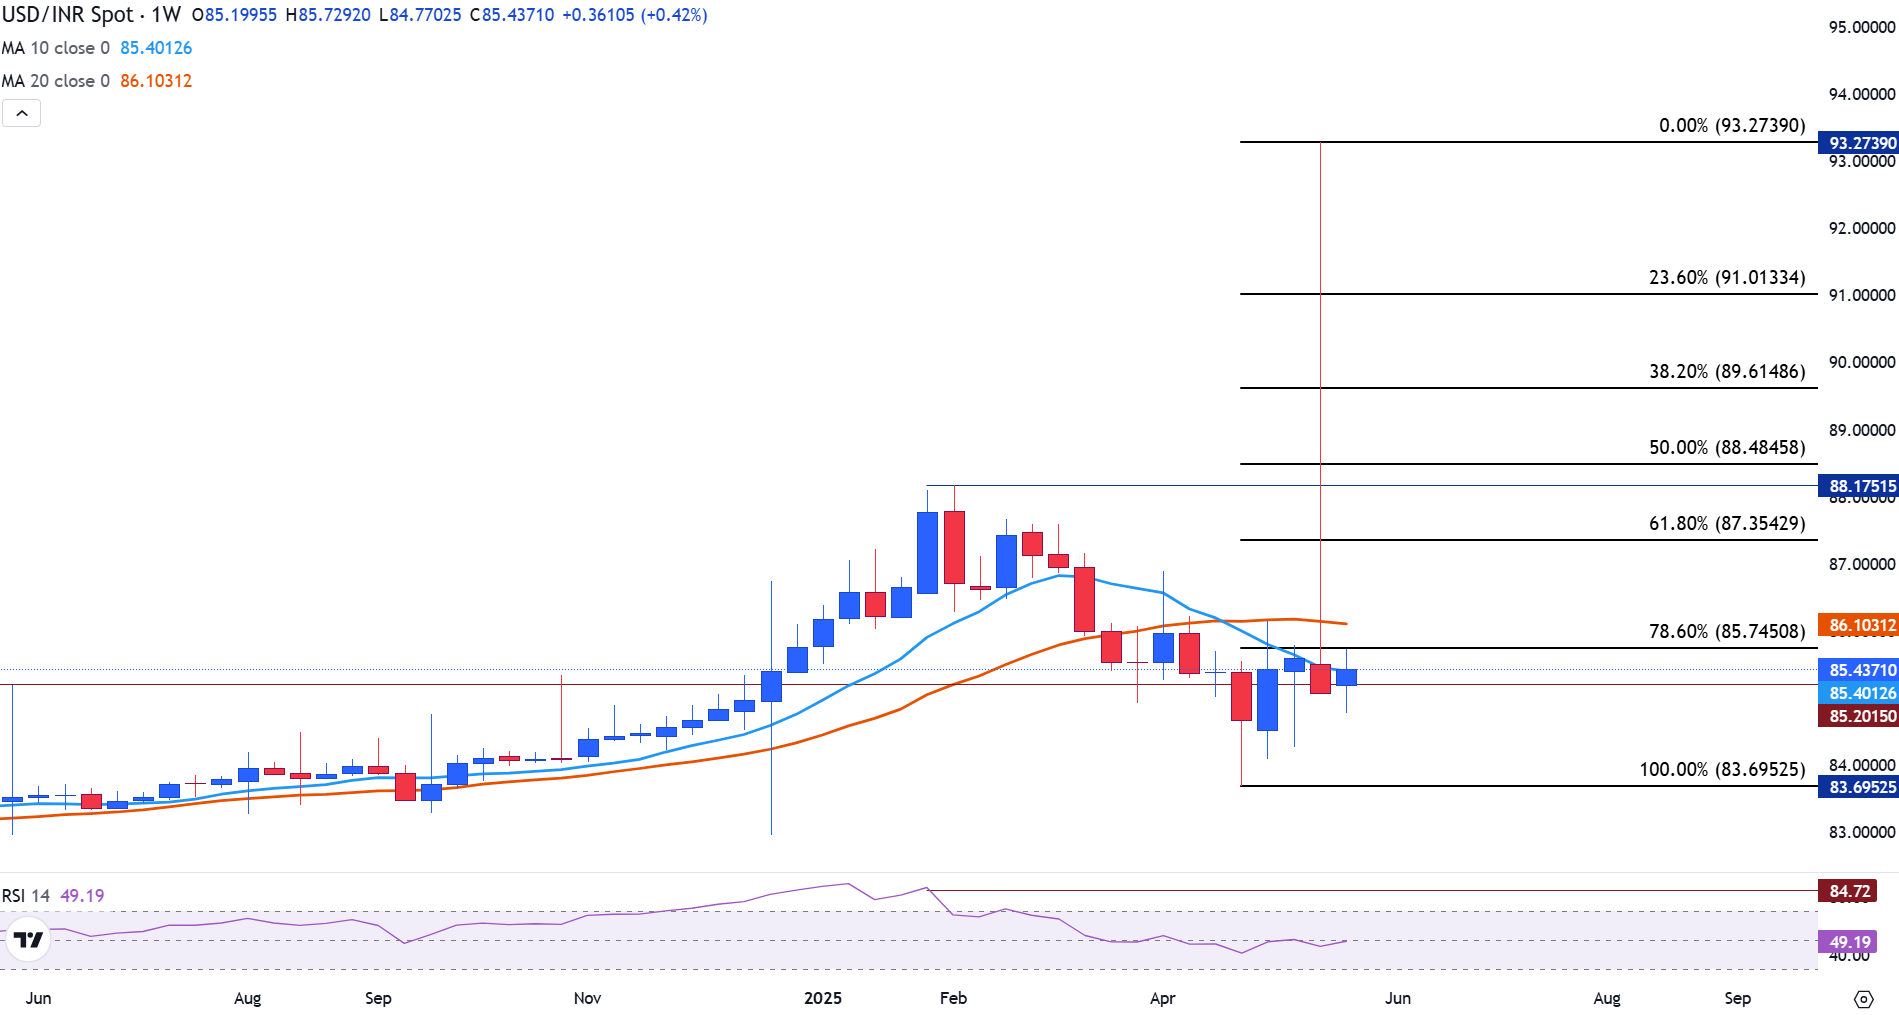
On the weekly timeframe, USD/INR remains in a sensitive zone, trading around 85.40, which is almost exactly aligned with the 10-week simple moving average (SMA) at 85.39.
Above, the 78.6% Fibonacci level at 85.74 continues to act as firm resistance, reinforced by the 20-week simple moving average (SMA) at 86.10.
USD/INR weekly chart
Zooming out to the monthly chart, USD/INR’s bullish momentum peaked in February with a high of 88.17, pushing the RSI above 84, a clear indication of overbought conditions.
USD/INR monthly chart
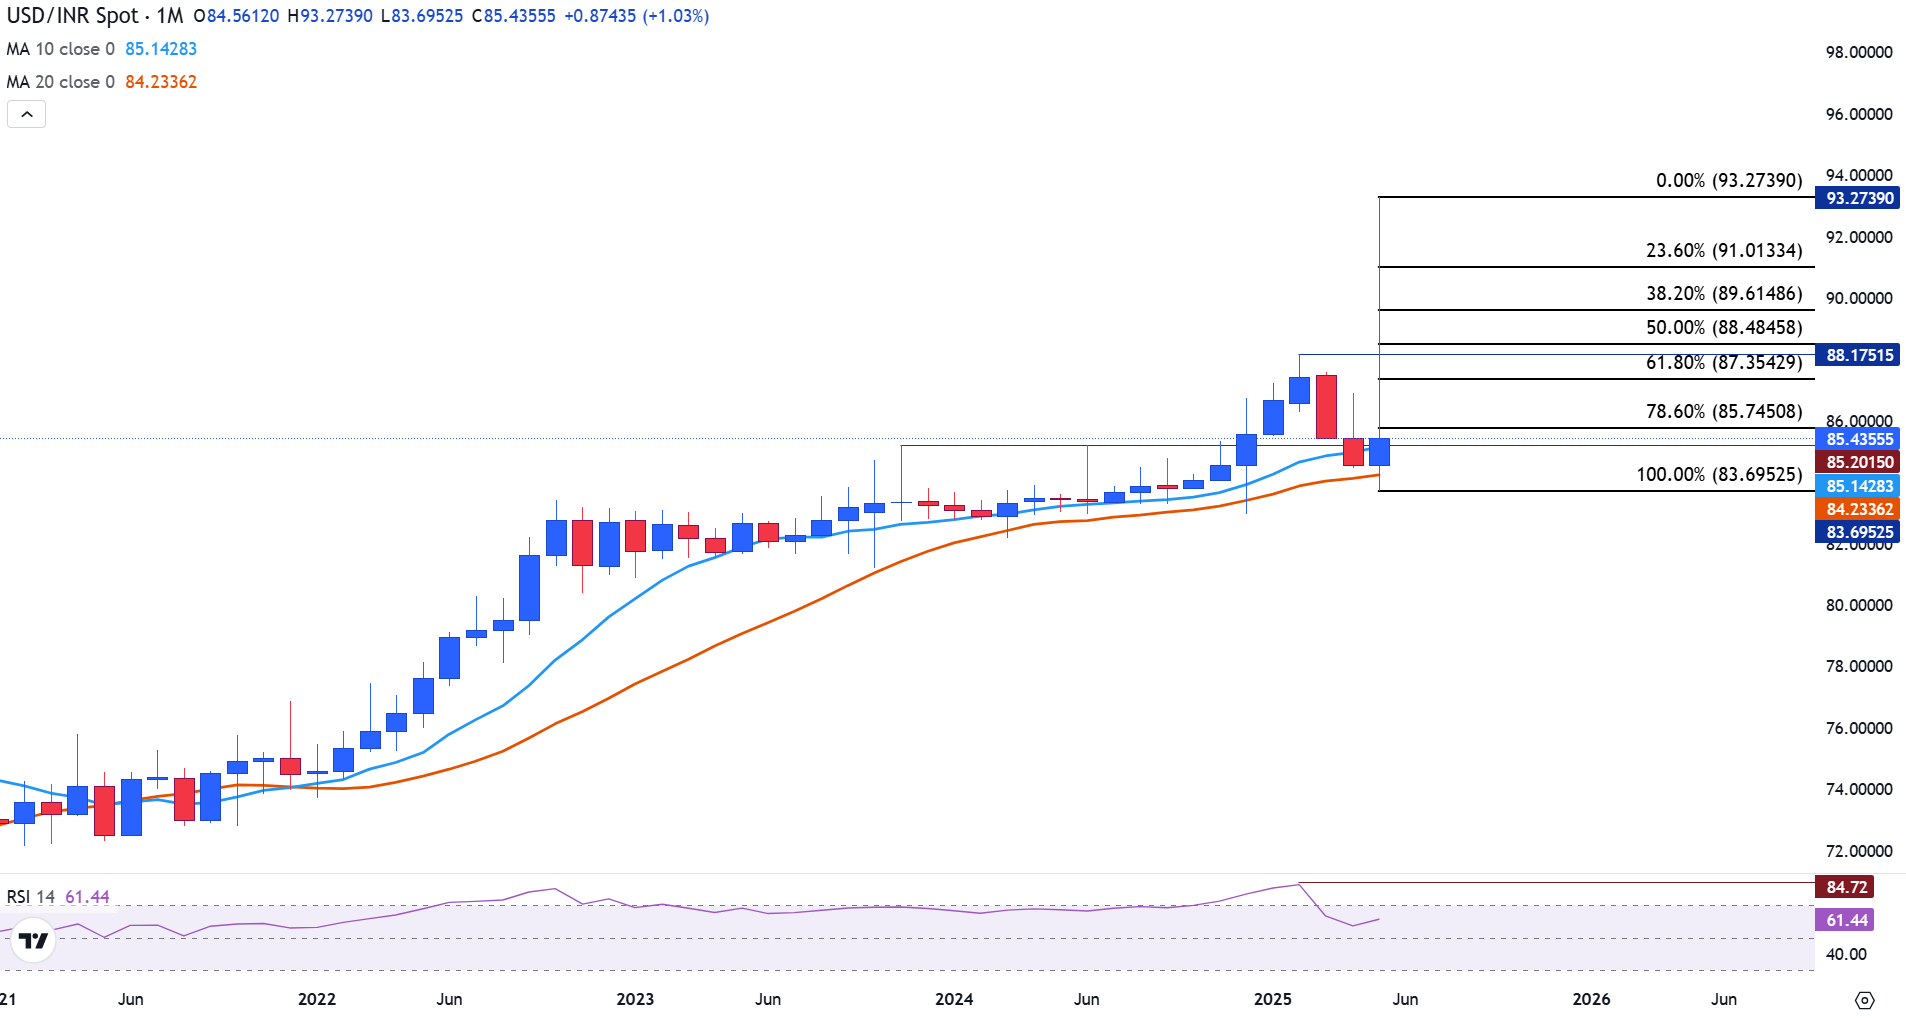
This was followed by a two-month retracement that reset RSI below 70. In May, bullish momentum returned, briefly driving the pair to a new record high of 93.27 before sellers aggressively reversed the move.
Prices have since pulled back and are currently holding just above the 20-month SMA at 84.23. This level, along with the May low of 83.69, forms a strong support zone. If it holds, the long-term uptrend remains intact; if breached, the risk of a broader reversal increases.
Indian economy FAQs
The Indian economy has averaged a growth rate of 6.13% between 2006 and 2023, which makes it one of the fastest growing in the world. India’s high growth has attracted a lot of foreign investment. This includes Foreign Direct Investment (FDI) into physical projects and Foreign Indirect Investment (FII) by foreign funds into Indian financial markets. The greater the level of investment, the higher the demand for the Rupee (INR). Fluctuations in Dollar-demand from Indian importers also impact INR.
India has to import a great deal of its Oil and gasoline so the price of Oil can have a direct impact on the Rupee. Oil is mostly traded in US Dollars (USD) on international markets so if the price of Oil rises, aggregate demand for USD increases and Indian importers have to sell more Rupees to meet that demand, which is depreciative for the Rupee.
Inflation has a complex effect on the Rupee. Ultimately it indicates an increase in money supply which reduces the Rupee’s overall value. Yet if it rises above the Reserve Bank of India’s (RBI) 4% target, the RBI will raise interest rates to bring it down by reducing credit. Higher interest rates, especially real rates (the difference between interest rates and inflation) strengthen the Rupee. They make India a more profitable place for international investors to park their money. A fall in inflation can be supportive of the Rupee. At the same time lower interest rates can have a depreciatory effect on the Rupee.
India has run a trade deficit for most of its recent history, indicating its imports outweigh its exports. Since the majority of international trade takes place in US Dollars, there are times – due to seasonal demand or order glut – where the high volume of imports leads to significant US Dollar- demand. During these periods the Rupee can weaken as it is heavily sold to meet the demand for Dollars. When markets experience increased volatility, the demand for US Dollars can also shoot up with a similarly negative effect on the Rupee.
Artigos Recomendados


